Welcome to AmiBroker Academy dot com, amibrokeracademy.com.
If There is Only One Chart This is It
Moses Power Stock Chart.
We Believe – Buy Support or Sell Resistance.
1) Golden Agri-Resources and MACD
Price Action reflect the market emotions, it factor in news, buy or sell emotions.
When the market is bullish, how you trade you eventually still make money. When the market is sideways. You have to ride the wave on buy the bull bias and sell when it is bear.
There are a lot of uncertainty in the current market, many whom make money on crypto are liquidating to keep a float.
Bollinger Bands is an interesting indicator. The price action is trapped with the Bollinger Bands, Bollinger Bands is like rubber band. It is either expand or narrow. Moving Average is a great visual tool. MACD indicator is a easy to understand indicator. Support and Resistance is important and fundamental tool for trading.
When the price action continue to move higher but MACD is weaker, the price action may be change in direction. The opposite is true too, when price action is weaker, forming lower low but the MACD or MACD Histogram is forming higher low. Price action is also may be change in direction. Manage your trade.
Manage your risk.
Think Think got more Things
In trading, some predict the up or down on the trend. Here, we look for support, strong support to buy. Or take profit when price action test the resistance.
The above result is for illustration purpose. It is meant to be used for learning buy or sell signals. We do not recommend for any particular stocks. If particular stocks of such are mentioned, they are meant as a demonstration of Amibroker as a powerful charting software. Amibroker is a charting software, it can program to scan the stocks for buy and sell signals. Or backtest for any trading strategy or technique.
We post script generated signals. Not all scan results are shown here depending on selection criterial. The MACD signal should use with price action. Users must understand what MACD and price action are all about before using them. If necessary you should attend a course to learn more on Technical Analysis (TA) and Moving Average Convergence Divergence, MACD.
Once again, the website does not guarantee any results or investment return based on the information and instruction you have read here. It should be used as learning aids only and if you decide to trade real money, all trading decision should be your own.
We learn from many past and present great traders. Kudo to these master.
Welcome to AmiBroker Academy dot com, amibrokeracademy.com.
If There is Only One Chart This is It
Moses Power Stock Chart.
We Believe – Buy Support or Sell Resistance.
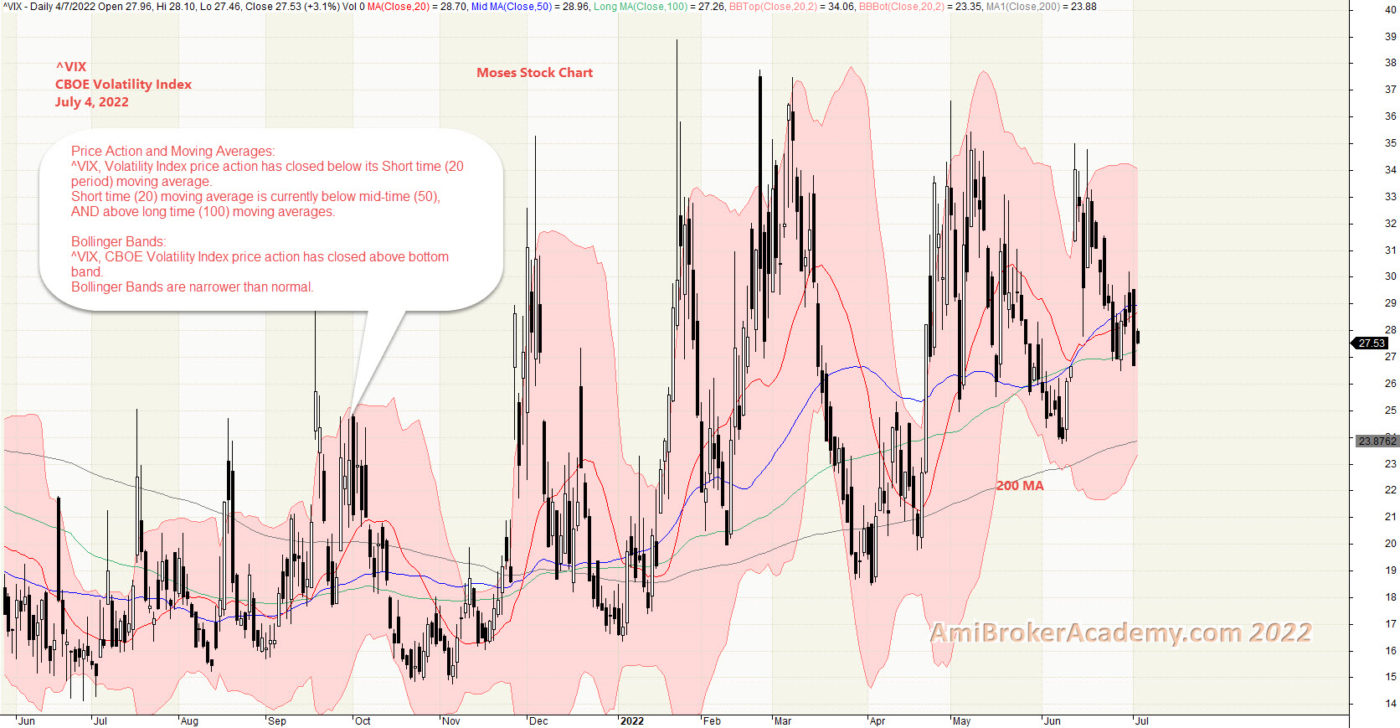
1) ^VIX Volatility Index and Bollinger Bands
Price Action reflect the market emotions, it factor in news, buy or sell emotions.
When the market is bullish, how you trade you eventually still make money. When the market is sideways. You have to ride the wave on buy the bull bias and sell when it is bear.
Moving Average is a great visual tool. MACD indicator is a easy to understand indicator. Fundamental tool such as support and resistance is important for you study the high low. Bollinger Bands is an interesting indicator. The price action is trapped with the Bollinger Bands, Bollinger Bands is like rubber band. It is either expand or narrow.
For ^VIX, the MA is slopping up. Price action is now above 25 points. Will the price action go up? Will see.
Volatility Index is an index market use to measure market fear. So, should you fear not? Will see. Don’t play play!
Manage your risk.
Think Think got more Things
In trading, some predict the up or down on the trend. Here, we look for support, strong support to buy. Or take profit when price action test the resistance.
20220704 Volatility Index and Bollinger Bands
Moses Power Charting
Official AmiBrokerAcademy.com Charting
Disclaimer
The above result is for illustration purpose. It is meant to be used for learning buy or sell signals. We do not recommend for any particular stocks. If particular stocks of such are mentioned, they are meant as a demonstration of Amibroker as a powerful charting software. Amibroker is a charting software, it can program to scan the stocks for buy and sell signals. Or backtest for any trading strategy or technique.
We post script generated signals. Not all scan results are shown here depending on selection criterial. The MACD signal should use with price action. Users must understand what MACD and price action are all about before using them. If necessary you should attend a course to learn more on Technical Analysis (TA) and Moving Average Convergence Divergence, MACD.
Once again, the website does not guarantee any results or investment return based on the information and instruction you have read here. It should be used as learning aids only and if you decide to trade real money, all trading decision should be your own.
We learn from many past and present great traders. Kudo to these master.
Remember, the opinions from the respective authors do not represent us. We read chart and try to understand what the price action suggest.
Moses Power Stock Chart.
We Believe – Buy Support or Sell Resistance.
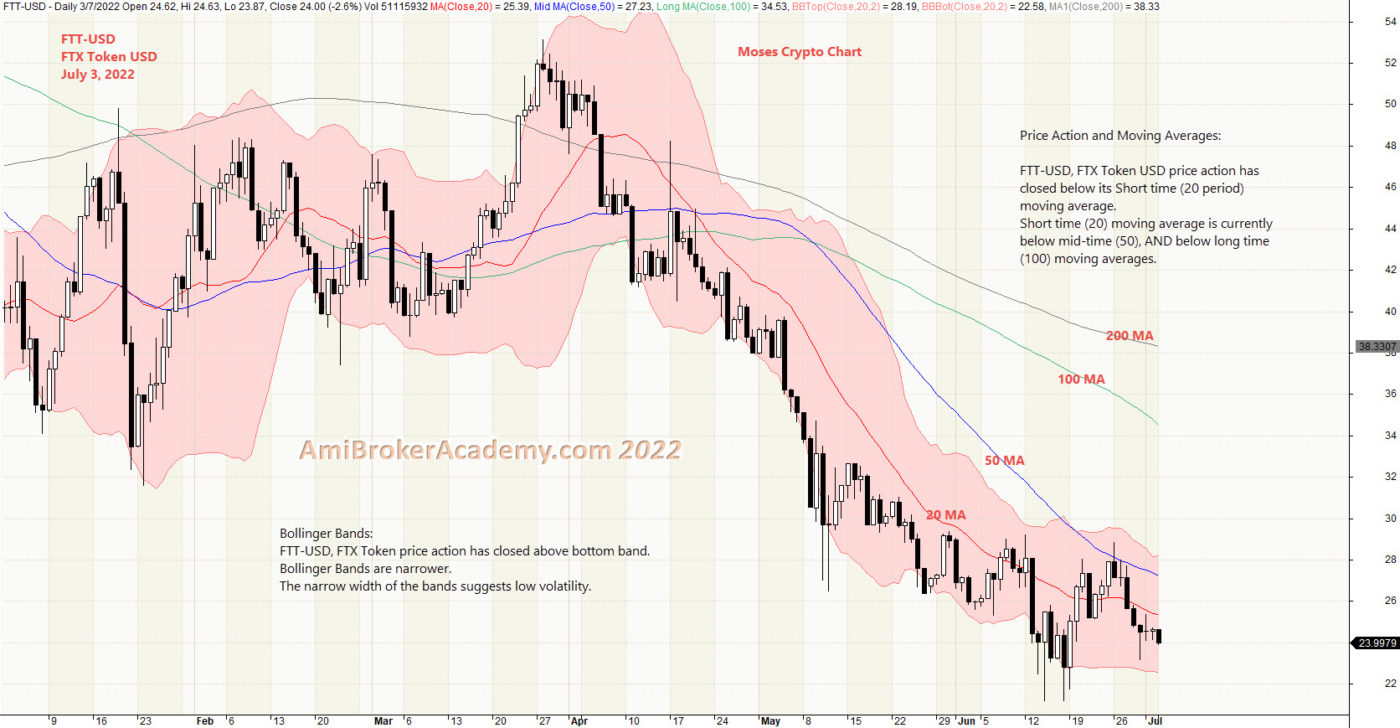
1) FTX Token Crypto and Bollinger Bands
Price Action reflect the market emotions, it factor in news, buy or sell emotions.
When the market is bullish, how you trade you eventually still make money. When the market is sideways. You have to ride the way on buy the bull bias and sell when the bear kicks in.
Moving Average is a great visual tool. MACD indicator is a easy to understand indicator. Fundamental tool such as support and resistance is important for you study the high low. Bollinger Bands is an interesting indicator. The price action is trapped with the Bollinger Bands, Bollinger Bands is like rubber band. It is either expand or narrow.
For FTX Token, the price action is now above 24 dollars. Will the price action deep below? Will see.
Manage your risk.
FTX is a Bahamian cryptocurrency exchange.
If you are a buy and hold strategist, Will you sell now or buy now? Remember only buy near support, and sell near resistance. Wait for the price action draw near either resistance or support before action.
Think Think got more Things
In trading, some predict the up or down on the trend. Here, we look for support, strong support to buy. Or take profit when price action test the resistance.
20220703 FTX Token Crypto and Bollinger Bands
Moses Power Charting
Official AmiBrokerAcademy.com Charting
Disclaimer
The above result is for illustration purpose. It is meant to be used for learning buy or sell signals. We do not recommend for any particular stocks. If particular stocks of such are mentioned, they are meant as a demonstration of Amibroker as a powerful charting software. Amibroker is a charting software, it can program to scan the stocks for buy and sell signals. Or backtest for any trading strategy or technique.
We post script generated signals. Not all scan results are shown here depending on selection criterial. The MACD signal should use with price action. Users must understand what MACD and price action are all about before using them. If necessary you should attend a course to learn more on Technical Analysis (TA) and Moving Average Convergence Divergence, MACD.
Once again, the website does not guarantee any results or investment return based on the information and instruction you have read here. It should be used as learning aids only and if you decide to trade real money, all trading decision should be your own.
We learn from many past and present great traders. Kudo to these master.
Remember, the opinions from the respective authors do not represent us. We read chart and try to understand what the price action suggest.
Moses Power Stock Chart.
We Believe – Buy Support or Sell Resistance.
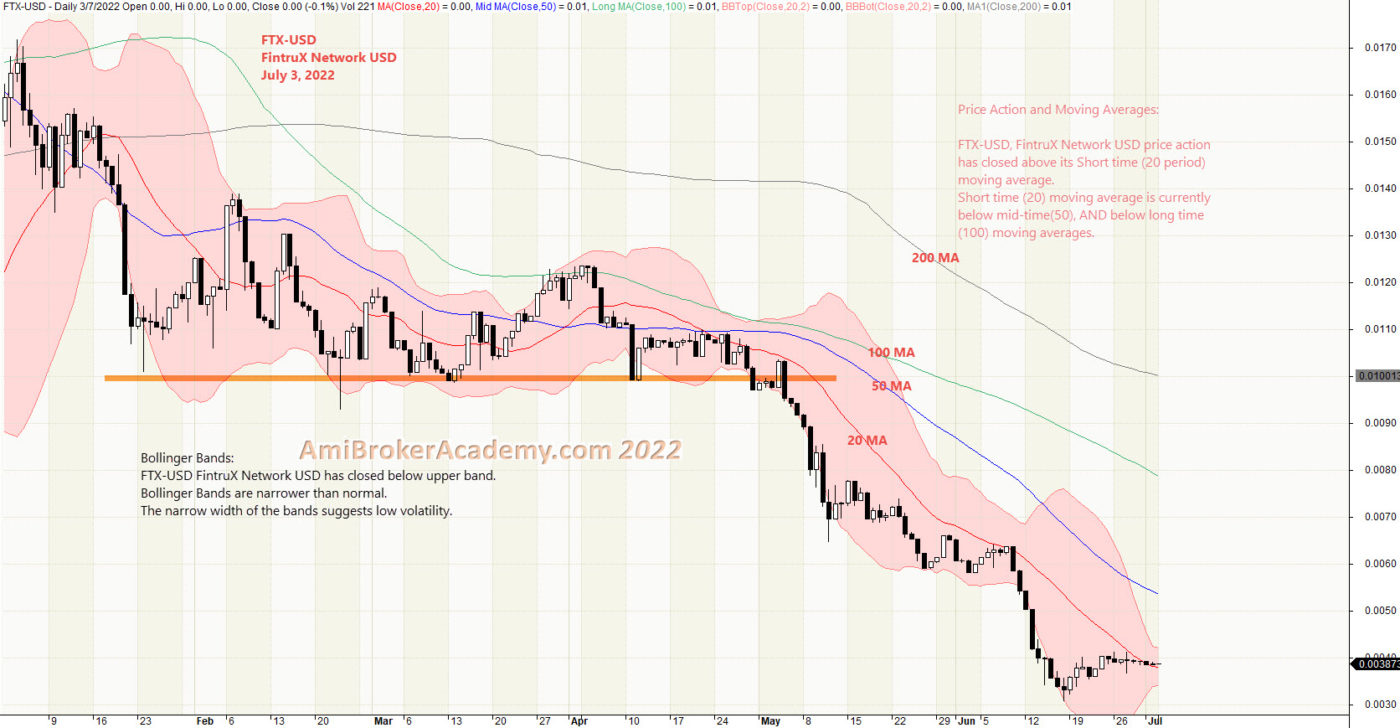
1) FintruX Network USD and Bollinger Bands
Price Action reflect the market emotions, it factor in news, buy or sell emotions.
When the market is bullish, how you trade you eventually still make money. When the market is sideways. You have to ride the way on buy the bull bias and sell when the bear kicks in.
Moving Average is a great visual tool. MACD indicator is a easy to understand indicator. Fundamental tool such as support and resistance is important for you study the high low. Bollinger Bands is an interesting indicator. The price action is trapped with the Bollinger Bands, Bollinger Bands is like rubber band. It is either expand or narrow.
For FintruX Network, the price action after the peak at 40 cents in 2018. It has never return the high again. Study the recent price action using bollinger bands, see chart.
Manage your risk.
If you are a buy and hold strategist, Will you sell now or buy now? Remember only buy near support, and sell near resistance. Wait for the price action draw near either resistance or support before action.
Think Think got more Things
In trading, some predict the up or down on the trend. Here, we look for support, strong support to buy. Or take profit when price action test the resistance.
20220703 FintruX Network USD and Bollinger Bands
Moses Power Charting
Official AmiBrokerAcademy.com Charting
Disclaimer
The above result is for illustration purpose. It is meant to be used for learning buy or sell signals. We do not recommend for any particular stocks. If particular stocks of such are mentioned, they are meant as a demonstration of Amibroker as a powerful charting software. Amibroker is a charting software, it can program to scan the stocks for buy and sell signals. Or backtest for any trading strategy or technique.
We post script generated signals. Not all scan results are shown here depending on selection criterial. The MACD signal should use with price action. Users must understand what MACD and price action are all about before using them. If necessary you should attend a course to learn more on Technical Analysis (TA) and Moving Average Convergence Divergence, MACD.
Once again, the website does not guarantee any results or investment return based on the information and instruction you have read here. It should be used as learning aids only and if you decide to trade real money, all trading decision should be your own.
We learn from many past and present great traders. Kudo to these master.
Remember, the opinions from the respective authors do not represent us at AmiBrokerAcademy.com. We read chart and try to understand what the price action suggest.
Moses Power Stock Chart.
We Believe – Buy Support or Sell Resistance.
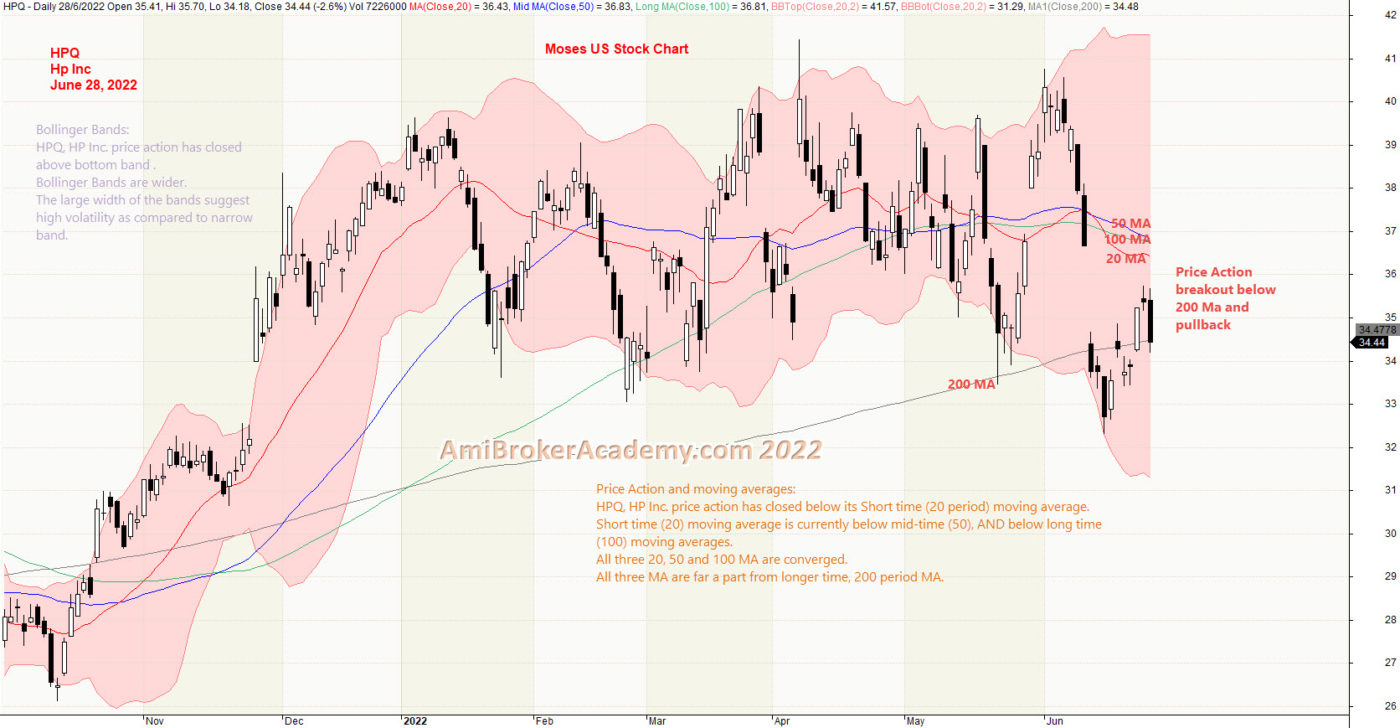
1) HP Inc and Bollinger Bands
Price Action reflect the market emotions, it factor in news, buy or sell emotions.
When the market is bullish, how you trade you also make money. When the market is sideways or bearish. How do you stay out of lost.
Moving Average is a great visual tool. MACD indicator is a easy to understand indicator. Bollinger is also a great tool to understand the market volatility. Of course support resistance are the most fundamental tool.
PC leader HP has been on the sideways since the start of the year. But now the price action is deeper.
Manage your risk, until the price action find a good support, bouncing up seem still not yet.
If you are a buy and hold strategist, Will you sell now or buy now? Remember only buy near support, and sell near resistance. Wait for the price action draw near either resistance or support before action.
Think Think got more Things
In trading, some predict the up or down on the trend. Here, we look for support, strong support to buy. Or take profit when price action test the resistance.
20220628 HP Inc and Bollinger Bands
Moses Power Charting
Official AmiBrokerAcademy.com Charting
Disclaimer
The above result is for illustration purpose. It is meant to be used for learning buy or sell signals. We do not recommend for any particular stocks. If particular stocks of such are mentioned, they are meant as a demonstration of Amibroker as a powerful charting software. Amibroker is a charting software, it can program to scan the stocks for buy and sell signals. Or backtest for any trading strategy or technique.
We post script generated signals. Not all scan results are shown here depending on selection criterial. The MACD signal should use with price action. Users must understand what MACD and price action are all about before using them. If necessary you should attend a course to learn more on Technical Analysis (TA) and Moving Average Convergence Divergence, MACD.
Once again, the website does not guarantee any results or investment return based on the information and instruction you have read here. It should be used as learning aids only and if you decide to trade real money, all trading decision should be your own.
We learn from many past and present great traders. Kudo to these master.
Remember, the opinions from the respective authors do not represent us. We read chart and try to understand what the price action suggest.
Moses Power Stock Chart.
We Believe – Buy Support or Sell Resistance.
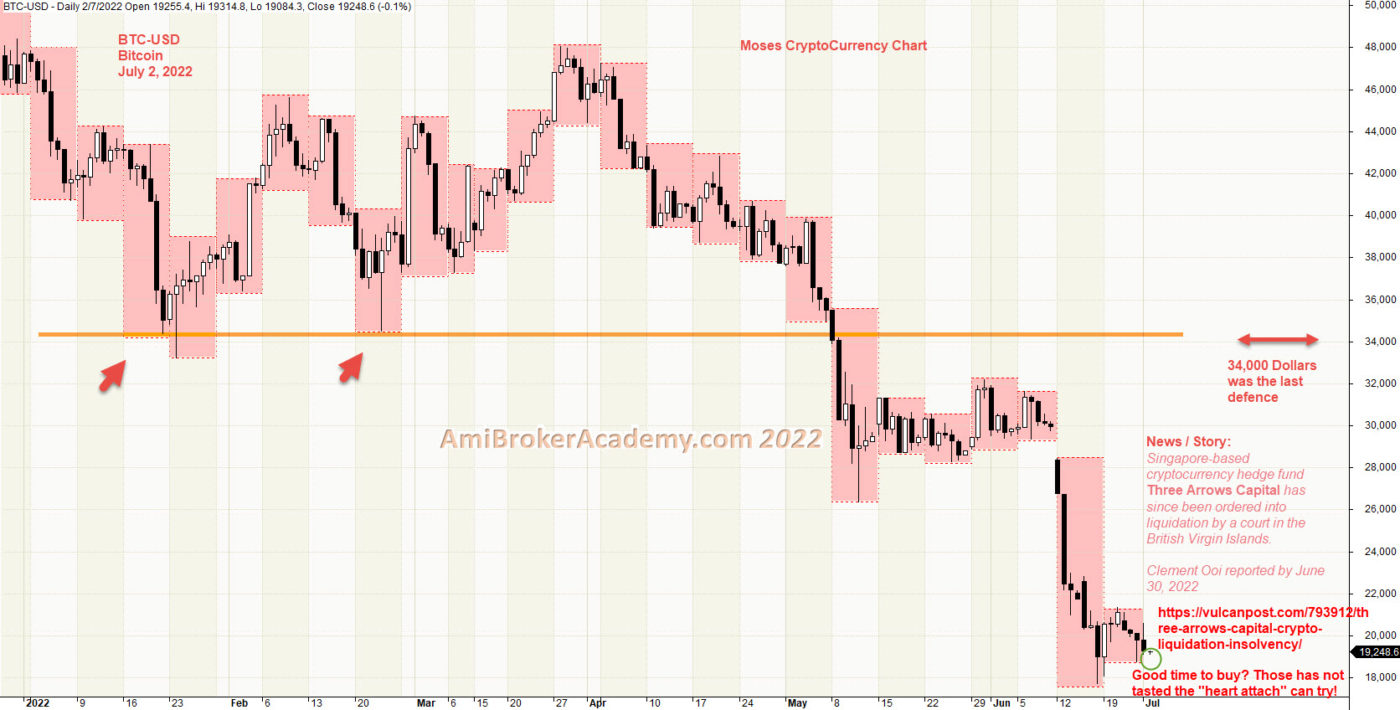
1) Bitcoin CryptoCurrency and Weekly High Low
Price Action reflect the market emotions, it factor in news, buy or sell emotions.
When the market is bullish, how you trade you also make money. When the market is sideways or bearish. You need a lot of strategy and critical thinking to stay ahead of market. Bull market has made many rich man.
Moving Average is a great visual tool. MACD indicator is a easy to understand indicator. But there are fundamental tool such as support and resistance. When you study the high low, or weekly or monthly high low will give you a lot of insight. For your case here, we study the week high low, study seven months weekly high low.
For Bitcoin, from the week high low, we spot a strong level, see chart. Now price action has broken down below the strong level in May. Now the price action stay below the strong level. Is it a good to buy? Will see.
Manage your risk, the price action attempt to return to high in June but fail. Now the price action has gone lower.
If you are a buy and hold strategist, Will you sell now or buy now? Remember only buy near support, and sell near resistance. Wait for the price action draw near either resistance or support before action.
Think Think got more Things
In trading, some predict the up or down on the trend. Here, we look for support, strong support to buy. Or take profit when price action test the resistance.
20220702 Bitcoin CryptoCurrency and Weekly High Low
Moses Power Charting
Official AmiBrokerAcademy.com Charting
Disclaimer
The above result is for illustration purpose. It is meant to be used for learning buy or sell signals. We do not recommend for any particular stocks. If particular stocks of such are mentioned, they are meant as a demonstration of Amibroker as a powerful charting software. Amibroker is a charting software, it can program to scan the stocks for buy and sell signals. Or backtest for any trading strategy or technique.
We post script generated signals. Not all scan results are shown here depending on selection criterial. The MACD signal should use with price action. Users must understand what MACD and price action are all about before using them. If necessary you should attend a course to learn more on Technical Analysis (TA) and Moving Average Convergence Divergence, MACD.
Once again, the website does not guarantee any results or investment return based on the information and instruction you have read here. It should be used as learning aids only and if you decide to trade real money, all trading decision should be your own.
We learn from many past and present great traders. Kudo to these master.
Remember, the opinions from the respective authors do not represent us. Be aware.
Moses Power Stock Chart.
We Believe – Buy Support or Sell Resistance.
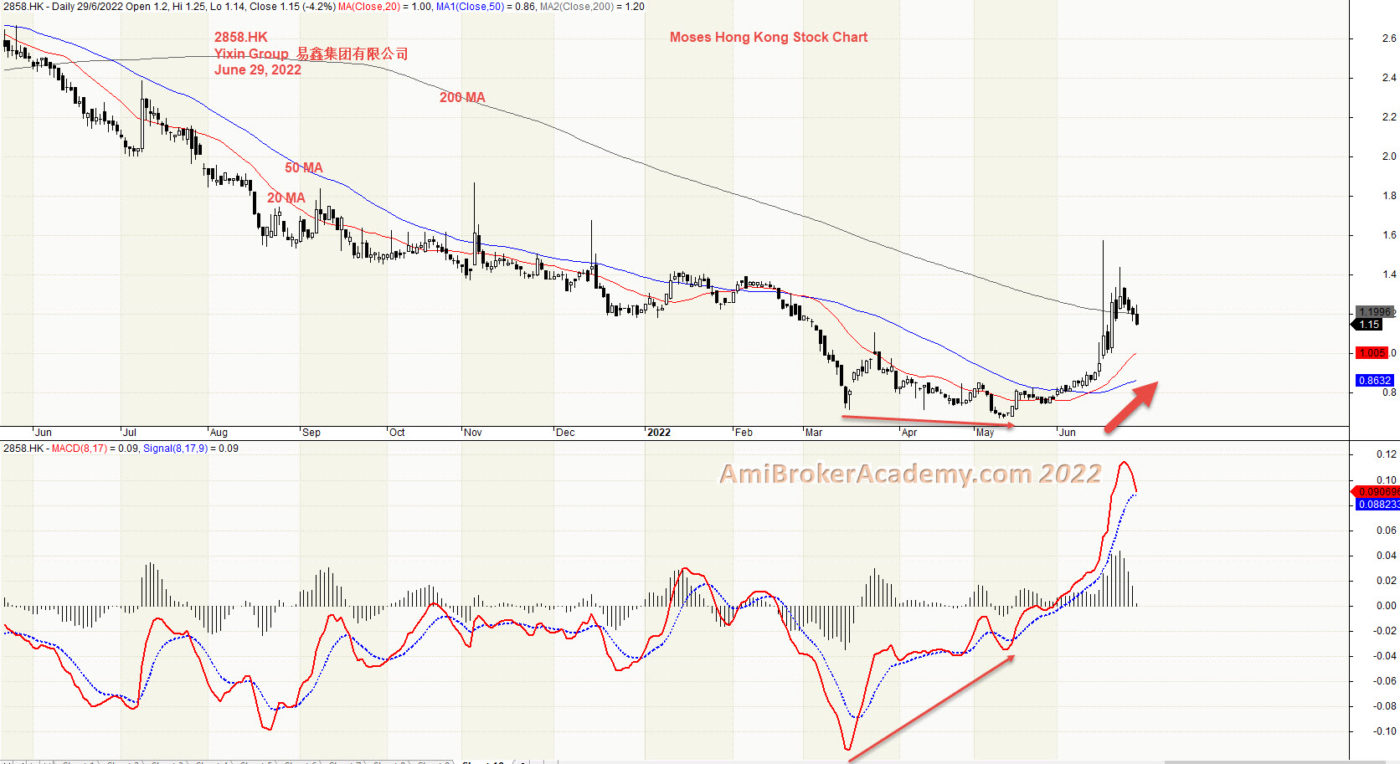
1) Yixin Group 易鑫集团 and MACD
Price Action reflect the market emotions, it factor in news, buy or sell emotions.
Moving Average is a great visual tool. MACD indicator is a common and easy to understand indicator. For example MACD Divergence, it is like a traffic light, a possible change in direction. Traffic light is there for you to understand there is a possible change in traffic direction. But, you do not stop at every traffic light. Right? So, does MACD Divergence.
For Yixin Group 易鑫集团 stock case, the price action follows the MACD Divergence. Price Action begin to pullback.
If you are a buy and hold strategist, Will you sell now or buy now? Remember only buy near support, and sell near resistance. Wait for the price action draw near either resistance or support before action.
Think Think got more Things
In trading, some predict the up or down on the trend. Here, we look for support, strong support to buy. Or take profit when price action test the resistance.
20220629 Yixin Group 易鑫集团 and MACD
Moses Power Charting
Official AmiBrokerAcademy.com Charting
Disclaimer
The above result is for illustration purpose. It is meant to be used for learning buy or sell signals. We do not recommend for any particular stocks. If particular stocks of such are mentioned, they are meant as a demonstration of Amibroker as a powerful charting software. Amibroker is a charting software, it can program to scan the stocks for buy and sell signals. Or backtest for any trading strategy or technique.
We post script generated signals. Not all scan results are shown here depending on selection criterial. The MACD signal should use with price action. Users must understand what MACD and price action are all about before using them. If necessary you should attend a course to learn more on Technical Analysis (TA) and Moving Average Convergence Divergence, MACD.
Once again, the website does not guarantee any results or investment return based on the information and instruction you have read here. It should be used as learning aids only and if you decide to trade real money, all trading decision should be your own.
We learn from many past and present great traders. Kudo to these master.
Remember, the opinions from the respective authors do not represent us. Be aware.
Moses Power Stock Chart.
We Believe – Buy Support or Sell Resistance.
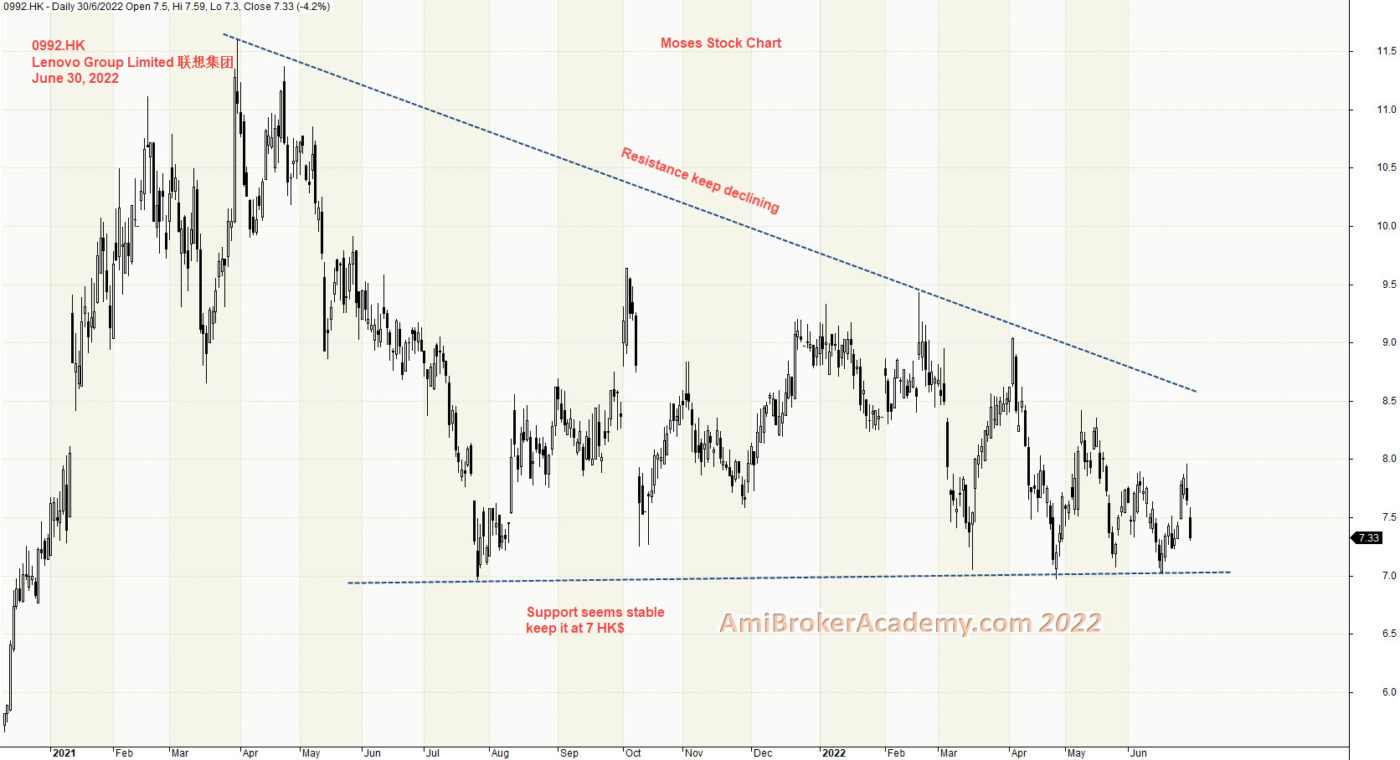
1) Lenovo Group Limited 联想集团 and Price Action
Price Action reflect the market emotions, it factor in news, buy or sell emotions.
Moving Average is a great visual tool. But trendline is the most fundamental. When we connect the high to draw a trendline, or connect the low to draw a trendline.
From the trendline connect the high, we see the trendline is slopping down. Bearish. When the trendline slopping down also means the price action is forming lower high.
When the price action connecting the low, the trendline can be a support. See chart, the support continue to maintain at 7 HK$.
If you are a buy and hold strategist, Will you sell now or buy now? Remember only buy near support, and sell near resistance. Wait for the price action draw near either resistance or support before action.
Think Think got more Things
In trading, some predict the up or down on the trend. Here, we look for support, strong support to buy. Or take profit when price action test the resistance.
20220630 Lenovo Group Limited 联想集团 and Price Action
Moses Power Charting
Official AmiBrokerAcademy.com Charting
Disclaimer
The above result is for illustration purpose. It is meant to be used for learning buy or sell signals. We do not recommend for any particular stocks. If particular stocks of such are mentioned, they are meant as a demonstration of Amibroker as a powerful charting software. Amibroker is a charting software, it can program to scan the stocks for buy and sell signals. Or backtest for any trading strategy or technique.
We post script generated signals. Not all scan results are shown here depending on selection criterial. The MACD signal should use with price action. Users must understand what MACD and price action are all about before using them. If necessary you should attend a course to learn more on Technical Analysis (TA) and Moving Average Convergence Divergence, MACD.
Once again, the website does not guarantee any results or investment return based on the information and instruction you have read here. It should be used as learning aids only and if you decide to trade real money, all trading decision should be your own.
We learn from many past and present great traders. Kudo to these master.
Remember, the opinions from the respective authors do not represent us. Be aware.
Moses Power Stock Chart.
We Believe – Buy Support or Sell Resistance.
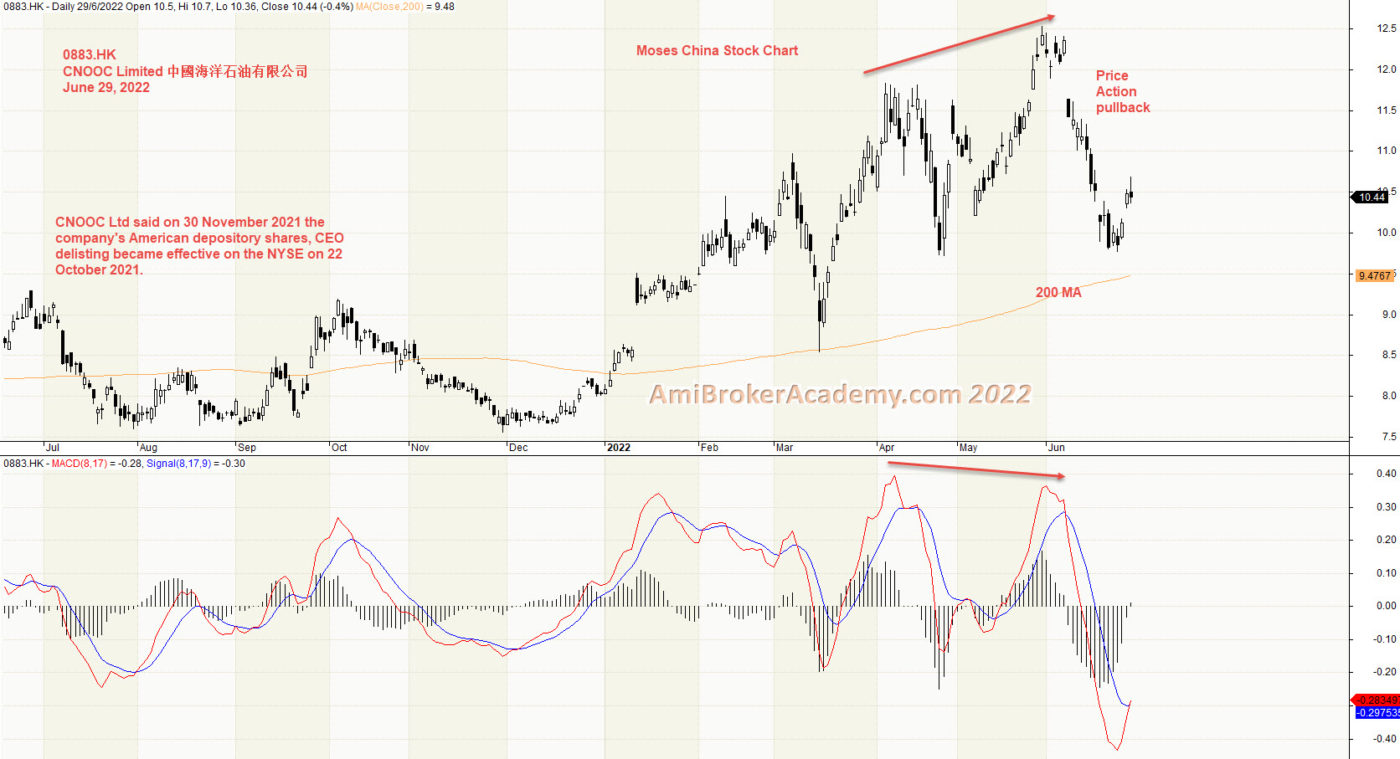
1) CNOOC Limited 中國海洋石油 and MACD
Price Action reflect the market emotions, it factor in news, buy or sell emotions.
Moving Average is a great tool. MACD indicator is a easy to use indicator. From the MACD Divergence, signal there is a possibility in price action changing direction. But, do remember, traffic light is to signal a stop for change in traffic flow. Do you stop at each traffic light? No, you don’t. So be it for the MACD Divergence. Trade what you see.
There is a pullback after the Divergence. See chart. Resistance turns support.
If you are a buy and hold strategist, Will you sell now or buy now? Remember only buy near support, and sell near resistance. Wait for the price action draw near either resistance or support before action.
Think Think got more Things
In trading, some predict the up or down on the trend. Here, we look for support, strong support to buy. Or take profit when price action test the resistance.
20220629 CNOOC Limited 中國海洋石油 and MACD
Moses Power Charting
Official AmiBrokerAcademy.com Charting
Disclaimer
The above result is for illustration purpose. It is meant to be used for learning buy or sell signals. We do not recommend for any particular stocks. If particular stocks of such are mentioned, they are meant as a demonstration of Amibroker as a powerful charting software. Amibroker is a charting software, it can program to scan the stocks for buy and sell signals. Or backtest for any trading strategy or technique.
We post script generated signals. Not all scan results are shown here depending on selection criterial. The MACD signal should use with price action. Users must understand what MACD and price action are all about before using them. If necessary you should attend a course to learn more on Technical Analysis (TA) and Moving Average Convergence Divergence, MACD.
Once again, the website does not guarantee any results or investment return based on the information and instruction you have read here. It should be used as learning aids only and if you decide to trade real money, all trading decision should be your own.
We learn from many past and present great traders. Kudo to these master.
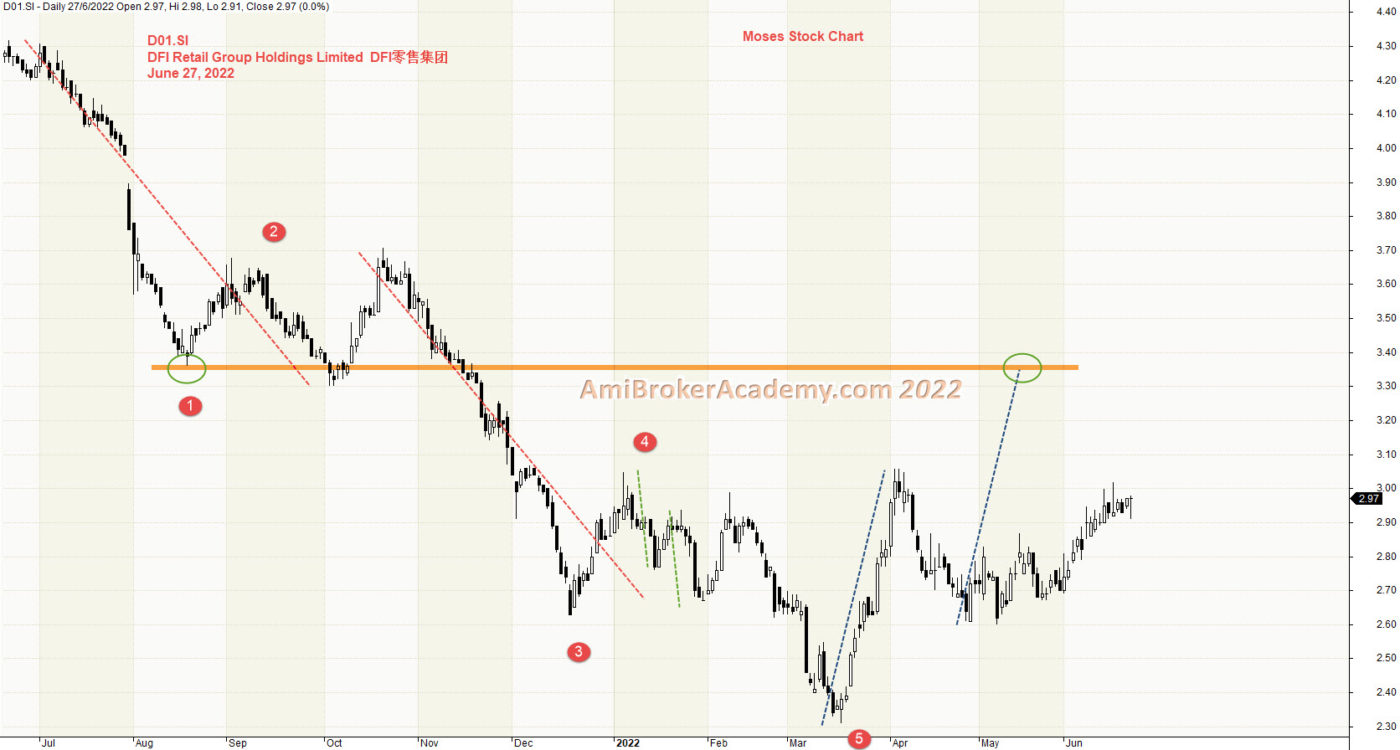
1) DFI Retail Group Holdings Limited DFI零售集团 and Price Action
Price Action reflect the market emotions, it factor in news, buy or sell emotions.
Besides Moving Average is a great tool. Another easy to follow tool is Gartley 222 Wave Pattern, Gartley true observation, find that the price action is moving in zigzag and not straight line. Especially when price action near the top or bottom, the wave may be AB=CD. See chart for the ABCD pattern.
If you are a buy and hold strategist, Will you sell now or buy now? Remember only buy near support, and sell near resistance. Wait for the price action draw near either resistance or support before action.
Think Think got more Things
In trading, some predict the up or down on the trend. Here, we look for support, strong support to buy. Or take profit when price action test the resistance.
20220627 DFI Retail Group Holdings Limited DFI零售集团 and Price Action
Moses Power Charting
Official AmiBrokerAcademy.com Charting
Disclaimer
The above result is for illustration purpose. It is meant to be used for learning buy or sell signals. We do not recommend for any particular stocks. If particular stocks of such are mentioned, they are meant as a demonstration of Amibroker as a powerful charting software. Amibroker is a charting software, it can program to scan the stocks for buy and sell signals. Or backtest for any trading strategy or technique.
We post script generated signals. Not all scan results are shown here depending on selection criterial. The MACD signal should use with price action. Users must understand what MACD and price action are all about before using them. If necessary you should attend a course to learn more on Technical Analysis (TA) and Moving Average Convergence Divergence, MACD.
Once again, the website does not guarantee any results or investment return based on the information and instruction you have read here. It should be used as learning aids only and if you decide to trade real money, all trading decision should be your own.
We learn from many past and present great traders. Kudo to these master.
1) DFI Retail Group Holdings Limited DFI零售集团 and MACD
Price Action reflect the market emotions, it factor in news, buy or sell emotions.
Moving Average is a great visual aid. And MACD is a great and easy to understand indicator. When MACD Divergence happen, there is a possibility that the price action may change from original direction. So, a pullback is always possible. But, remember, you don’t stop at every traffic light.
If you are a buy and hold strategist, Will you sell now or buy now? Remember only buy near support, and sell near resistance. Wait for the price action draw near either resistance or support before action.
Think Think got more Things
In trading, some predict the up or down on the trend. Here, we look for support, strong support to buy. Or take profit when price action test the resistance.
20220627 DFI Retail Group Holdings Limited DFI零售集团 and MACD
Moses Power Charting
Official AmiBrokerAcademy.com Charting
Disclaimer
The above result is for illustration purpose. It is meant to be used for learning buy or sell signals. We do not recommend for any particular stocks. If particular stocks of such are mentioned, they are meant as a demonstration of Amibroker as a powerful charting software. Amibroker is a charting software, it can program to scan the stocks for buy and sell signals. Or backtest for any trading strategy or technique.
We post script generated signals. Not all scan results are shown here depending on selection criterial. The MACD signal should use with price action. Users must understand what MACD and price action are all about before using them. If necessary you should attend a course to learn more on Technical Analysis (TA) and Moving Average Convergence Divergence, MACD.
Once again, the website does not guarantee any results or investment return based on the information and instruction you have read here. It should be used as learning aids only and if you decide to trade real money, all trading decision should be your own.
We learn from many past and present great traders. Kudo to these master.
The S&P 500 is in a bear market after falling 20% from its January peak and its worst first half since 1970.
Price Action reflect the market emotions, it factor in news, buy or sell emotions.
Moving Average is a great visual aid. And MACD is a great and easy to understand indicator. When MACD Divergence happen, there is a possibility that the price action may change from original direction. So, a pullback is always possible. But, remember, you don’t stop at every traffic light. But for E5H, the pullback did happen. And May the the fall may not stop yet. Will see.
If the pullback following the ABCD pattern. the CD leg still have some space to move. Manage your risk.
If you are a buy and hold strategist, Will you sell now or buy now? Remember only buy near support, and sell near resistance. Wait for the price action draw near either resistance or support before action.
Think Think got more Things
In trading, some predict the up or down on the trend. Here, we look for support, strong support to buy. Or take profit when price action test the resistance.
20220627 Golden Agri Resources 20220627 Golden 金光农业资源 and MACD
Moses Power Charting
Official AmiBrokerAcademy.com Charting
Disclaimer
The above result is for illustration purpose. It is meant to be used for learning buy or sell signals. We do not recommend for any particular stocks. If particular stocks of such are mentioned, they are meant as a demonstration of Amibroker as a powerful charting software. Amibroker is a charting software, it can program to scan the stocks for buy and sell signals. Or backtest for any trading strategy or technique.
We post script generated signals. Not all scan results are shown here depending on selection criterial. The MACD signal should use with price action. Users must understand what MACD and price action are all about before using them. If necessary you should attend a course to learn more on Technical Analysis (TA) and Moving Average Convergence Divergence, MACD.
Once again, the website does not guarantee any results or investment return based on the information and instruction you have read here. It should be used as learning aids only and if you decide to trade real money, all trading decision should be your own.
We learn from many past and present great traders. Kudo to these master.
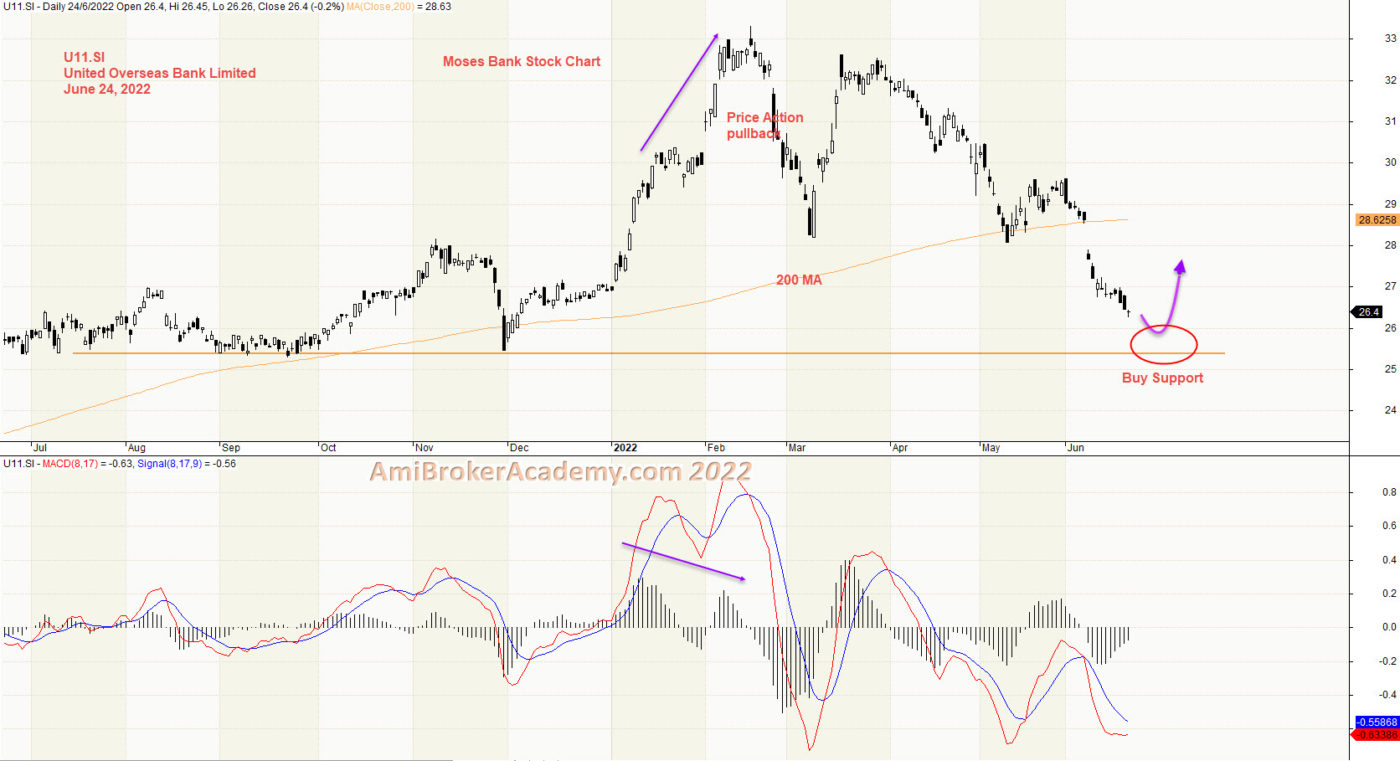
The S&P 500 is in a bear market after falling 20% from its January peak and is on course for its worst first half since 1970.
Price Action reflect the market emotions, it factor in news, buy or sell emotions.
Moving Average is a great visual aid. And MACD is a great and easy to understand indicator. When MACD Divergence happen, there is a possibility that the price action may change from original direction. So, a pullback is always possible. But, remember, you don’t stop at every traffic light. Therefore, the pullback may not really happen.
Now the price action is dropped to near 25 dollars after its peak this year above 33 dollars.
If you are a buy and hold strategist, Will you sell now or buy now? Remember only buy near support, and sell near resistance. Wait for the price action draw near either resistance or support before action.
Think Think got more Things
In trading, some predict the up or down on the trend. Here, we look for support, strong support to buy. Or take profit when price action test the resistance.
20220624 United Overseas Bank and MACD Divergence
Moses Power Charting
Official AmiBrokerAcademy.com Charting
Disclaimer
The above result is for illustration purpose. It is meant to be used for learning buy or sell signals. We do not recommend for any particular stocks. If particular stocks of such are mentioned, they are meant as a demonstration of Amibroker as a powerful charting software. Amibroker is a charting software, it can program to scan the stocks for buy and sell signals. Or backtest for any trading strategy or technique.
We post script generated signals. Not all scan results are shown here depending on selection criterial. The MACD signal should use with price action. Users must understand what MACD and price action are all about before using them. If necessary you should attend a course to learn more on Technical Analysis (TA) and Moving Average Convergence Divergence, MACD.
Once again, the website does not guarantee any results or investment return based on the information and instruction you have read here. It should be used as learning aids only and if you decide to trade real money, all trading decision should be your own.
We learn from many past and present great traders. Kudo to these master.
The S&P 500 is in a bear market after falling 20% from its January peak and is on course for its worst first half since 1970.
Price Action reflect the market emotions, it factor in news, buy or sell emotions.
Moving Average is a great visual aid. And MACD is a great and easy to understand indicator. When MACD Divergence happen, there is a possibility that the price action may change from original direction. So, a pullback is always possible. But, remember, you don’t stop at every traffic light. Therefore, the pullback may not really happen.
Now the price pullback and resisted by the lower trendline. Can the price action continue to go higher to the upper trendline. Will see. 4200 will be a major level to watch. Can the price action breakout higher than 4200 level, will see!
If you are a buy and hold strategist, Will you sell now or buy now? Remember only buy near support, and sell near resistance. Wait for the price action draw near either resistance or support before action.
Think Think got more Things
In trading, some predict the up or down on the trend. Here, we look for support, strong support to buy. Or take profit when price action test the resistance.
20220624 S&P 500 Index and MACD
Moses Power Charting
Official AmiBrokerAcademy.com Charting
Disclaimer
The above result is for illustration purpose. It is meant to be used for learning buy or sell signals. We do not recommend for any particular stocks. If particular stocks of such are mentioned, they are meant as a demonstration of Amibroker as a powerful charting software. Amibroker is a charting software, it can program to scan the stocks for buy and sell signals. Or backtest for any trading strategy or technique.
We post script generated signals. Not all scan results are shown here depending on selection criterial. The MACD signal should use with price action. Users must understand what MACD and price action are all about before using them. If necessary you should attend a course to learn more on Technical Analysis (TA) and Moving Average Convergence Divergence, MACD.
Once again, the website does not guarantee any results or investment return based on the information and instruction you have read here. It should be used as learning aids only and if you decide to trade real money, all trading decision should be your own.
We learn from many past and present great traders. Kudo to these master.
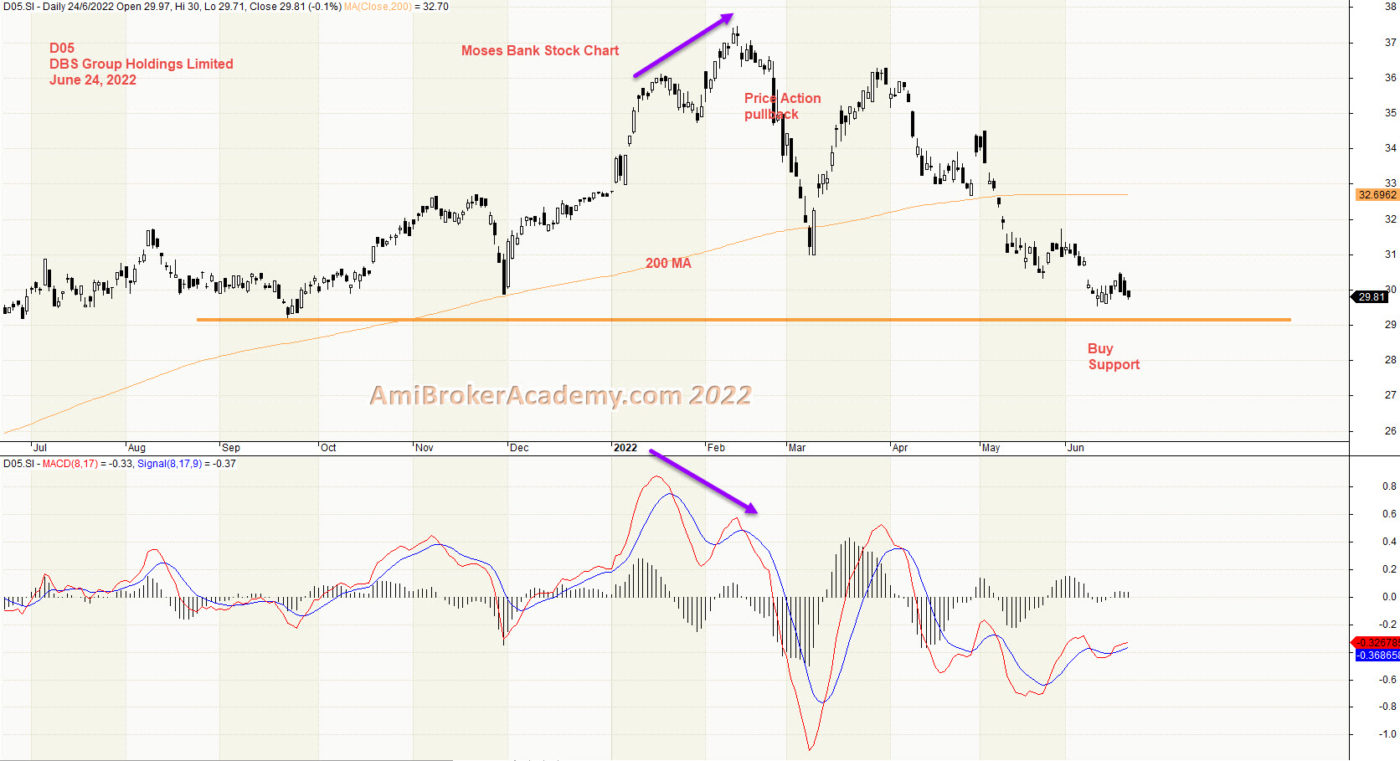
The S&P 500 is in a bear market after falling 20% from its January peak and is on course for its worst first half since 1970.
Price Action reflect the market emotions, it factor in news, buy or sell emotions.
Moving Average is a great visual aid. And MACD is a great and easy to understand indicator. When MACD Divergence happen, there is a possibility that the price action may change from original direction. So, a pullback is always possible. But, remember, you don’t stop at every traffic light. Therefore, the pullback may not really happen.
Now the price action has touch 30 dollars after its peak this year above 37 dollars.
If you are a buy and hold strategist, Will you sell now or buy now? Remember only buy near support, and sell near resistance. Wait for the price action draw near either resistance or support before action.
Think Think got more Things
In trading, some predict the up or down on the trend. Here, we look for support, strong support to buy. Or take profit when price action test the resistance.
20220624 DBS Group Holdings and MACD.jpg
Moses Power Charting
Official AmiBrokerAcademy.com Charting
Disclaimer
The above result is for illustration purpose. It is meant to be used for learning buy or sell signals. We do not recommend for any particular stocks. If particular stocks of such are mentioned, they are meant as a demonstration of Amibroker as a powerful charting software. Amibroker is a charting software, it can program to scan the stocks for buy and sell signals. Or backtest for any trading strategy or technique.
We post script generated signals. Not all scan results are shown here depending on selection criterial. The MACD signal should use with price action. Users must understand what MACD and price action are all about before using them. If necessary you should attend a course to learn more on Technical Analysis (TA) and Moving Average Convergence Divergence, MACD.
Once again, the website does not guarantee any results or investment return based on the information and instruction you have read here. It should be used as learning aids only and if you decide to trade real money, all trading decision should be your own.
We learn from many past and present great traders. Kudo to these master.
Welcome to AmiBroker Academy dot com, amibrokeracademy.com.
If There is Only One Chart This is It
Moses Power Stock Chart.
We Believe – Buy Support or Sell Resistance.
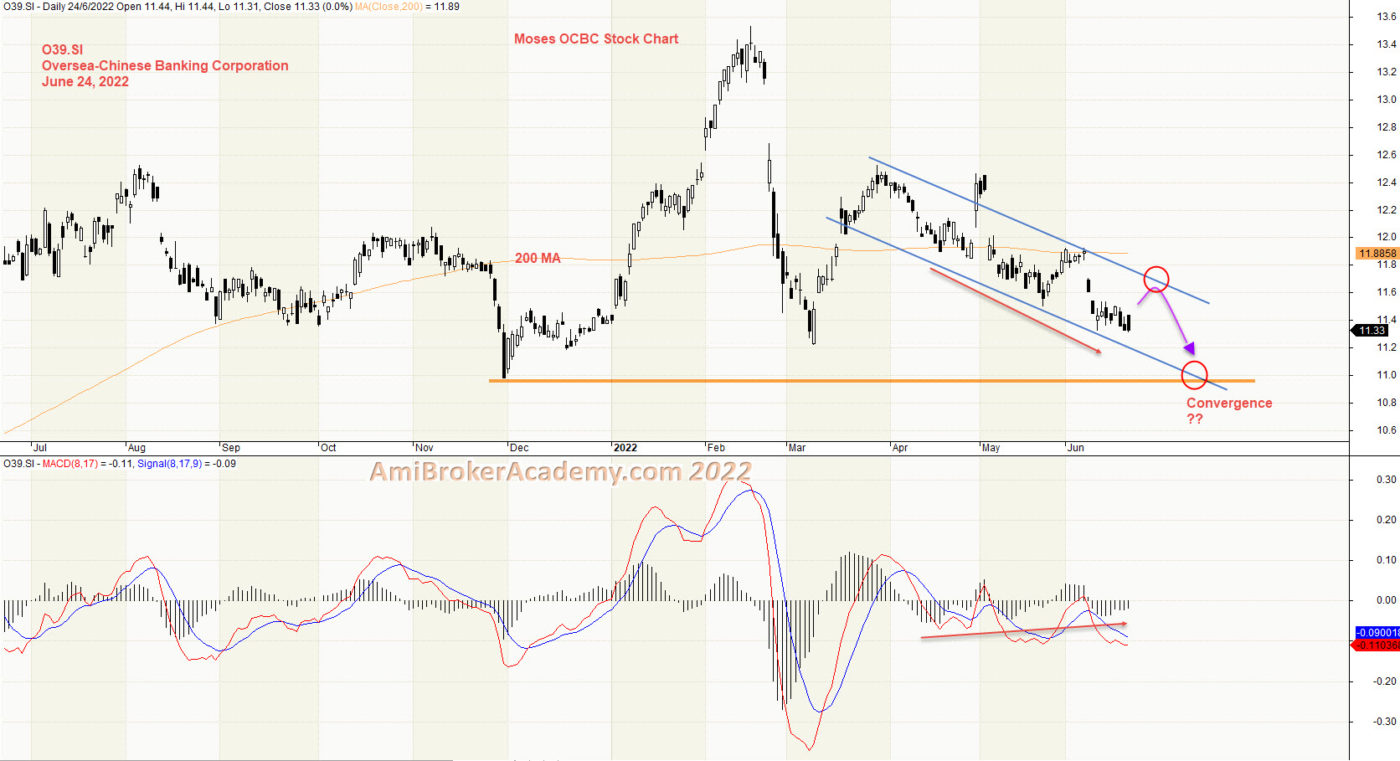
1) Oversea-Chinese Banking Corporation and MACD
Will the price return to last December low? Will See. If you are not in a hurry to buy, please wait.
Price Action reflect the market emotions, it factor in news, buy or sell emotions.
Connect the high and draw a trendline, copy and paste the trendline to the low of price action, this forms the equal distance channel. Price Action is bounce within the two trendlines, within the EDC.
So, price action is resisted by the upper trendline, or supported by the lower trendline. Buy when price action is near the lower trendline, or sell when the price action is near the upper trendline. But, whatever it is, wait for the clear confirmation before taking any action.
From the Channel, we can see the price action is continued to be lower. Bear trend.
If you are a buy and hold strategist, Will you sell now or buy now? Remember only buy near support, and sell near resistance. Wait for the price action draw near either resistance or support before action.
Think Think got more Things
In trading, some predict the up or down on the trend. Here, we look for support, strong support to buy. Or take profit when price action test the resistance.
20220624 Oversea-Chinese Banking Corporation and MACD
Moses Power Charting
Official AmiBrokerAcademy.com Charting
Disclaimer
The above result is for illustration purpose. It is meant to be used for learning buy or sell signals. We do not recommend for any particular stocks. If particular stocks of such are mentioned, they are meant as a demonstration of Amibroker as a powerful charting software. Amibroker is a charting software, it can program to scan the stocks for buy and sell signals. Or backtest for any trading strategy or technique.
We post script generated signals. Not all scan results are shown here depending on selection criterial. The MACD signal should use with price action. Users must understand what MACD and price action are all about before using them. If necessary you should attend a course to learn more on Technical Analysis (TA) and Moving Average Convergence Divergence, MACD.
Once again, the website does not guarantee any results or investment return based on the information and instruction you have read here. It should be used as learning aids only and if you decide to trade real money, all trading decision should be your own.
We learn from many past and present great traders. Kudo to these master.
Welcome to AmiBroker Academy dot com, amibrokeracademy.com.
If There is Only One Chart This is It
Moses Power Stock Chart.
We Believe – Buy Support or Sell Resistance.
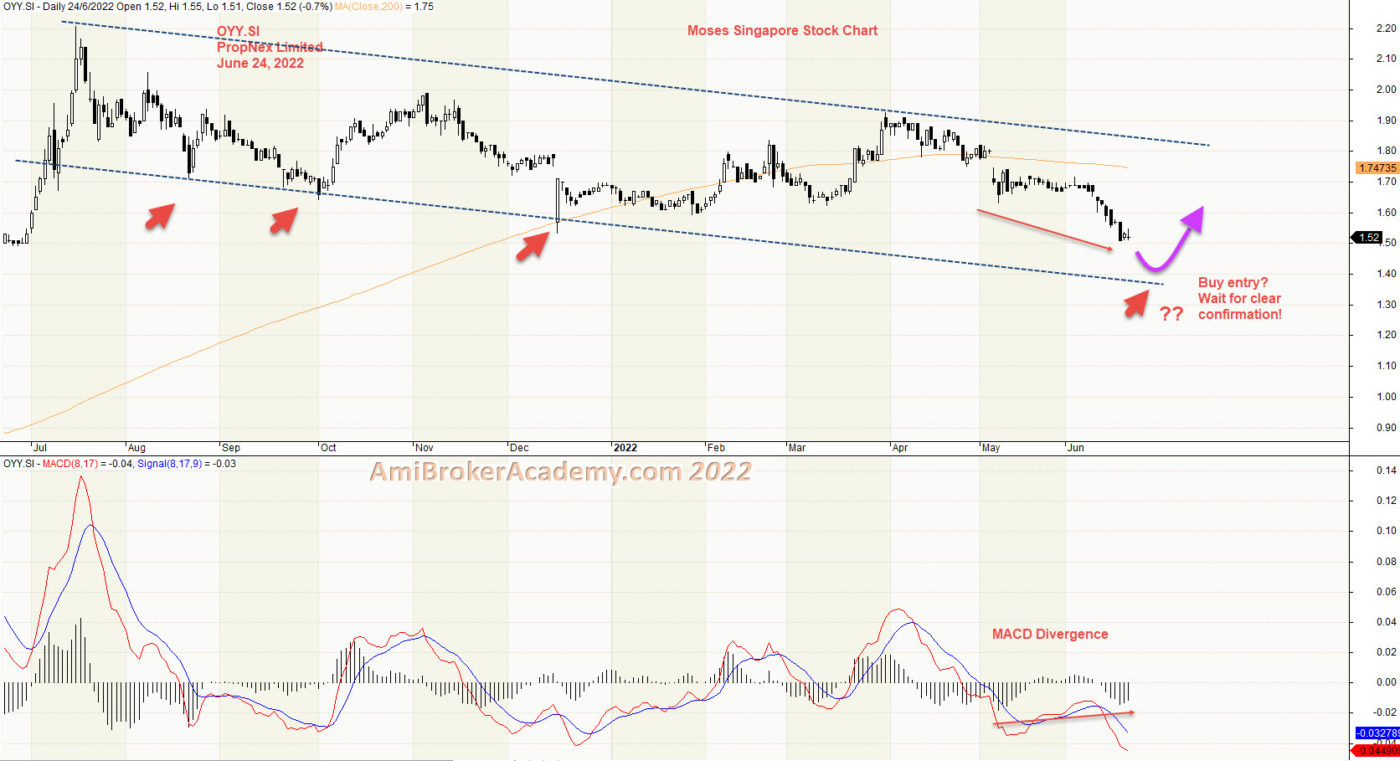
1) PropNex Limited and MACD Divergence
Price Action reflect the market emotions, it factor in news, buy or sell emotions.
Connect the high and draw a trendline, copy and paste the trendline to the low of price action, this forms the equal distance channel. Price Action is bounce within the two trendlines, within the EDC.
So, price action is resisted by the upper trendline, or supported by the lower trendline. Buy when price action is near the lower trendline, or sell when the price action is near the upper trendline. But, whatever it is, wait for the clear confirmation before taking any action.
From the Channel, we can see the price action is continued to be lower. Bear trend.
If you are a buy and hold strategist, Will you sell now or buy now? Remember only buy near support, and sell near resistance. Wait for the price action draw near either resistance or support before action.
Think Think got more Things
In trading, some predict the up or down on the trend. Here, we look for support, strong support to buy. Or take profit when price action test the resistance.
20220624 PropNex Limited and MACD
Moses Power Charting
Official AmiBrokerAcademy.com Charting
Disclaimer
The above result is for illustration purpose. It is meant to be used for learning buy or sell signals. We do not recommend for any particular stocks. If particular stocks of such are mentioned, they are meant as a demonstration of Amibroker as a powerful charting software. Amibroker is a charting software, it can program to scan the stocks for buy and sell signals. Or backtest for any trading strategy or technique.
We post script generated signals. Not all scan results are shown here depending on selection criterial. The MACD signal should use with price action. Users must understand what MACD and price action are all about before using them. If necessary you should attend a course to learn more on Technical Analysis (TA) and Moving Average Convergence Divergence, MACD.
Once again, the website does not guarantee any results or investment return based on the information and instruction you have read here. It should be used as learning aids only and if you decide to trade real money, all trading decision should be your own.
We learn from many past and present great traders. Kudo to these master.
Welcome to AmiBroker Academy dot com, amibrokeracademy.com.
If There is Only One Chart This is It
Moses Power Stock Chart.
We Believe – Buy Support or Sell Resistance.
1) Wilmar International and Price Action
Price Action reflect the market emotions, it factor in news, buy or sell emotions.
Connect the high and draw a trendline, copy and paste the trendline to the low of price action, this forms the equal distance channel. Price Action is bounce within the two trendlines.
So, price action is resisted by the upper trendline, or supported by the lower trendline. So, by when price action is near the lower trendline, or sell when the price action is near the upper trendline. But, whatever it is, wait for the confirmation before any action.
If you are a buy and hold strategist, Will you sell now or buy now? Remember only buy near support, and sell near resistance. Wait for the price action draw near either resistance or support before action.
Think Think got more Things
In trading, some predict the up or down on the trend. Here, we look for support, strong support to buy. Or take profit when price action test the resistance.
20220622 Wilmar International Price Action
Moses Power Charting
Official AmiBrokerAcademy.com Charting
Disclaimer
The above result is for illustration purpose. It is meant to be used for learning buy or sell signals. We do not recommend for any particular stocks. If particular stocks of such are mentioned, they are meant as a demonstration of Amibroker as a powerful charting software. Amibroker is a charting software, it can program to scan the stocks for buy and sell signals. Or backtest for any trading strategy or technique.
We post script generated signals. Not all scan results are shown here depending on selection criterial. The MACD signal should use with price action. Users must understand what MACD and price action are all about before using them. If necessary you should attend a course to learn more on Technical Analysis (TA) and Moving Average Convergence Divergence, MACD.
Once again, the website does not guarantee any results or investment return based on the information and instruction you have read here. It should be used as learning aids only and if you decide to trade real money, all trading decision should be your own.
We learn from many past and present great traders. Kudo to these master.
Welcome to AmiBroker Academy dot com, amibrokeracademy.com.
If There is Only One Chart This is It
Moses Power Stock Chart.
We Believe – Buy Support or Sell Resistance.
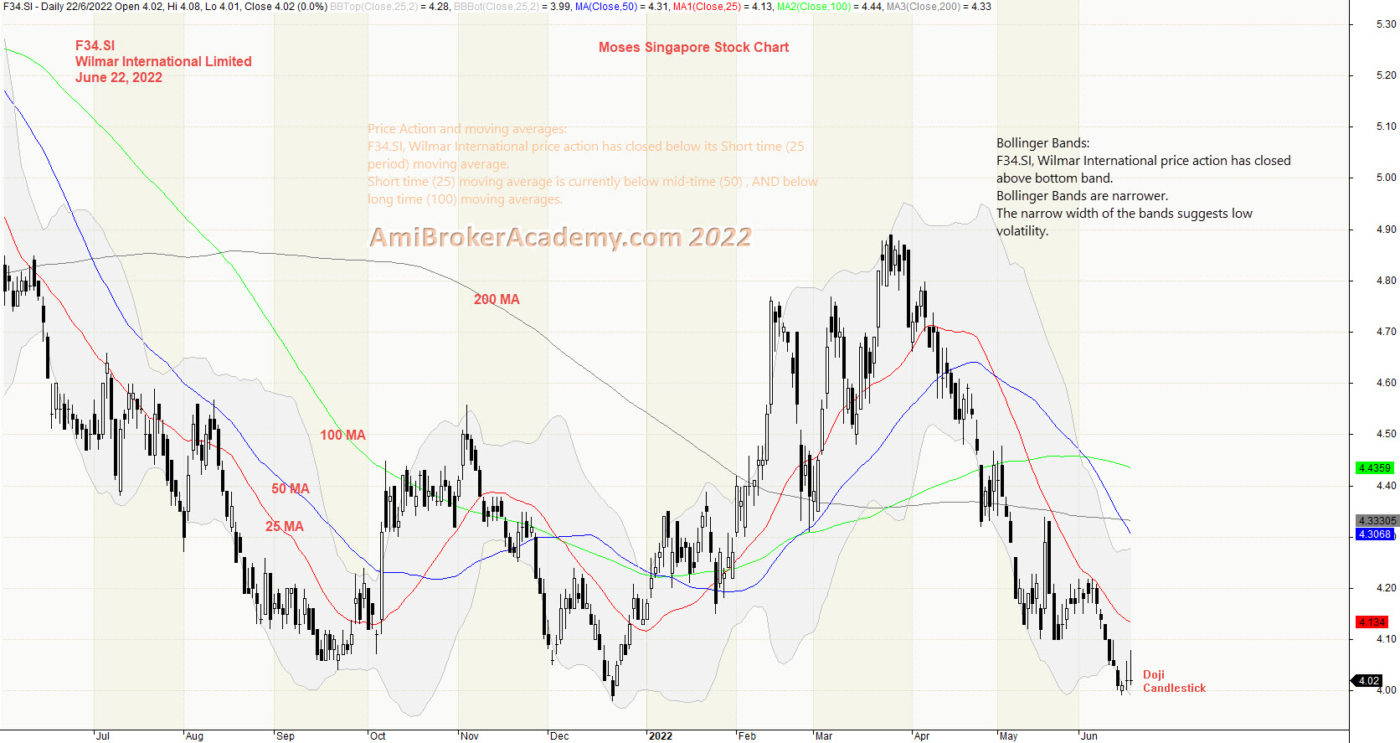
1) Wilmar International and Bollinger Bands and Moving Averages
Price Action reflect the market emotions, it factor in news, buy or sell emotions.
Moving Average is a great visual aid. And MACD is a great and easy to understand indicator. But there is a good indicator too, Bollinger Bands. Price Action is bounded within the Bollinger Bands. Buy at the lower band and Sell the higher band. But wait for confirmation.
If you are a buy and hold strategist, Will you sell now or buy now? Remember only buy near support, and sell near resistance. Wait for the price action draw near either resistance or support before action.
Think Think got more Things
In trading, some predict the up or down on the trend. Here, we look for support, strong support to buy. Or take profit when price action test the resistance.
20220622 Wilmar International and Bollinger Bands.jpg
Moses Power Charting
Official AmiBrokerAcademy.com Charting
Disclaimer
The above result is for illustration purpose. It is meant to be used for learning buy or sell signals. We do not recommend for any particular stocks. If particular stocks of such are mentioned, they are meant as a demonstration of Amibroker as a powerful charting software. Amibroker is a charting software, it can program to scan the stocks for buy and sell signals. Or backtest for any trading strategy or technique.
We post script generated signals. Not all scan results are shown here depending on selection criterial. The MACD signal should use with price action. Users must understand what MACD and price action are all about before using them. If necessary you should attend a course to learn more on Technical Analysis (TA) and Moving Average Convergence Divergence, MACD.
Once again, the website does not guarantee any results or investment return based on the information and instruction you have read here. It should be used as learning aids only and if you decide to trade real money, all trading decision should be your own.
We learn from many past and present great traders. Kudo to these master.
Welcome to AmiBroker Academy dot com, amibrokeracademy.com.
If There is Only One Chart This is It
Moses Power Stock Chart.
We Believe – Buy Support or Sell Resistance.
1) Wilmar International and MACD Divergence
Price Action reflect the market emotions, it factor in news, buy or sell emotions.
Moving Average is a great visual aid. And MACD is a great and easy to understand indicator. When MACD Divergence happen, there is a possibility that the price action may change in direction. So, a pullback is expected. But, remember, you don’t stop at every traffic light. Therefore, the pullback may not happen. This is to headsup info, wait for comfirmation.
If you are a buy and hold strategist, Will you sell now or buy now? Remember only buy near support, and sell near resistance. Wait for the price action draw near either resistance or support before action.
Think Think got more Things
In trading, some predict the up or down on the trend. Here, we look for support, strong support to buy. Or take profit when price action test the resistance.
20220622 Wilmar International and MACD
Moses Power Charting
Official AmiBrokerAcademy.com Charting
Disclaimer
The above result is for illustration purpose. It is meant to be used for learning buy or sell signals. We do not recommend for any particular stocks. If particular stocks of such are mentioned, they are meant as a demonstration of Amibroker as a powerful charting software. Amibroker is a charting software, it can program to scan the stocks for buy and sell signals. Or backtest for any trading strategy or technique.
We post script generated signals. Not all scan results are shown here depending on selection criterial. The MACD signal should use with price action. Users must understand what MACD and price action are all about before using them. If necessary you should attend a course to learn more on Technical Analysis (TA) and Moving Average Convergence Divergence, MACD.
Once again, the website does not guarantee any results or investment return based on the information and instruction you have read here. It should be used as learning aids only and if you decide to trade real money, all trading decision should be your own.
We learn from many past and present great traders. Kudo to these master.