9 February 2023
Welcome!
Welcome to AmiBroker Academy dot com, amibrokeracademy.com.
If There is Only One Chart. This is It!
The Moses Power Stock Chart.
Picture worth a thousand words. Trade what you see!
We Only Believe – Buy Support or Sell Resistance.
2023 Forecast – Look Left Think Right
Look left and think right.
There are many uncertainty in the last three years plus due to COVID 19 pandemic situation. After all the market is not too bad. Don’t you agree?
There are uncertainty in the current market. But remember the market is always uncertain. With the war and super power struggle for more power and due to covid 19 pandemic. Plus having player like, Elon Musk steering up bought Twitter. … But who care?! Just trade what you see.
We study the stock chart using price action plus sometimes GMMA, Woodies CCI, MACD, River, Ichimoku Cloud, Bollinger Bands and Moving Average.
Moving Average is a great visual tool. MACD indicator is a easy to understand indicator. Support and Resistance is important and fundamental tool for buy sell.
When the price action continue to move higher but MACD is weaker, the price action may be change in direction. The opposite is true too, when price action is weaker, forming lower low but the MACD or MACD Histogram is forming higher low. Price action is also may be change in direction.
But remember indicator is like traffic light, it only provides you a heads-up for the possible upcoming change.
Manage your trade.
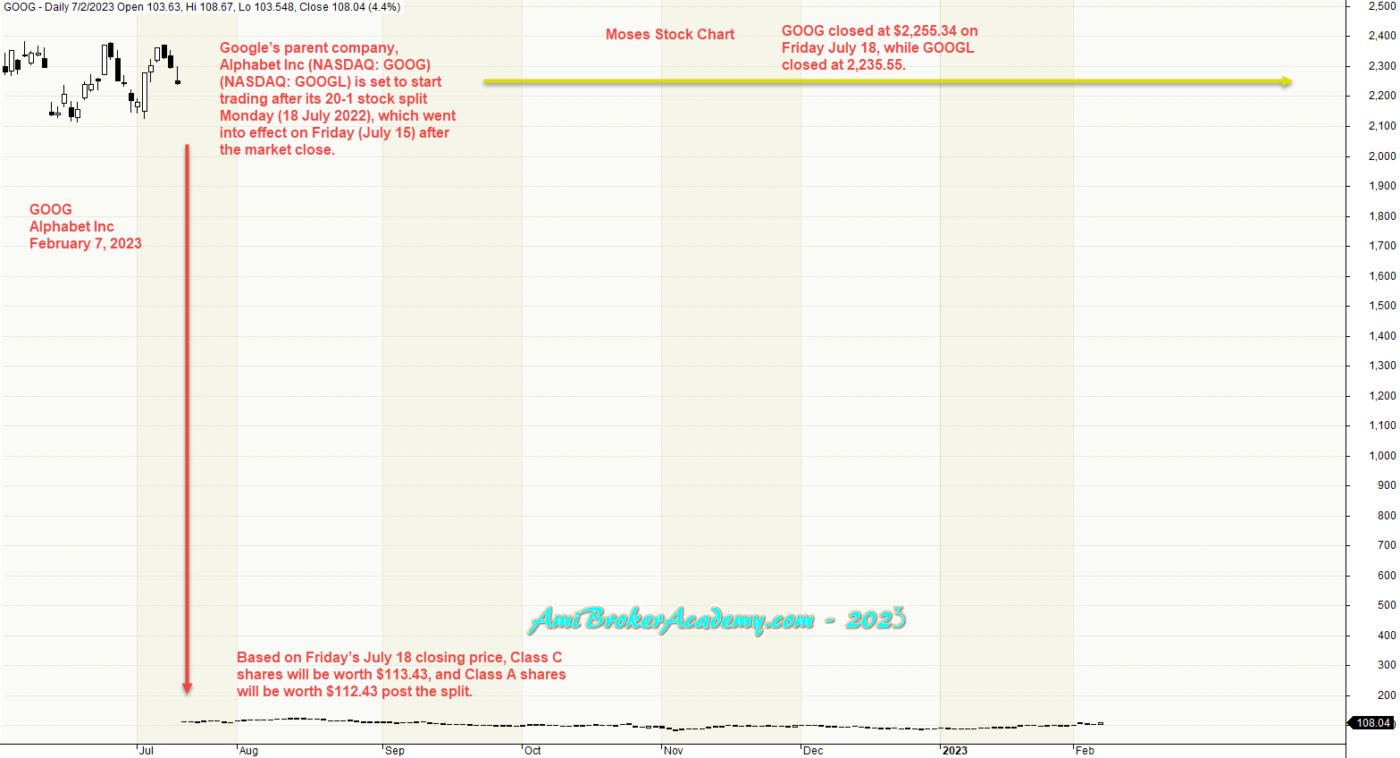
Make the Stock Price within Reach, Stock Split 20:1 in July Last Year
Just One Chart
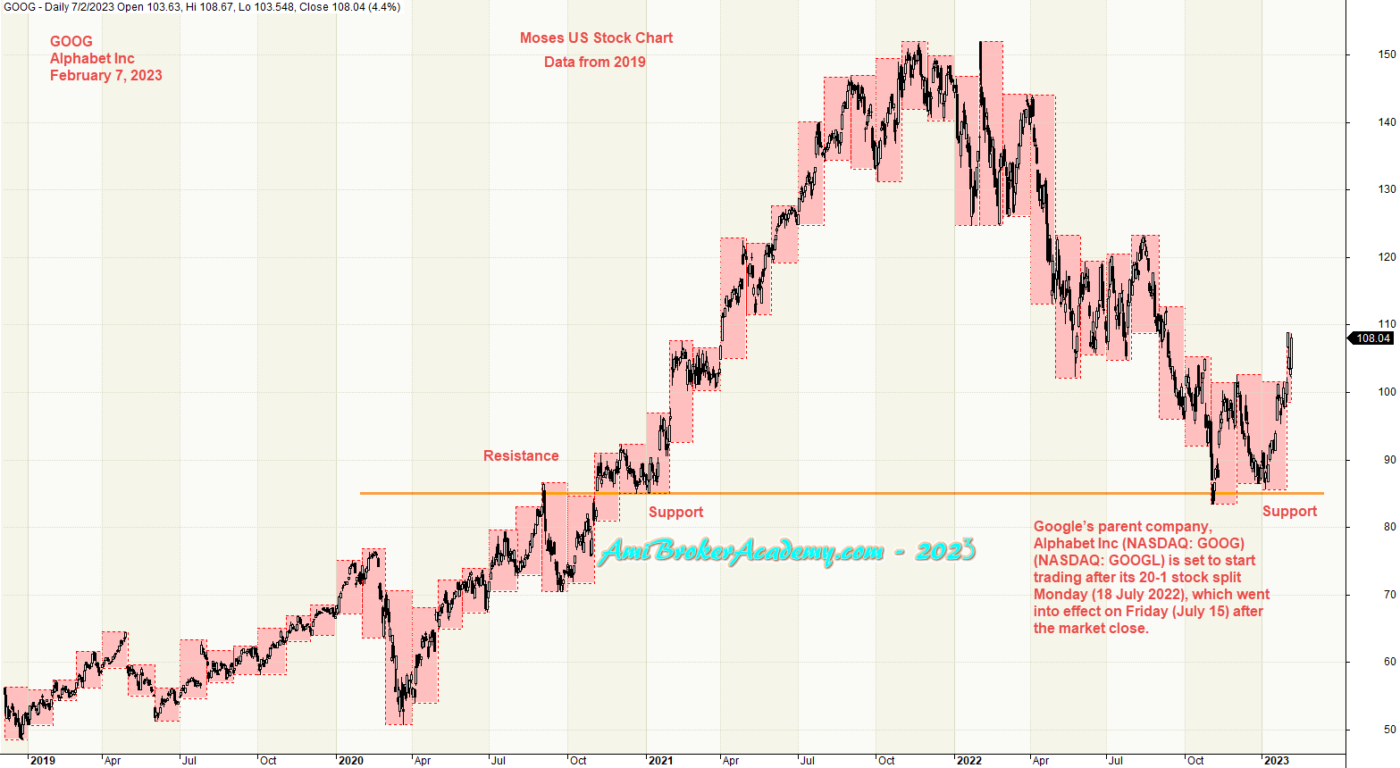
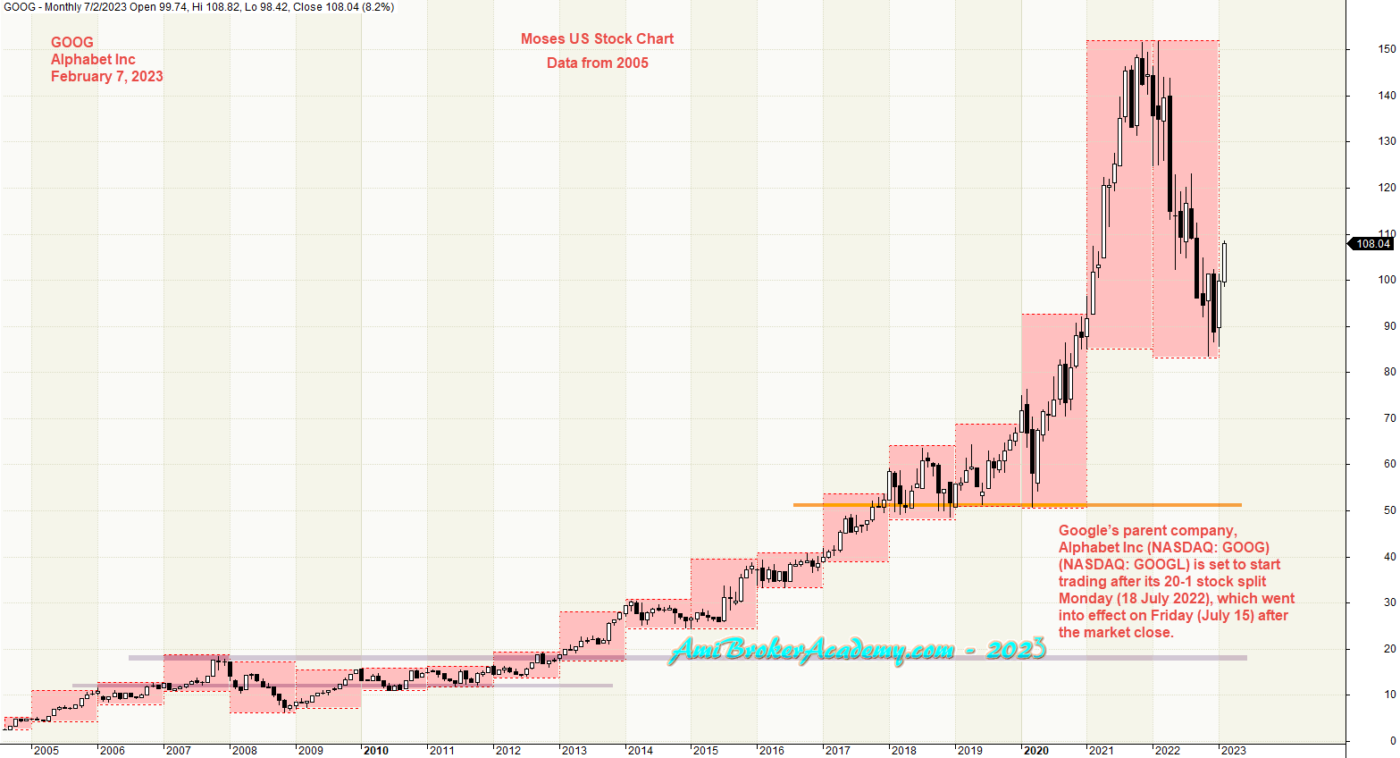
1) Google Stock Alphabet Inc – Data from 2019
Look left, and think and trade right, for data before 2019, Google Stock price has got low in 2019 retest the same low to the peak in 2021 and test again in 2022, see chart. To put the stock within reach for majority, in July last year, Alphabet Inc stock has got for a 20:1 stock split. It brings the stock price from 2255.34 dollars down to 113.43 dollars.
Our trading strategy is to reduce risk is to buy support and sell resistance.
Price has been resisted at 150 dollars and drop, see chart.
Two things can happen, price action breakout from the strong level, or price action will fail to breakout and move south.
Now Google stock price has fail to breakout higher, and move south? From the chart, probably the market may stay below 150 dollars for a while. Price Action has got support and rebounce.
Manage your risk.
Moses Power Charting
Official AmiBrokerAcademy.com Charting
Disclaimer
The above result is for illustration purpose. It is meant to be used for learning buy or sell signals. We do not recommend for any particular stocks. If particular stocks of such are mentioned, they are meant as a demonstration of Amibroker as a powerful charting software. Amibroker is a charting software, it can program to scan the stocks for buy and sell signals. Or backtest for any trading strategy or technique.
We post script generated signals. Not all scan results are shown here depending on selection criterial. The MACD signal should use with price action. Users must understand what MACD and price action are all about before using them. If necessary you should attend a course to learn more on Technical Analysis (TA) and Moving Average Convergence Divergence, MACD.
Once again, the website does not guarantee any results or investment return based on the information and instruction you have read here. It should be used as learning aids only and if you decide to trade real money, all trading decision should be your own.
We learn from many past and present great traders. Kudo to these master.