Welcome to AmiBroker Academy dot com, amibrokeracademy.com.
If There is Only One Chart This is It
That will be Moses Power Stock Chart.
We Believe – Buy Support or Sell Resistance.
Treasury Yield
What Is the Treasury Yield? Treasury yield is the effective annual interest rate that the U.S. government pays on one of its debt obligations, expressed as a percentage.
Or in other words, Treasury yield is the an annual return to investors when the investors holding a U.S. government security with a given maturity.
Treasury yields show how investors assess the economy’s prospects. The higher the yields on long-term U.S. Treasuries, the more confidence investors have in the economic outlook. But high long-term yields can also be a signal of rising inflation expectations.
There is a lot of uncertainty.
We use to study the stock chart using GMMA, Woodies CCI, MACD, River, Bollinger Bands and Moving Average with the price action.
Moving Average is a great visual tool. MACD indicator is a easy to understand indicator. Support and Resistance is important and fundamental tool for trading.
When the price action continue to move higher but MACD is weaker, the price action may be change in direction. The opposite is true too, when price action is weaker, forming lower low but the MACD or MACD Histogram is forming higher low. Price action is also may be change in direction.
But remember indicator is like traffic light, it provides you a heads-up.
Manage your trade.
Just One Chart
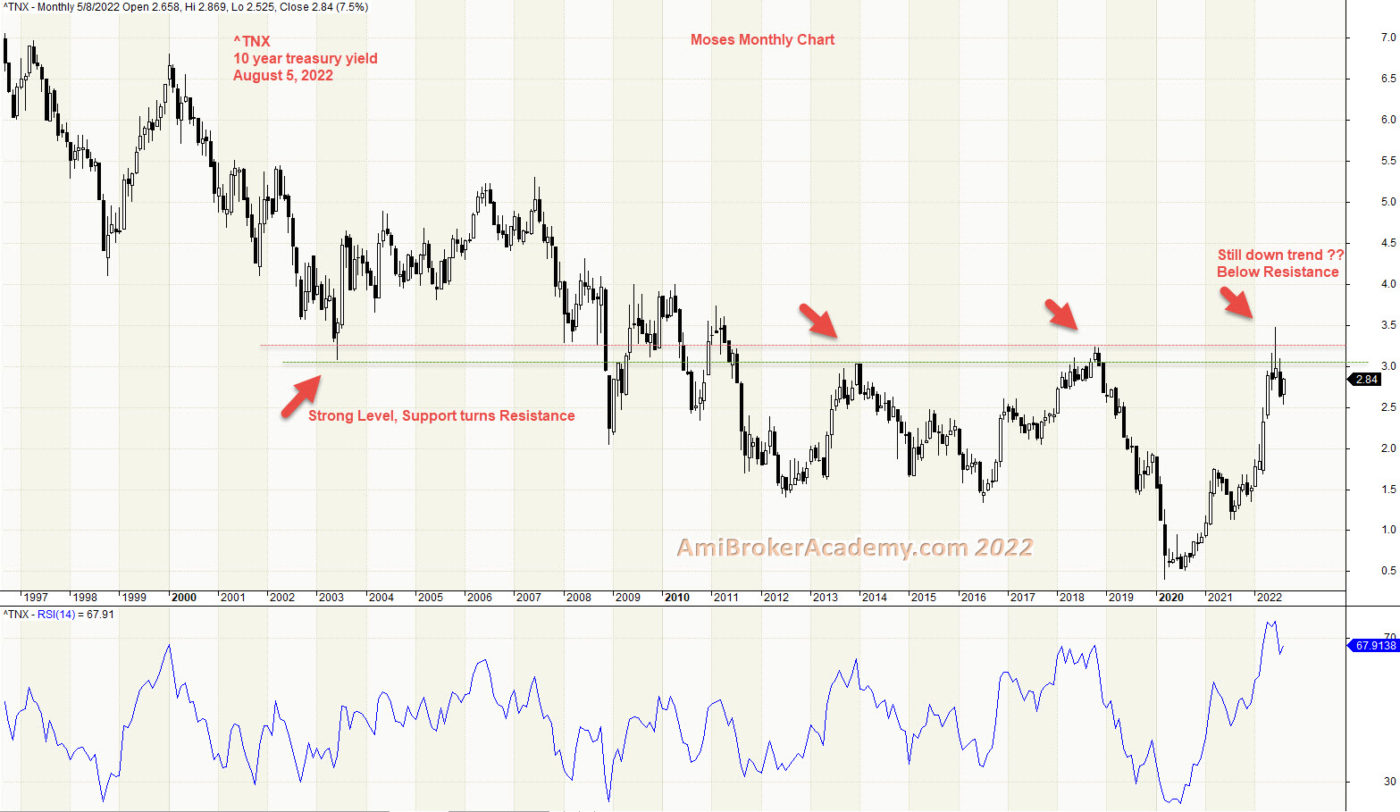
1) ^TNX Ten (10) Years Treasury Yield Level
We have a monthly chart from 1997. From the chart, see a strong level, support turns resistance.
Remember to buy support and sell resistance. Where is the price action now? Near the resistance.
August 5, 2022 Ten Year Treasury Yield and Strong Level
Moses Power Charting
Official AmiBrokerAcademy.com Charting
Disclaimer
The above result is for illustration purpose. It is meant to be used for learning buy or sell signals. We do not recommend for any particular stocks. If particular stocks of such are mentioned, they are meant as a demonstration of Amibroker as a powerful charting software. Amibroker is a charting software, it can program to scan the stocks for buy and sell signals. Or backtest for any trading strategy or technique.
We post script generated signals. Not all scan results are shown here depending on selection criterial. The MACD signal should use with price action. Users must understand what MACD and price action are all about before using them. If necessary you should attend a course to learn more on Technical Analysis (TA) and Moving Average Convergence Divergence, MACD.
Once again, the website does not guarantee any results or investment return based on the information and instruction you have read here. It should be used as learning aids only and if you decide to trade real money, all trading decision should be your own.
We learn from many past and present great traders. Kudo to these master.
Welcome to AmiBroker Academy dot com, amibrokeracademy.com.
If There is Only One Chart This is It
That will be Moses Power Stock Chart.
We Believe – Buy Support or Sell Resistance.
Energy
There is a lot of uncertainty.
We use to study the stock chart using GMMA, Woodies CCI, MACD, River, Bollinger Bands and Moving Average with the price action.
Moving Average is a great visual tool. MACD indicator is a easy to understand indicator. Support and Resistance is important and fundamental tool for trading.
When the price action continue to move higher but MACD is weaker, the price action may be change in direction. The opposite is true too, when price action is weaker, forming lower low but the MACD or MACD Histogram is forming higher low. Price action is also may be change in direction.
But remember indicator is like traffic light, it provides you a heads-up.
Manage your trade.
Just One Chart
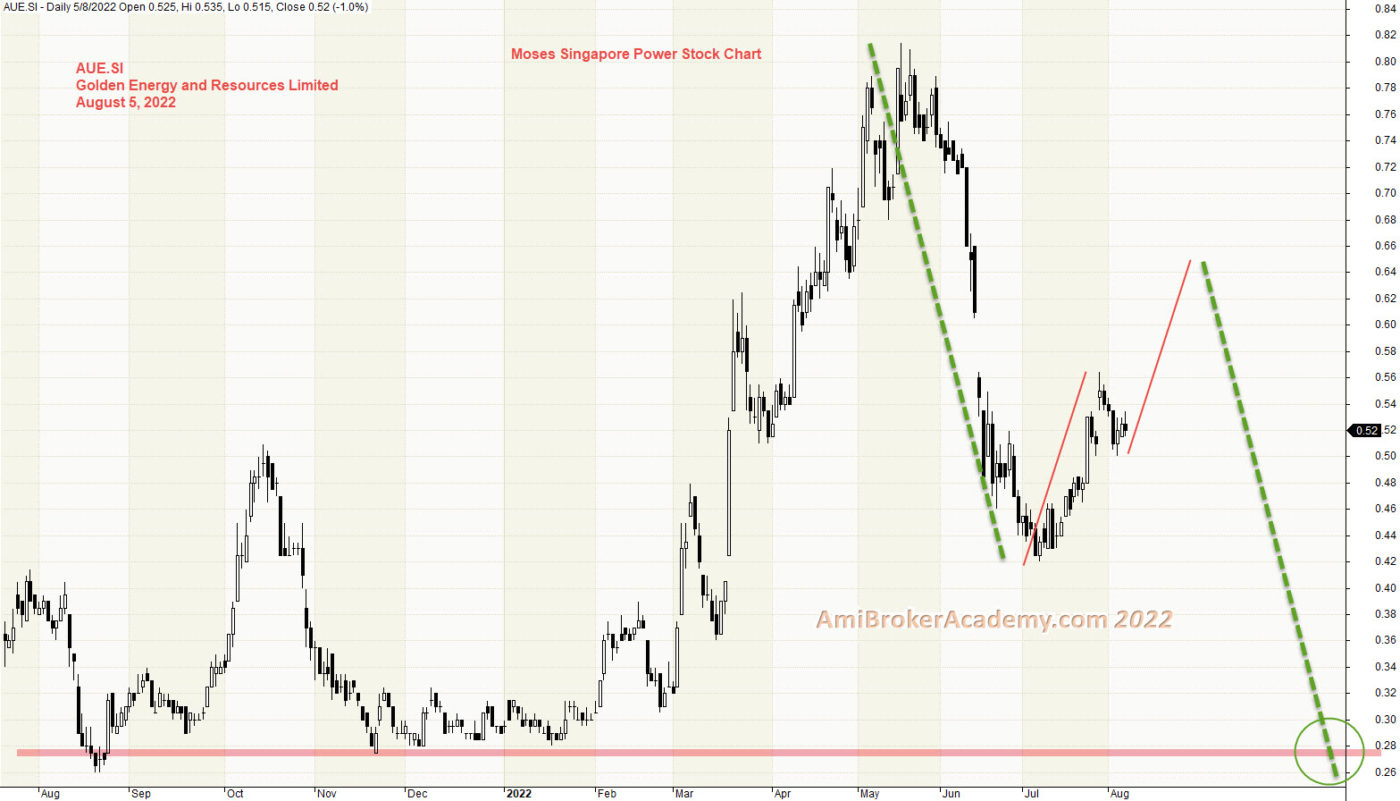
1) AUE.SI Golden Energy and Resources and ABCD Pattern
The down ABCD pattern we share on the August 3 chart is still valid. Except, the small ABCD up make the down pattern more real.
Remember to buy support and sell resistance.
20220805 Golden Energy and Resourcecs and ABCD
Moses Power Charting
Official AmiBrokerAcademy.com Charting
Disclaimer
The above result is for illustration purpose. It is meant to be used for learning buy or sell signals. We do not recommend for any particular stocks. If particular stocks of such are mentioned, they are meant as a demonstration of Amibroker as a powerful charting software. Amibroker is a charting software, it can program to scan the stocks for buy and sell signals. Or backtest for any trading strategy or technique.
We post script generated signals. Not all scan results are shown here depending on selection criterial. The MACD signal should use with price action. Users must understand what MACD and price action are all about before using them. If necessary you should attend a course to learn more on Technical Analysis (TA) and Moving Average Convergence Divergence, MACD.
Once again, the website does not guarantee any results or investment return based on the information and instruction you have read here. It should be used as learning aids only and if you decide to trade real money, all trading decision should be your own.
We learn from many past and present great traders. Kudo to these master.
Welcome to AmiBroker Academy dot com, amibrokeracademy.com.
If There is Only One Chart This is It
That will be Moses Power Stock Chart.
We Believe – Buy Support or Sell Resistance.
Energy
There is a lot of uncertainty.
We use to study the stock chart using GMMA, Woodies CCI, MACD, River, Bollinger Bands and Moving Average with the price action.
Moving Average is a great visual tool. MACD indicator is a easy to understand indicator. Support and Resistance is important and fundamental tool for trading.
When the price action continue to move higher but MACD is weaker, the price action may be change in direction. The opposite is true too, when price action is weaker, forming lower low but the MACD or MACD Histogram is forming higher low. Price action is also may be change in direction.
But remember indicator is like traffic light, it provides you a heads-up.
Manage your trade.
Just One Chart
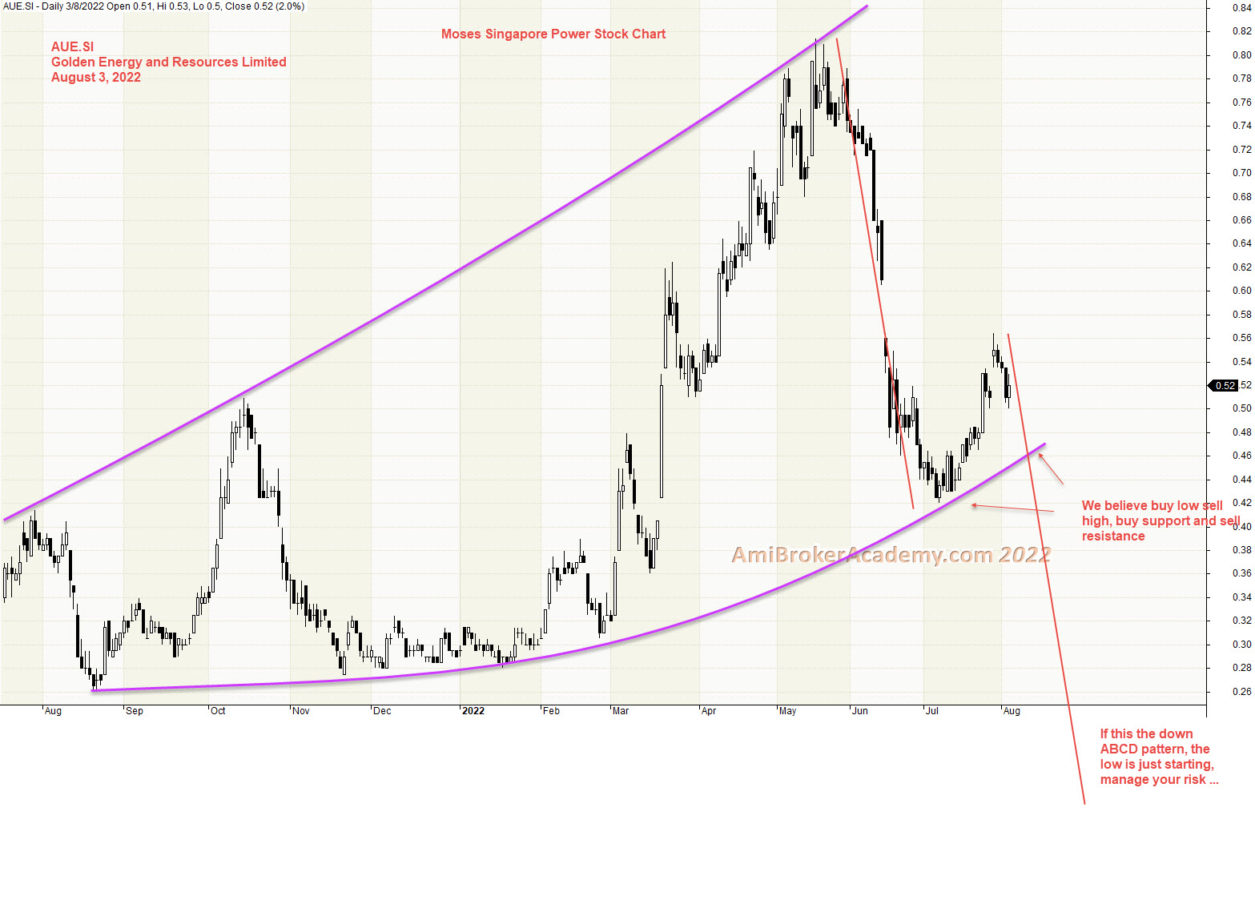
1) AUE.SI Golden Energy and Resources and Price Action.jpg
Forming a down ABCD pattern? Will see.
Remember to buy support and sell resistance.
20220803 Golden Energy and Resources and Price Action
Moses Power Charting
Official AmiBrokerAcademy.com Charting
Disclaimer
The above result is for illustration purpose. It is meant to be used for learning buy or sell signals. We do not recommend for any particular stocks. If particular stocks of such are mentioned, they are meant as a demonstration of Amibroker as a powerful charting software. Amibroker is a charting software, it can program to scan the stocks for buy and sell signals. Or backtest for any trading strategy or technique.
We post script generated signals. Not all scan results are shown here depending on selection criterial. The MACD signal should use with price action. Users must understand what MACD and price action are all about before using them. If necessary you should attend a course to learn more on Technical Analysis (TA) and Moving Average Convergence Divergence, MACD.
Once again, the website does not guarantee any results or investment return based on the information and instruction you have read here. It should be used as learning aids only and if you decide to trade real money, all trading decision should be your own.
We learn from many past and present great traders. Kudo to these master.
Welcome to AmiBroker Academy dot com, amibrokeracademy.com.
If There is Only One Chart This is It
That will be Moses Power Stock Chart.
We Believe – Buy Support or Sell Resistance.
Gold
There is a lot of uncertainty.
We use to study the stock chart using GMMA, Woodies CCI, MACD, River, Bollinger Bands and Moving Average with the price action.
Moving Average is a great visual tool. MACD indicator is a easy to understand indicator. Support and Resistance is important and fundamental tool for trading.
When the price action continue to move higher but MACD is weaker, the price action may be change in direction. The opposite is true too, when price action is weaker, forming lower low but the MACD or MACD Histogram is forming higher low. Price action is also may be change in direction.
But remember indicator is like traffic light, it provides you a heads-up.
Manage your trade.
Just One Chart
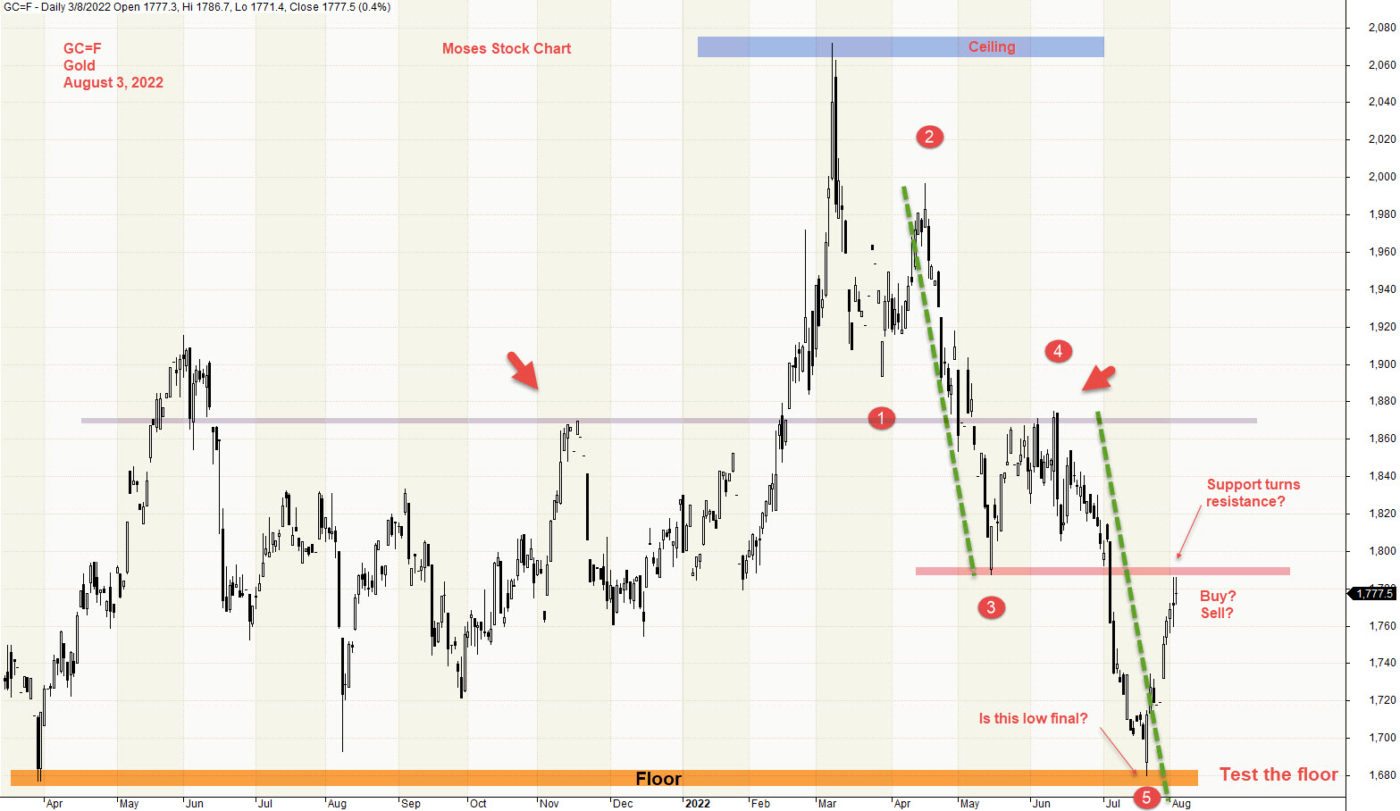
1) Gold Price Action and ABCD Pattern
Breaking up above 2080 dollars level ceiling is your hope. Your big fat hop?
1680 dollars is the floor, can this floor hold the fall. Manage your risk.
August 3, 2022 Gold Price Action and ABCD Pattern
Moses Power Charting
Official AmiBrokerAcademy.com Charting
Disclaimer
The above result is for illustration purpose. It is meant to be used for learning buy or sell signals. We do not recommend for any particular stocks. If particular stocks of such are mentioned, they are meant as a demonstration of Amibroker as a powerful charting software. Amibroker is a charting software, it can program to scan the stocks for buy and sell signals. Or backtest for any trading strategy or technique.
We post script generated signals. Not all scan results are shown here depending on selection criterial. The MACD signal should use with price action. Users must understand what MACD and price action are all about before using them. If necessary you should attend a course to learn more on Technical Analysis (TA) and Moving Average Convergence Divergence, MACD.
Once again, the website does not guarantee any results or investment return based on the information and instruction you have read here. It should be used as learning aids only and if you decide to trade real money, all trading decision should be your own.
We learn from many past and present great traders. Kudo to these master.
Welcome to AmiBroker Academy dot com, amibrokeracademy.com.
If There is Only One Chart This is It
That will be Moses Power Stock Chart.
We Believe – Buy Support or Sell Resistance.
Index
There is a lot of uncertainty.
We use to study the stock chart using GMMA, Woodies CCI, MACD, River, Bollinger Bands and Moving Average with the price action.
Moving Average is a great visual tool. MACD indicator is a easy to understand indicator. Support and Resistance is important and fundamental tool for trading.
When the price action continue to move higher but MACD is weaker, the price action may be change in direction. The opposite is true too, when price action is weaker, forming lower low but the MACD or MACD Histogram is forming higher low. Price action is also may be change in direction.
But remember indicator is like traffic light, it provides you a heads-up.
Manage your trade.
Just One Chart
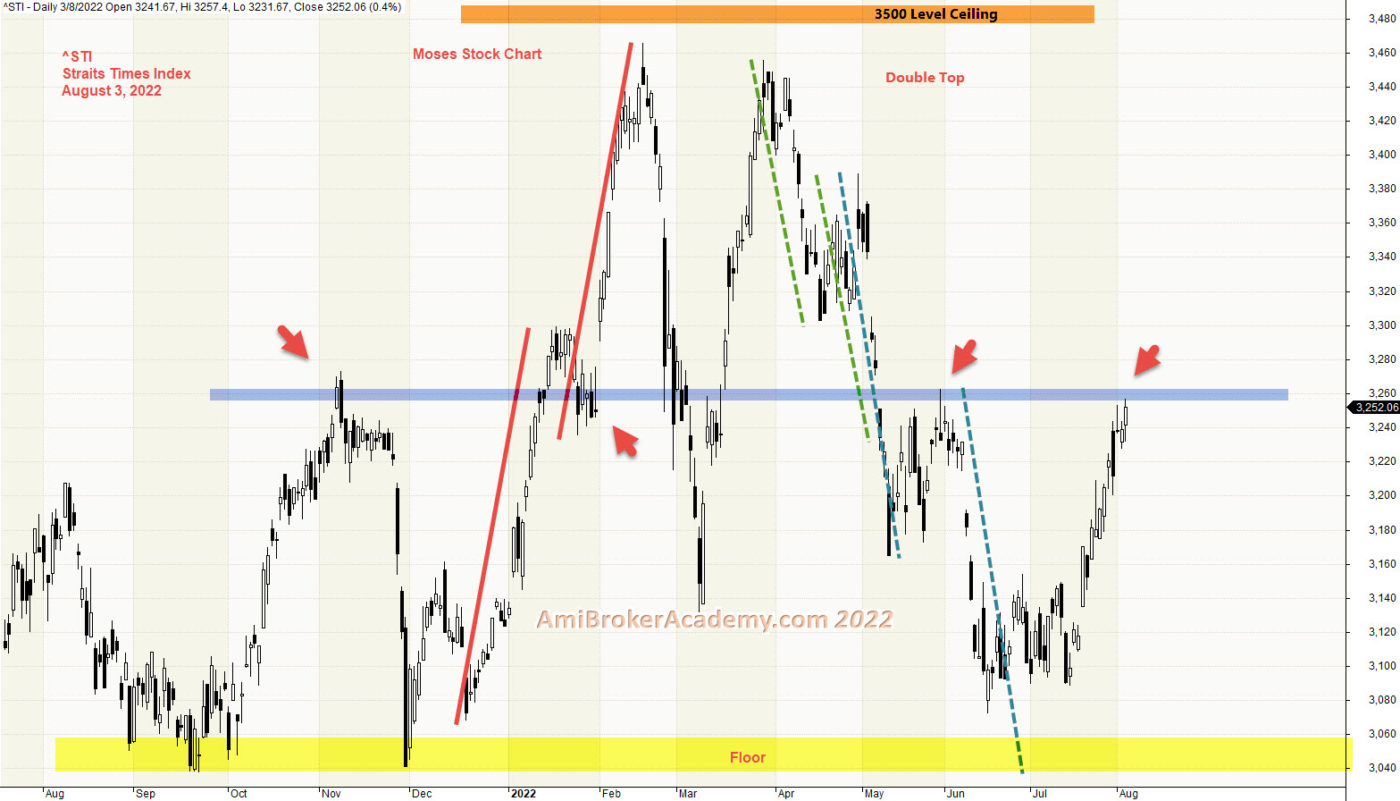
1) Straits Times Index Price Action and ABCD Pattern
Breaking up above 3500 points level ceiling is a hope. A big fat hop? Will see.
3000 points is the floor, can this floor hold the fall. Manage your risk.
20220803 Straits Times Index Price Action and ABCD Pattern
Moses Power Charting
Official AmiBrokerAcademy.com Charting
Disclaimer
The above result is for illustration purpose. It is meant to be used for learning buy or sell signals. We do not recommend for any particular stocks. If particular stocks of such are mentioned, they are meant as a demonstration of Amibroker as a powerful charting software. Amibroker is a charting software, it can program to scan the stocks for buy and sell signals. Or backtest for any trading strategy or technique.
We post script generated signals. Not all scan results are shown here depending on selection criterial. The MACD signal should use with price action. Users must understand what MACD and price action are all about before using them. If necessary you should attend a course to learn more on Technical Analysis (TA) and Moving Average Convergence Divergence, MACD.
Once again, the website does not guarantee any results or investment return based on the information and instruction you have read here. It should be used as learning aids only and if you decide to trade real money, all trading decision should be your own.
We learn from many past and present great traders. Kudo to these master.
Welcome to AmiBroker Academy dot com, amibrokeracademy.com.
If There is Only One Chart This is It
Moses Power Stock Chart.
We Believe – Buy Support or Sell Resistance.
Index Dow Index
There are literally thousands of other options when it comes to these digital currencies. Majority of the cryptocurrency is deep. We studied bank index, ^BKX to understand the market emotions. Now study the key index, such as Dow Jones Index.
Price Action reflect the market emotions, it factor in news, buy or sell emotions.
When the market is bullish, how you trade you eventually still make money. When the market is sideways. You have to ride the wave on buy the bull bias and sell when it is bear.
There are a lot of uncertainty in the current market, many whom make money on crypto are liquidating now to keep themself a float.
We study the stock chart using GMMA, Woodies CCI, MACD, River, Bollinger Bands and Moving Average with the price action.
Moving Average is a great visual tool. MACD indicator is a easy to understand indicator. Support and Resistance is important and fundamental tool for trading.
When the price action continue to move higher but MACD is weaker, the price action may be change in direction. The opposite is true too, when price action is weaker, forming lower low but the MACD or MACD Histogram is forming higher low. Price action is also may be change in direction.
But remember indicator is like traffic light, it provides you a heads-up.
Manage your trade.
Think Think got more Things
In trading, some predict the up or down on the trend. Here, we look for support, strong support to buy. Or take profit when price action test the resistance.
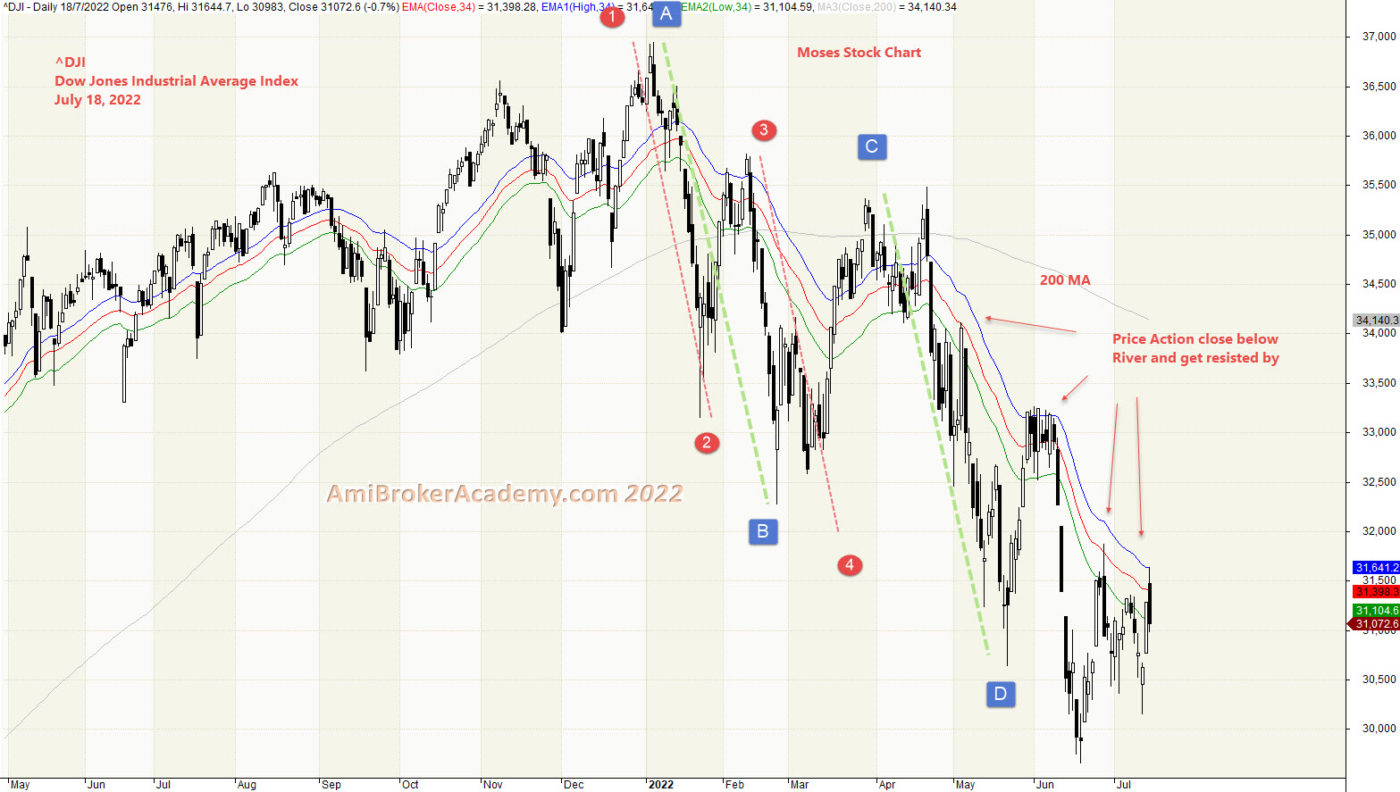
1) ^DJI Dow Jones Industrial Average Index and River
2022 is the peak thereafter price goes south, price action hit the low in June and sideways. Price Action retest the river over and over, River act as resistance to stop price action from going higher.
July 18, 2022 Dow Jones Industrial Average Index and River and Gartley 222 Wave Pattern
Moses Power Charting
Official AmiBrokerAcademy.com Charting
Disclaimer
The above result is for illustration purpose. It is meant to be used for learning buy or sell signals. We do not recommend for any particular stocks. If particular stocks of such are mentioned, they are meant as a demonstration of Amibroker as a powerful charting software. Amibroker is a charting software, it can program to scan the stocks for buy and sell signals. Or backtest for any trading strategy or technique.
We post script generated signals. Not all scan results are shown here depending on selection criterial. The MACD signal should use with price action. Users must understand what MACD and price action are all about before using them. If necessary you should attend a course to learn more on Technical Analysis (TA) and Moving Average Convergence Divergence, MACD.
Once again, the website does not guarantee any results or investment return based on the information and instruction you have read here. It should be used as learning aids only and if you decide to trade real money, all trading decision should be your own.
We learn from many past and present great traders. Kudo to these master.
Welcome to AmiBroker Academy dot com, amibrokeracademy.com.
If There is Only One Chart This is It
Moses Power Stock Chart.
We Believe – Buy Support or Sell Resistance.
Bank Index
There are literally thousands of other options when it comes to these digital currencies. Majority of the cryptocurrency is deep, and study some index to under the market emotion. One thing to look at is bank index. such as ^BKX, BKW NASDAQ Bank Index.
Price Action reflect the market emotions, it factor in news, buy or sell emotions.
When the market is bullish, how you trade you eventually still make money. When the market is sideways. You have to ride the wave on buy the bull bias and sell when it is bear.
There are a lot of uncertainty in the current market, many whom make money on crypto are liquidating now to keep themself a float.
We study the stock chart using GMMA, Woodies CCI, MACD, River, Bollinger Bands and Moving Average with the price action.
Moving Average is a great visual tool. MACD indicator is a easy to understand indicator. Support and Resistance is important and fundamental tool for trading.
When the price action continue to move higher but MACD is weaker, the price action may be change in direction. The opposite is true too, when price action is weaker, forming lower low but the MACD or MACD Histogram is forming higher low. Price action is also may be change in direction.
But remember indicator is like traffic light, it provides you a heads-up.
Manage your trade.
Think Think got more Things
In trading, some predict the up or down on the trend. Here, we look for support, strong support to buy. Or take profit when price action test the resistance.
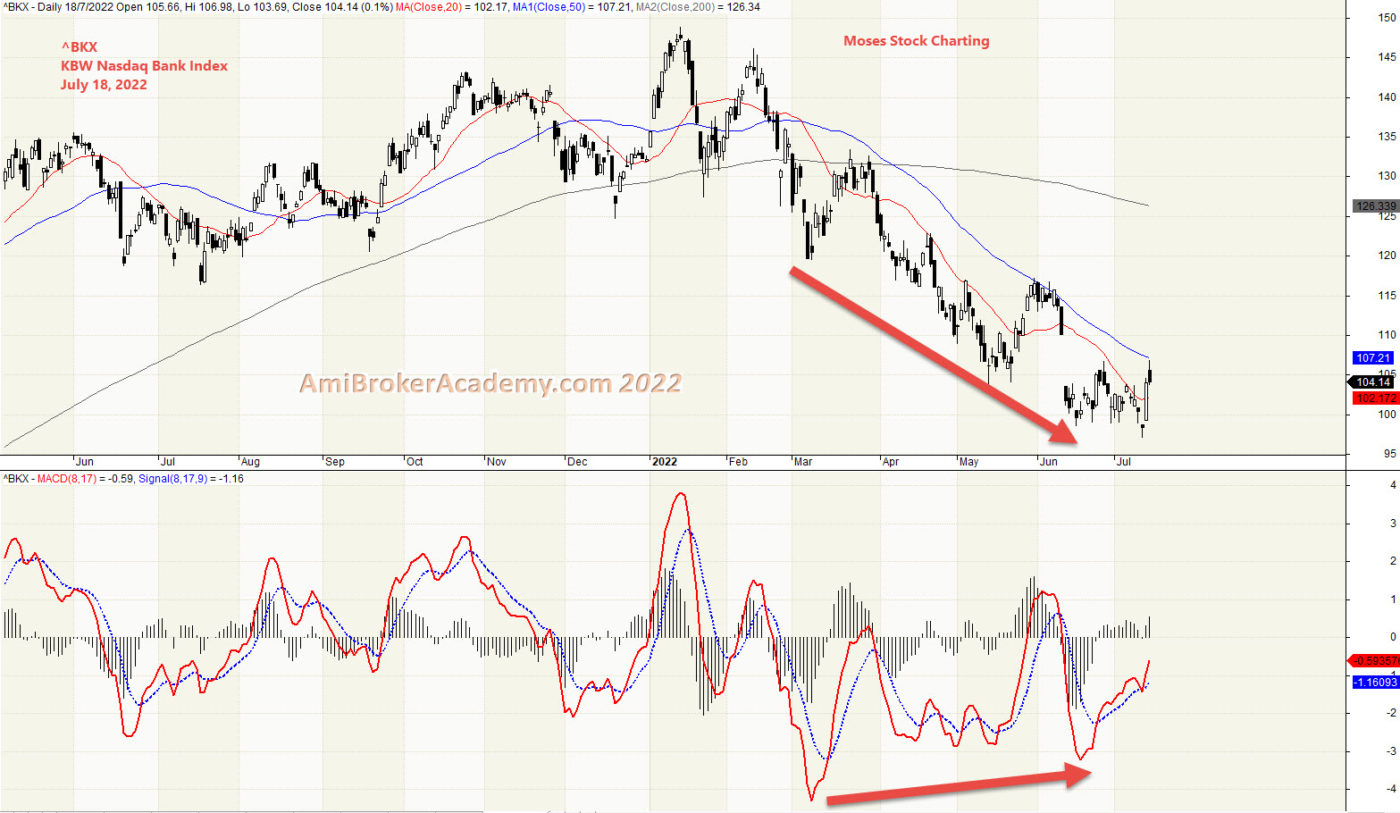
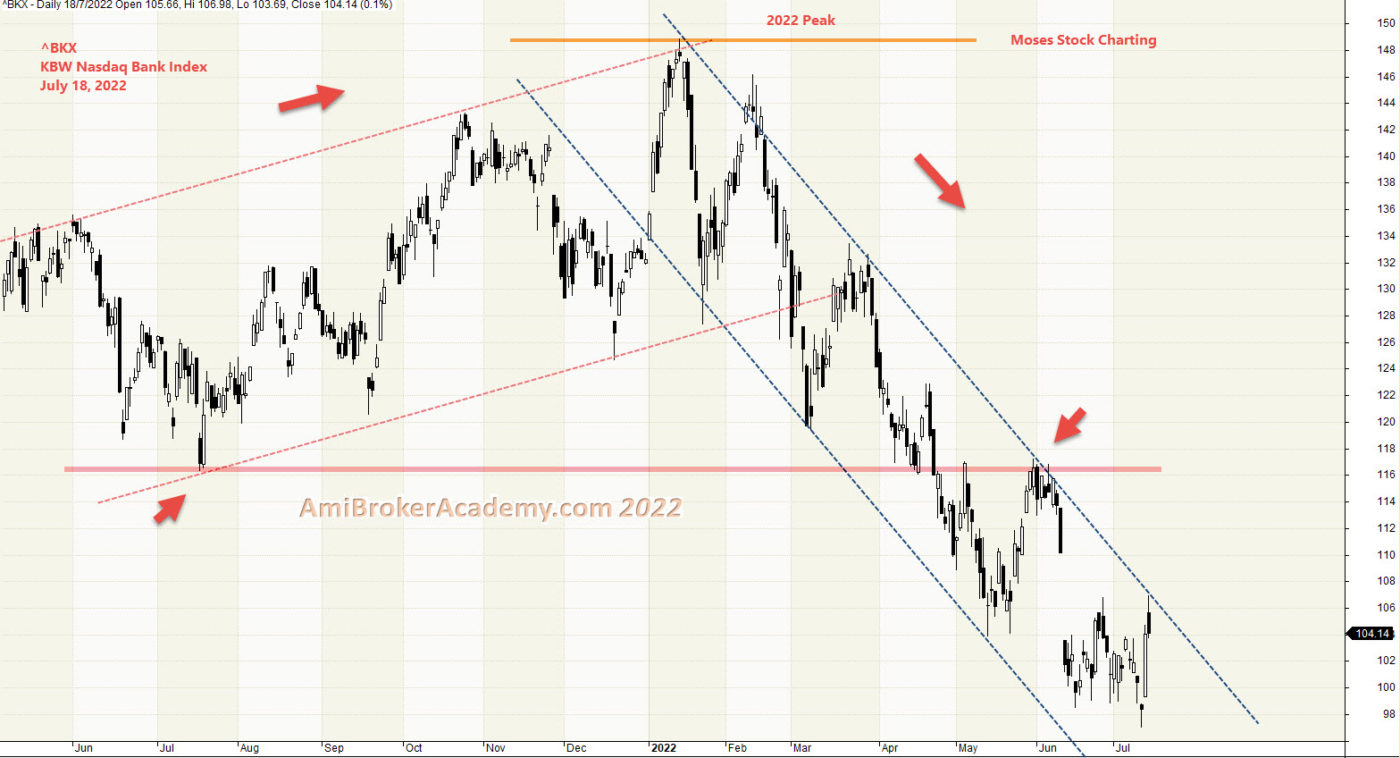
1) ^BKX NASDAQ Bank Index and MACD
2022 is the peak thereafter price goes south, price action hit the low in July. Price Action retest the low a few times.
Price goes lower but the MACD forms higher low. Can the price action rebounce? Will see.
July 18, 2022 NASDAQ Bank Index and MACD Divergence
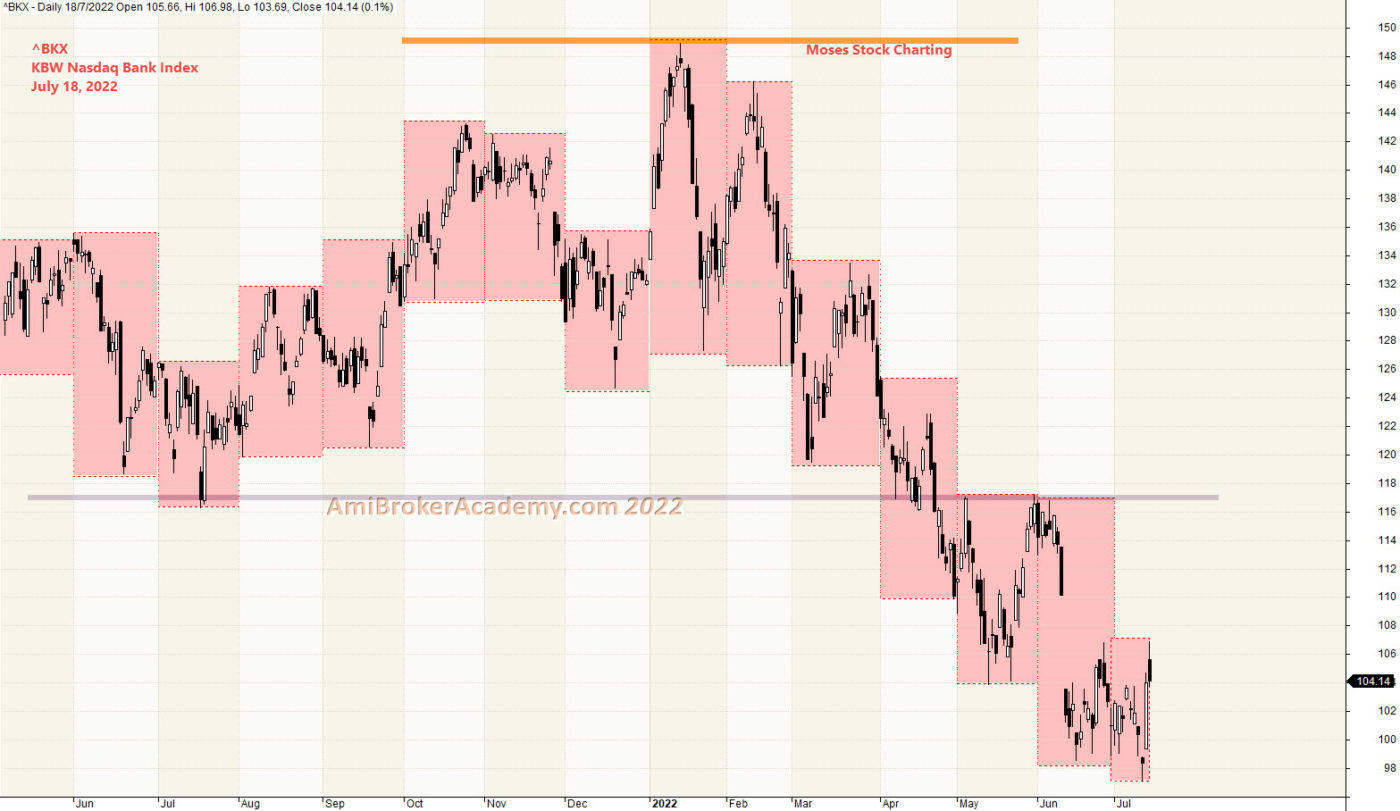
2) NASDAQ Bank Index and Month High Low
July 18, 2022 NASDAQ Bank Index and Month High Low
3) KBW NASDAQ Bank Index Price Action and Equal Distance Channel
July 18, 2022 NASDAQ Bank Index Price Action and Equal Distance Channel
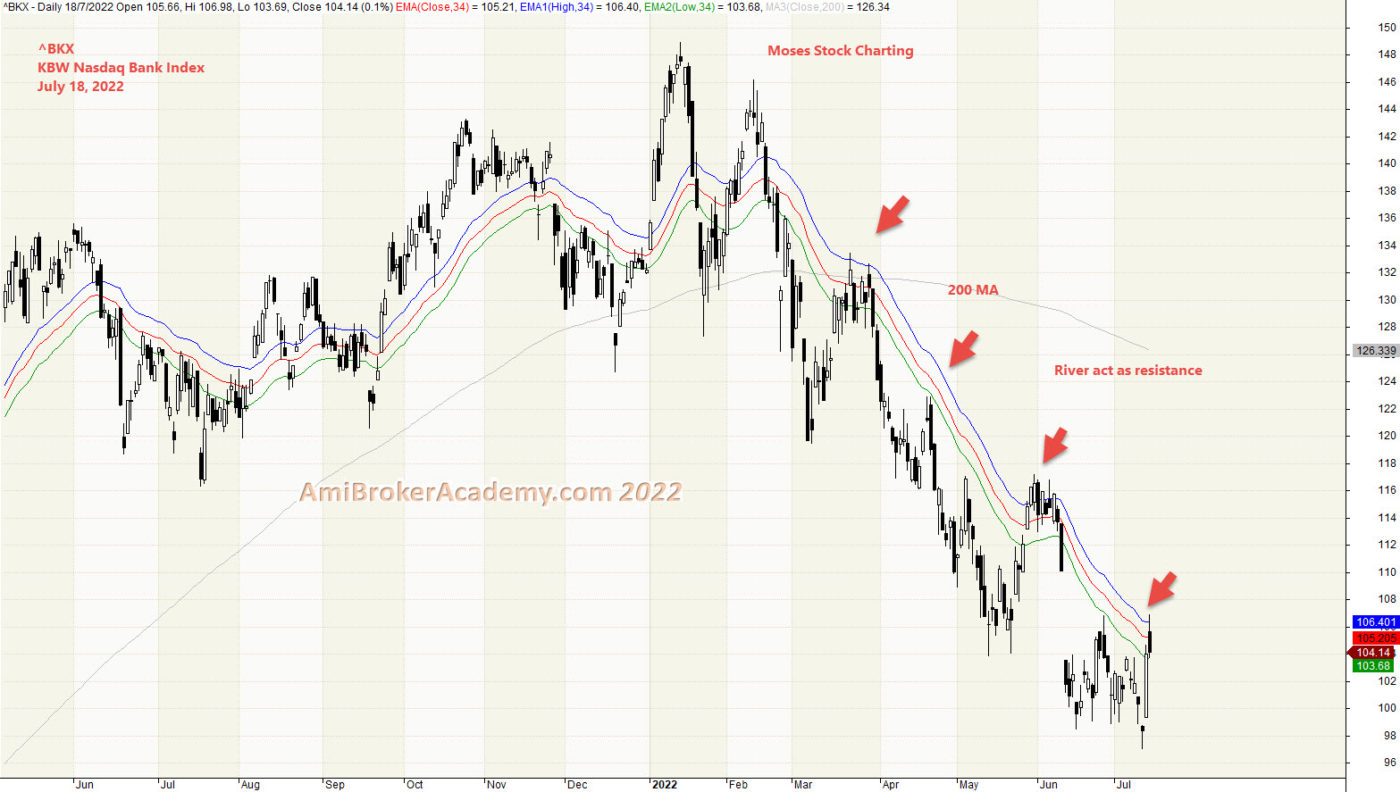
4) KBW NASDAQ Bank Index and River
Price Action close below River and resisted by River. River after zigzag and begin to slop down. Bearish.
July 18 2022 KBW NASDAQ Bank Index and River
Moses Power Charting
Official AmiBrokerAcademy.com Charting
Disclaimer
The above result is for illustration purpose. It is meant to be used for learning buy or sell signals. We do not recommend for any particular stocks. If particular stocks of such are mentioned, they are meant as a demonstration of Amibroker as a powerful charting software. Amibroker is a charting software, it can program to scan the stocks for buy and sell signals. Or backtest for any trading strategy or technique.
We post script generated signals. Not all scan results are shown here depending on selection criterial. The MACD signal should use with price action. Users must understand what MACD and price action are all about before using them. If necessary you should attend a course to learn more on Technical Analysis (TA) and Moving Average Convergence Divergence, MACD.
Once again, the website does not guarantee any results or investment return based on the information and instruction you have read here. It should be used as learning aids only and if you decide to trade real money, all trading decision should be your own.
We learn from many past and present great traders. Kudo to these master.
Welcome to AmiBroker Academy dot com, amibrokeracademy.com.
If There is Only One Chart This is It
Moses Power Stock Chart.
We Believe – Buy Support or Sell Resistance.
USD Coin Crypto
There are literally thousands of other options when it comes to these digital currencies. USD Coin is like Tether is one of the popular one. See the price action chart, but don’t ask me can I use it to buy car or property! I don’t know. …
Like Tether USD Coin’s price is anchored at $1 per coin too. Ture or true? The currency’s founders say that it’s backed by fully reserved assets or those with “equivalent fair value” and those assets are held in accounts with regulated U.S. institutions.
Price Action reflect the market emotions, it factor in news, buy or sell emotions.
When the market is bullish, how you trade you eventually still make money. When the market is sideways. You have to ride the wave on buy the bull bias and sell when it is bear.
There are a lot of uncertainty in the current market, many whom make money on crypto are liquidating now to keep themself a float.
We study the stock chart using GMMA, Woodies CCI, MACD, River, Bollinger Bands and Moving Average with the price action.
Moving Average is a great visual tool. MACD indicator is a easy to understand indicator. Support and Resistance is important and fundamental tool for trading.
When the price action continue to move higher but MACD is weaker, the price action may be change in direction. The opposite is true too, when price action is weaker, forming lower low but the MACD or MACD Histogram is forming higher low. Price action is also may be change in direction.
But remember indicator is like traffic light, it provides you a heads-up.
Manage your trade.
Think Think got more Things
In trading, some predict the up or down on the trend. Here, we look for support, strong support to buy. Or take profit when price action test the resistance.
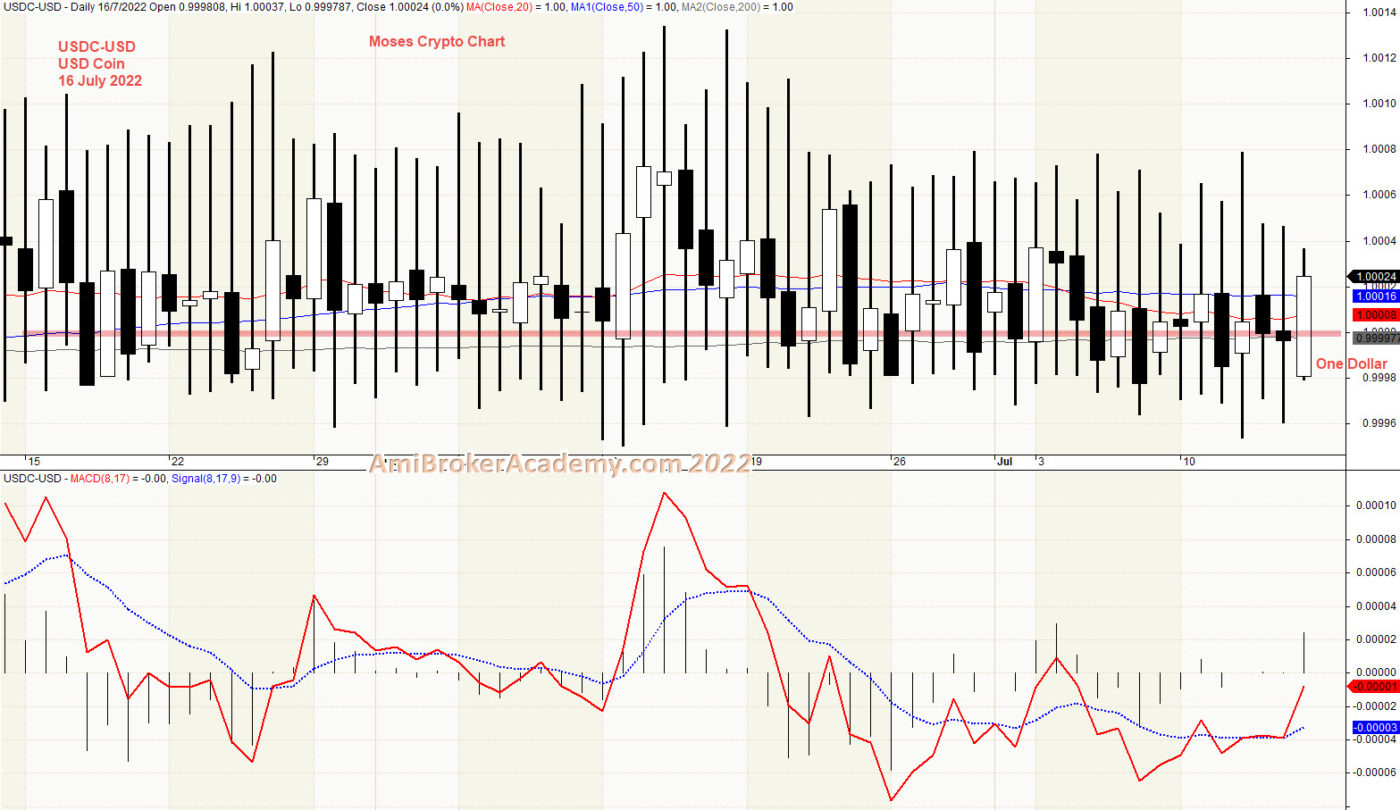
1) USD Coin USDC Crypto Currency and MACD
Can the price action hit One Dollar? Currently, we see price action has deep and bounce. Next we see price action resisted by the strong level below one dollar, see chart.
July 16, 2022 USD Coin (USDC) and MACD
Moses Power Charting
Official AmiBrokerAcademy.com Charting
Disclaimer
The above result is for illustration purpose. It is meant to be used for learning buy or sell signals. We do not recommend for any particular stocks. If particular stocks of such are mentioned, they are meant as a demonstration of Amibroker as a powerful charting software. Amibroker is a charting software, it can program to scan the stocks for buy and sell signals. Or backtest for any trading strategy or technique.
We post script generated signals. Not all scan results are shown here depending on selection criterial. The MACD signal should use with price action. Users must understand what MACD and price action are all about before using them. If necessary you should attend a course to learn more on Technical Analysis (TA) and Moving Average Convergence Divergence, MACD.
Once again, the website does not guarantee any results or investment return based on the information and instruction you have read here. It should be used as learning aids only and if you decide to trade real money, all trading decision should be your own.
We learn from many past and present great traders. Kudo to these master.
There are literally thousands of other options when it comes to these digital currencies. Tether is one of the popular one. See the price action chart, but don’t ask me can I use it to buy car or property! I don’t know. …
Tether’s price is anchored at $1 per coin. Ture or true?
Price Action reflect the market emotions, it factor in news, buy or sell emotions.
When the market is bullish, how you trade you eventually still make money. When the market is sideways. You have to ride the wave on buy the bull bias and sell when it is bear.
There are a lot of uncertainty in the current market, many whom make money on crypto are liquidating now to keep themself a float.
We study the stock chart using GMMA, Woodies CCI, MACD, River, Bollinger Bands and Moving Average with the price action.
Moving Average is a great visual tool. MACD indicator is a easy to understand indicator. Support and Resistance is important and fundamental tool for trading.
When the price action continue to move higher but MACD is weaker, the price action may be change in direction. The opposite is true too, when price action is weaker, forming lower low but the MACD or MACD Histogram is forming higher low. Price action is also may be change in direction.
But remember indicator is like traffic light, it provides you a heads-up.
Manage your trade.
Think Think got more Things
In trading, some predict the up or down on the trend. Here, we look for support, strong support to buy. Or take profit when price action test the resistance.
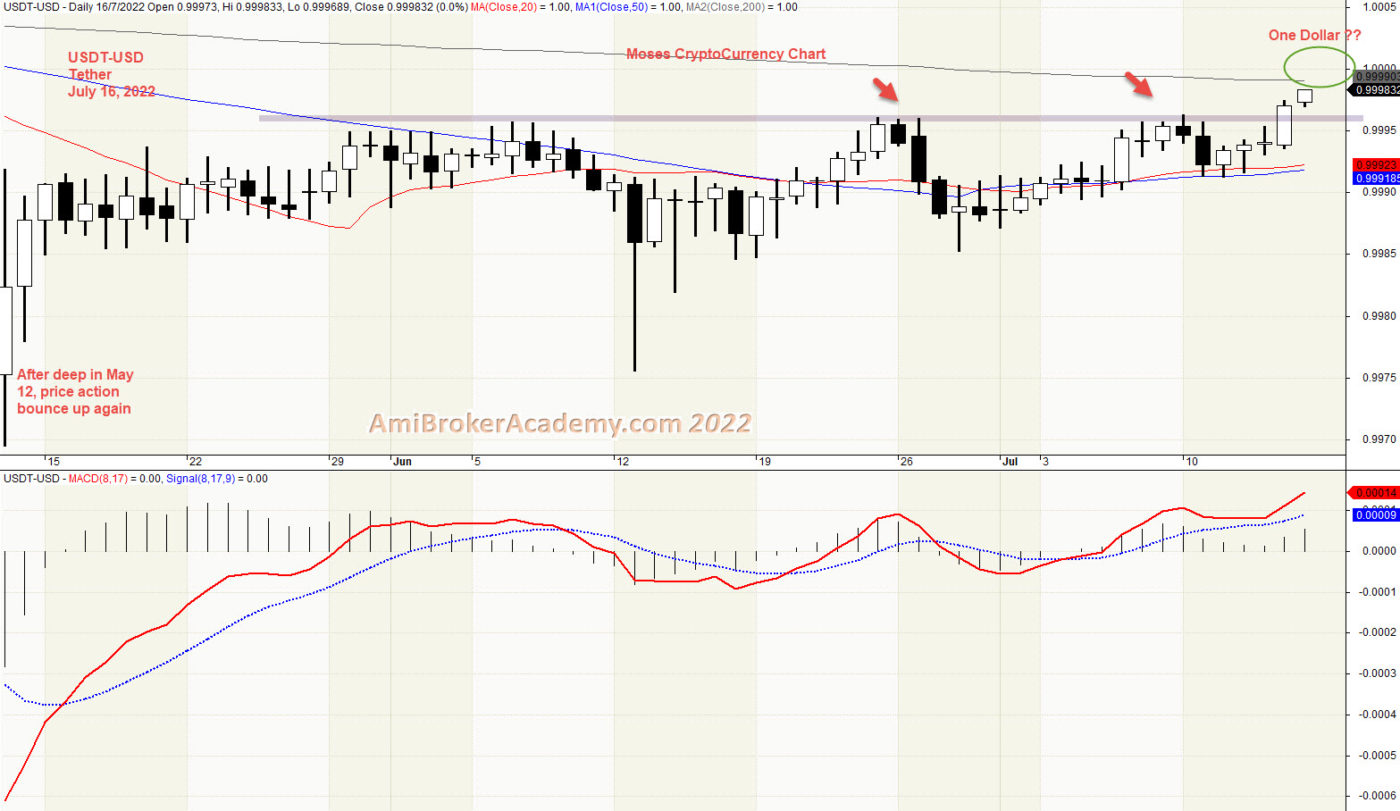
1) Tether USDT Crypto Currency and MACD
Can the price action hit One Dollar? Currently, we see price action has deep and bounce. Next we see price action resisted by the strong level below one dollar, see chart.
July 16, 2022 Tether in USD and MACD
Moses Power Charting
Official AmiBrokerAcademy.com Charting
Disclaimer
The above result is for illustration purpose. It is meant to be used for learning buy or sell signals. We do not recommend for any particular stocks. If particular stocks of such are mentioned, they are meant as a demonstration of Amibroker as a powerful charting software. Amibroker is a charting software, it can program to scan the stocks for buy and sell signals. Or backtest for any trading strategy or technique.
We post script generated signals. Not all scan results are shown here depending on selection criterial. The MACD signal should use with price action. Users must understand what MACD and price action are all about before using them. If necessary you should attend a course to learn more on Technical Analysis (TA) and Moving Average Convergence Divergence, MACD.
Once again, the website does not guarantee any results or investment return based on the information and instruction you have read here. It should be used as learning aids only and if you decide to trade real money, all trading decision should be your own.
We learn from many past and present great traders. Kudo to these master.
Price Action reflect the market emotions, it factor in news, buy or sell emotions.
When the market is bullish, how you trade you eventually still make money. When the market is sideways. You have to ride the wave on buy the bull bias and sell when it is bear.
There are a lot of uncertainty in the current market, many whom make money on crypto are liquidating now to keep themself a float.
We study the stock chart using GMMA, Woodies CCI, MACD, River, Bollinger Bands and Moving Average with the price action.
Moving Average is a great visual tool. MACD indicator is a easy to understand indicator. Support and Resistance is important and fundamental tool for trading.
When the price action continue to move higher but MACD is weaker, the price action may be change in direction. The opposite is true too, when price action is weaker, forming lower low but the MACD or MACD Histogram is forming higher low. Price action is also may be change in direction.
But remember indicator is like traffic light, it provides you a heads-up.
Manage your trade.
Think Think got more Things
In trading, some predict the up or down on the trend. Here, we look for support, strong support to buy. Or take profit when price action test the resistance.
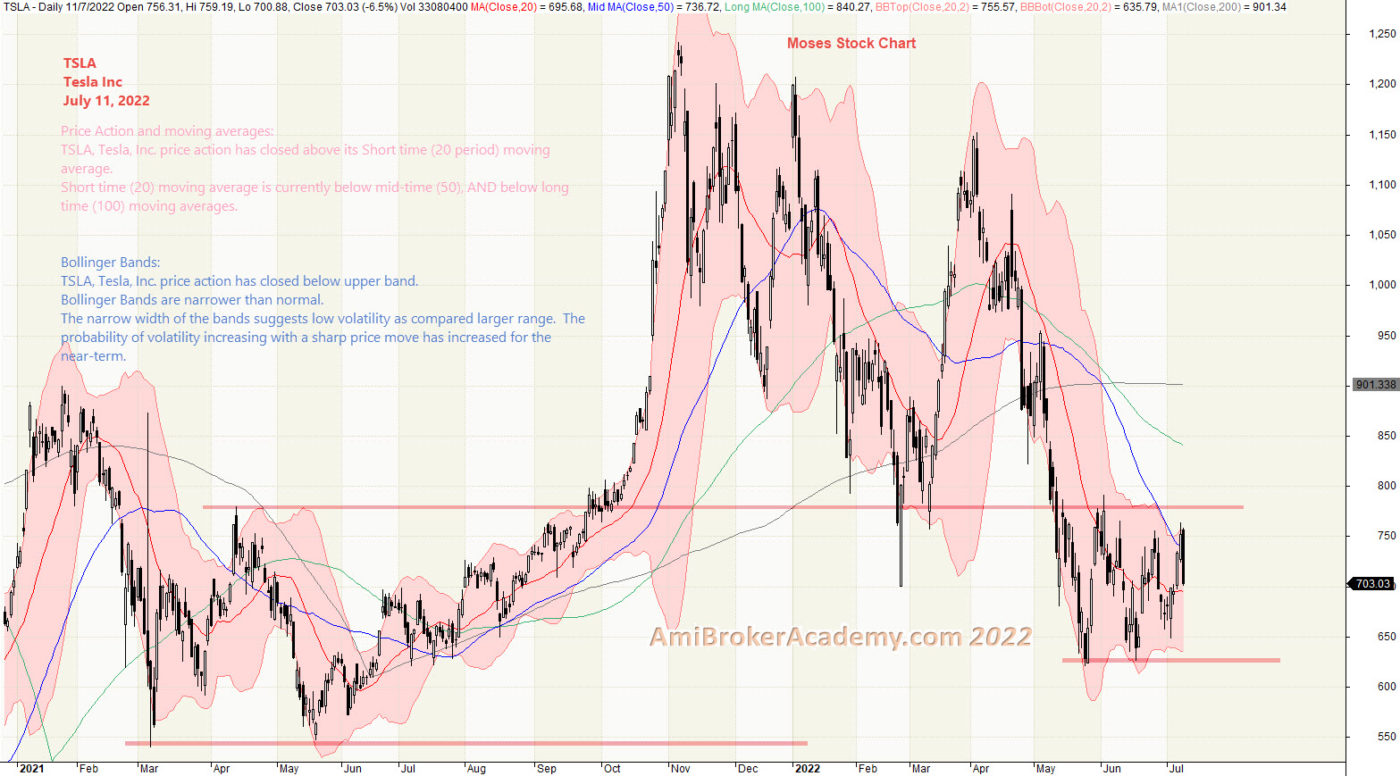
1) Tesla Inc and Bollinger Bands and Moving Averages
Price Action is enclosed within the Bollinger Bands. The bands expand and narrow. Tesla Inc’s CEO wanting to merge the company with the social media company. Why?
July 11, 2022 Tesla Inc and Bollinger Bands and Moving Averages
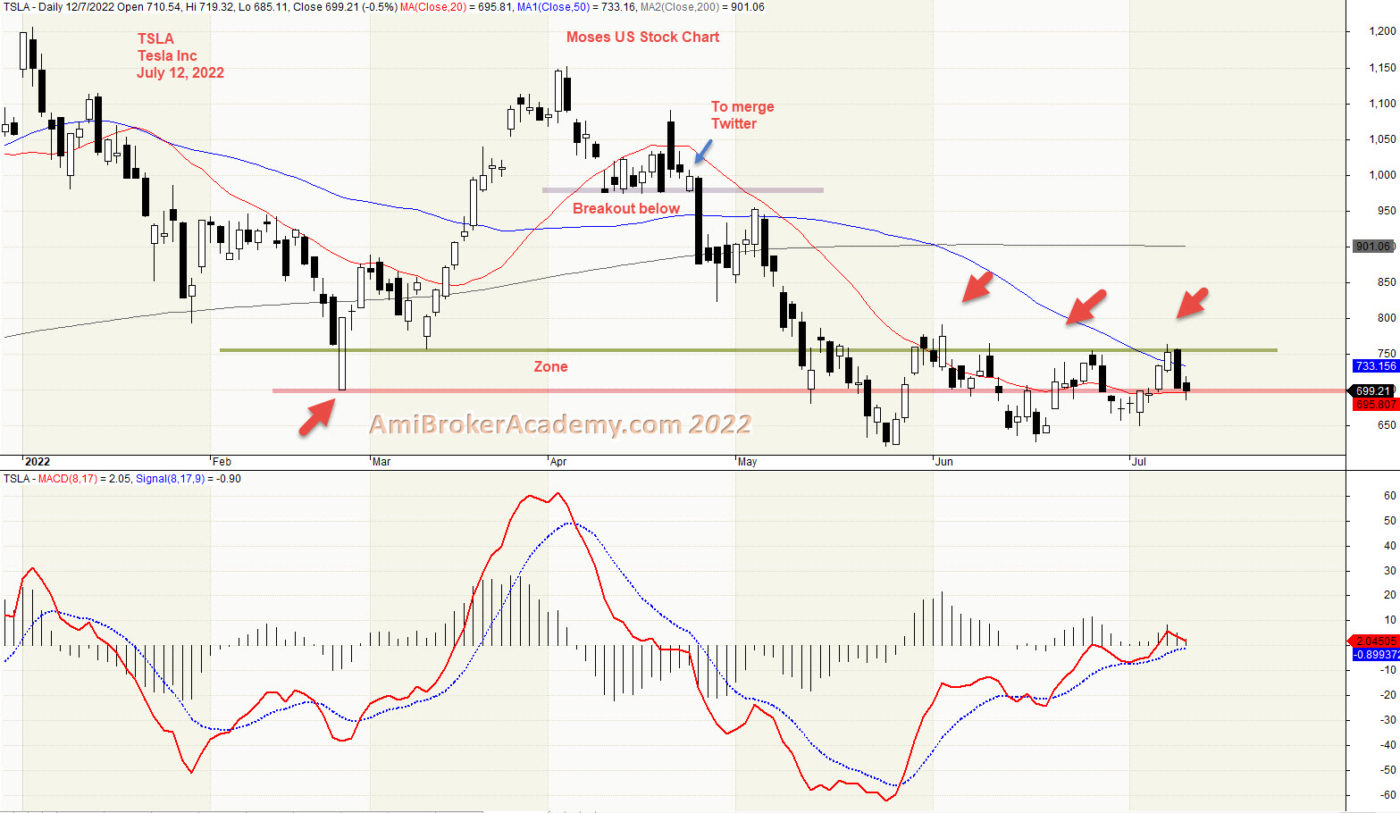
2) Tsl and MACD
Price Action breakout below after April strong level. April 25, 2022 Twitter’s board accepted billionaire Elon Musk’s offer to buy the social media company and take it private, the company confirmed.
July 12, 2022 Tesla Inc and MACD
Moses Power Charting
Official AmiBrokerAcademy.com Charting
Disclaimer
The above result is for illustration purpose. It is meant to be used for learning buy or sell signals. We do not recommend for any particular stocks. If particular stocks of such are mentioned, they are meant as a demonstration of Amibroker as a powerful charting software. Amibroker is a charting software, it can program to scan the stocks for buy and sell signals. Or backtest for any trading strategy or technique.
We post script generated signals. Not all scan results are shown here depending on selection criterial. The MACD signal should use with price action. Users must understand what MACD and price action are all about before using them. If necessary you should attend a course to learn more on Technical Analysis (TA) and Moving Average Convergence Divergence, MACD.
Once again, the website does not guarantee any results or investment return based on the information and instruction you have read here. It should be used as learning aids only and if you decide to trade real money, all trading decision should be your own.
We learn from many past and present great traders. Kudo to these master.
Price Action reflect the market emotions, it factor in news, buy or sell emotions.
When the market is bullish, how you trade you eventually still make money. When the market is sideways. You have to ride the wave on buy the bull bias and sell when it is bear.
There are a lot of uncertainty in the current market, many whom make money on crypto are liquidating now to keep themself a float.
We study the stock chart using GMMA, Woodies CCI, MACD, River, Bollinger Bands and Moving Average with the price action.
Moving Average is a great visual tool. MACD indicator is a easy to understand indicator. Support and Resistance is important and fundamental tool for trading.
When the price action continue to move higher but MACD is weaker, the price action may be change in direction. The opposite is true too, when price action is weaker, forming lower low but the MACD or MACD Histogram is forming higher low. Price action is also may be change in direction.
But remember indicator is like traffic light, it provides you a heads-up.
Manage your trade.
Think Think got more Things
In trading, some predict the up or down on the trend. Here, we look for support, strong support to buy. Or take profit when price action test the resistance.
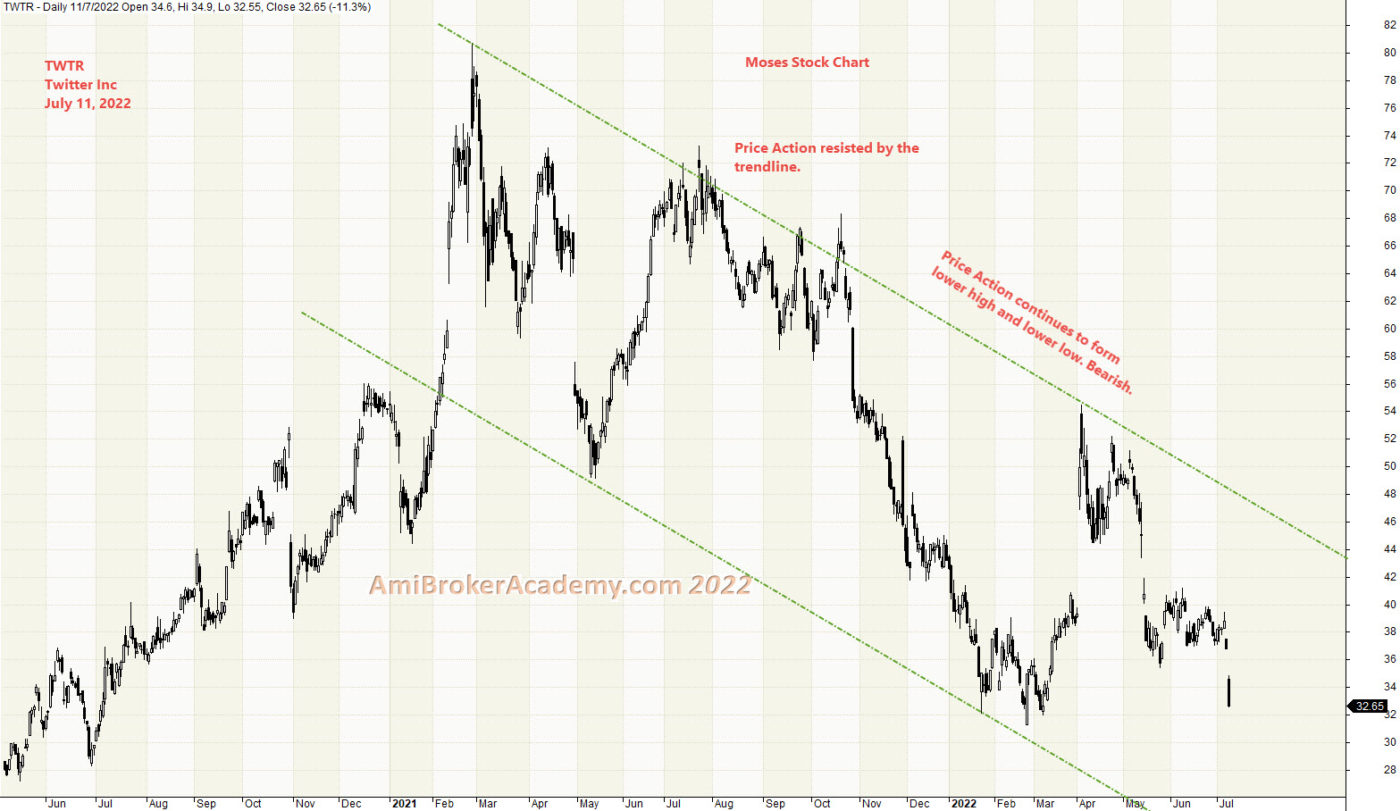
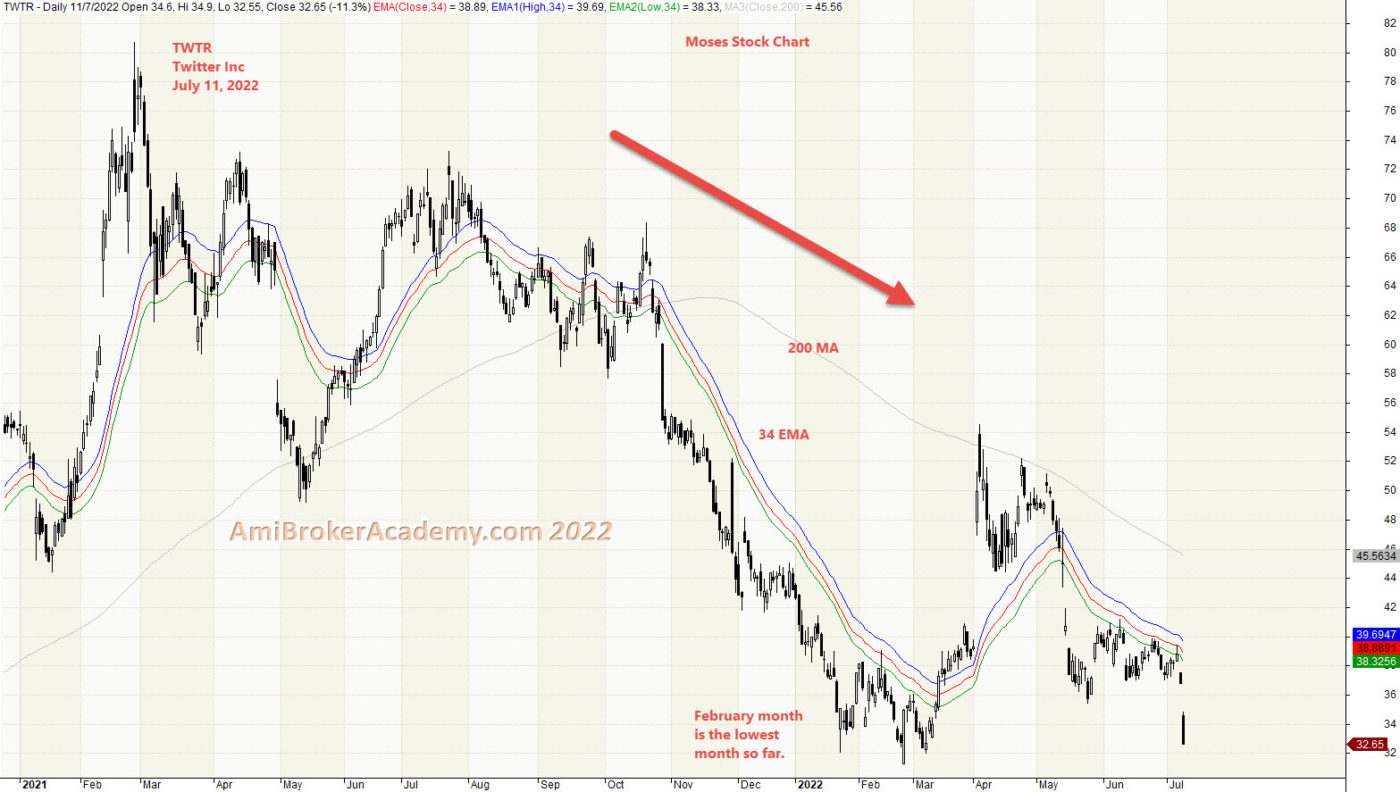
1) TWTR Twitter Inc Price Action and EDC
Put a equal distance channel on the chart from the peak, you could easily see the price action decline from 2021. Looks like the social media stock does not attract as much eye ball as before. From the chart, we can see the price action pullback to near May 2020 low. Manage your risk.
July 11, 2022 Twitter Inc and Price Action
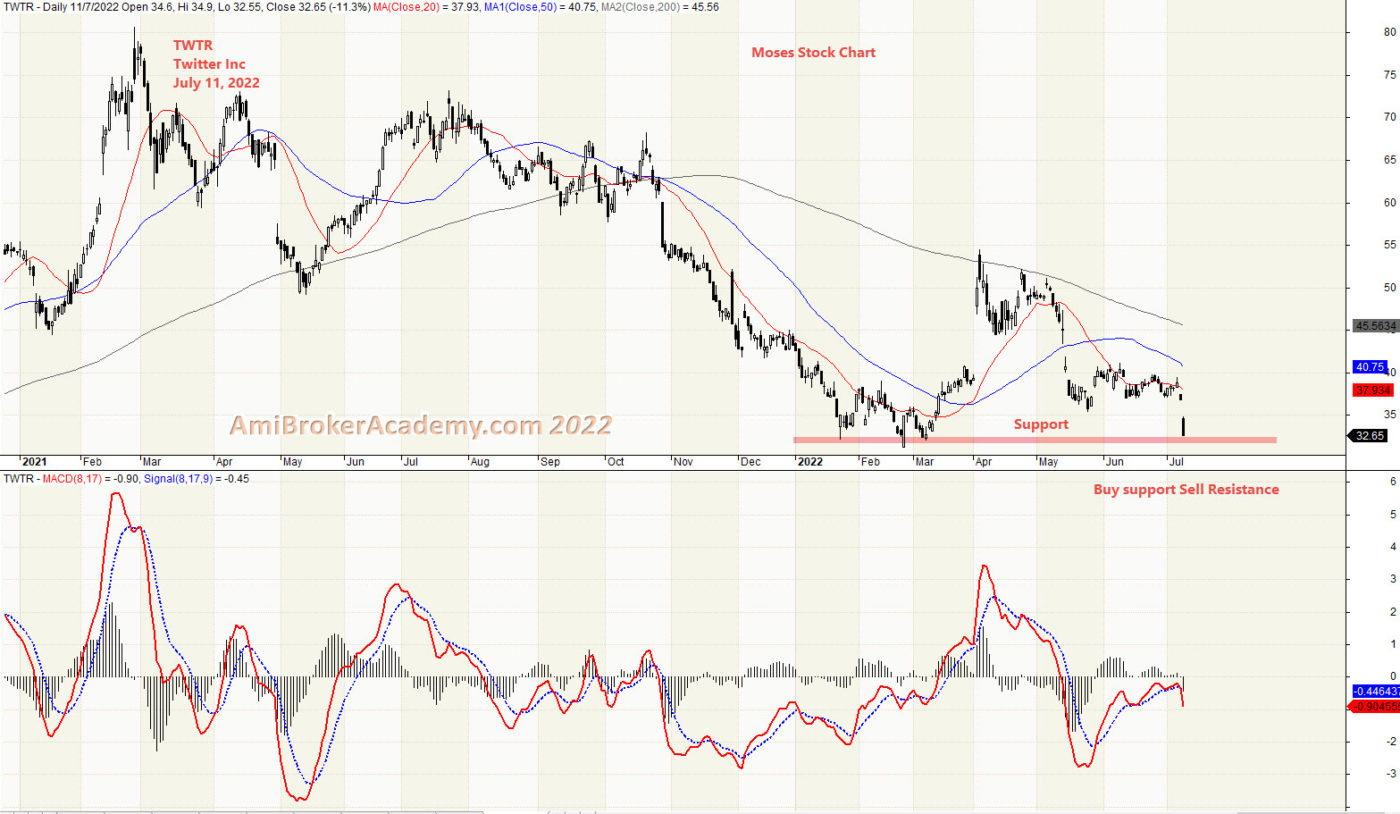
2) TWTR and MACD
Retest the support.
July 11, 2022 Twitter Inc and MACD
3) Twitter Inc and River
July 11, 2022 Twitter Inc and Moving Averages River
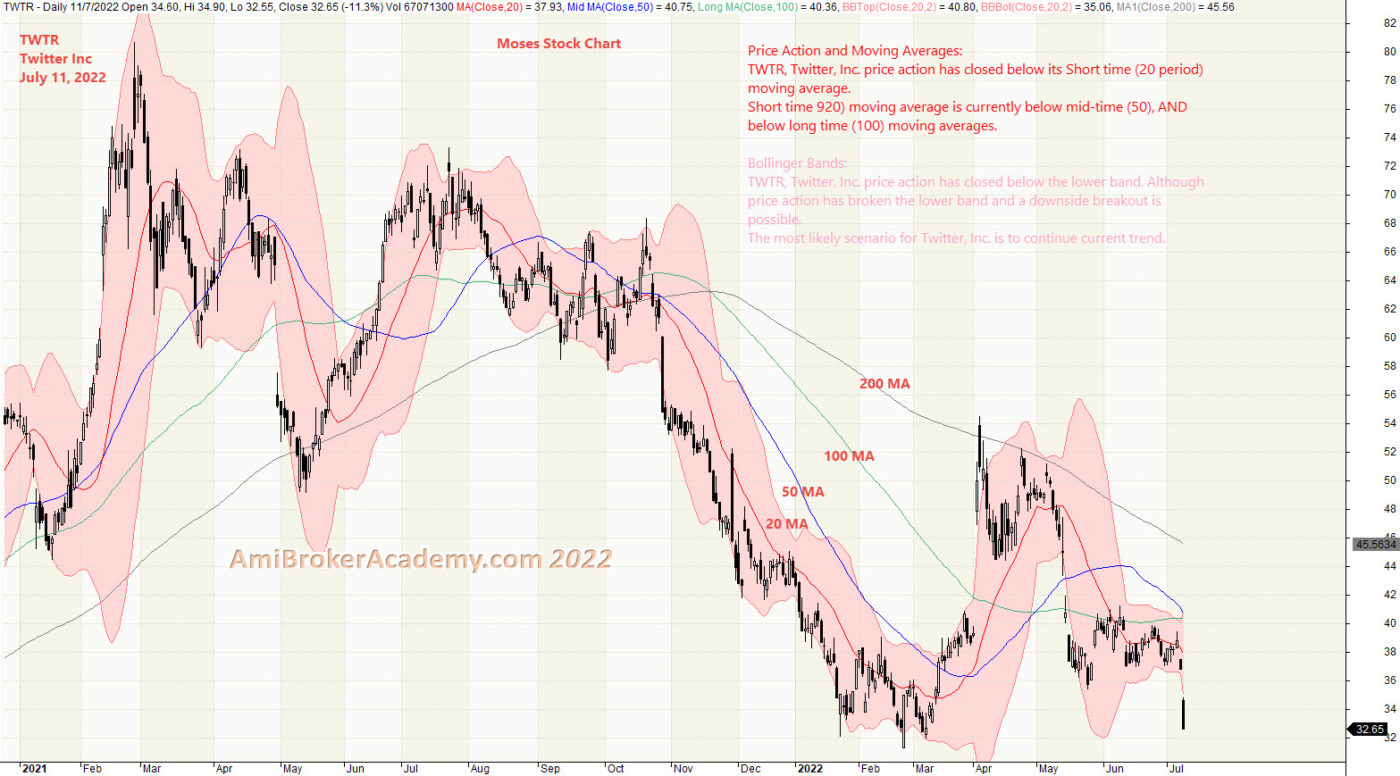
4) Twitter Inc and Bollinger Bands
See chart, price action goes from high to low. Price Action continues to form lower high and lower low. Bear trend.
July 11, 2022 Twitter Inc and Bollinger Bands
Moses Power Charting
Official AmiBrokerAcademy.com Charting
Disclaimer
The above result is for illustration purpose. It is meant to be used for learning buy or sell signals. We do not recommend for any particular stocks. If particular stocks of such are mentioned, they are meant as a demonstration of Amibroker as a powerful charting software. Amibroker is a charting software, it can program to scan the stocks for buy and sell signals. Or backtest for any trading strategy or technique.
We post script generated signals. Not all scan results are shown here depending on selection criterial. The MACD signal should use with price action. Users must understand what MACD and price action are all about before using them. If necessary you should attend a course to learn more on Technical Analysis (TA) and Moving Average Convergence Divergence, MACD.
Once again, the website does not guarantee any results or investment return based on the information and instruction you have read here. It should be used as learning aids only and if you decide to trade real money, all trading decision should be your own.
We learn from many past and present great traders. Kudo to these master.
Welcome to AmiBroker Academy dot com, amibrokeracademy.com.
If There is Only One Chart This is It
Moses Power Stock Chart.
We Believe – Buy Support or Sell Resistance.
ST Index Charts
Price Action reflect the market emotions, it factor in news, buy or sell emotions.
When the market is bullish, how you trade you eventually still make money. When the market is sideways. You have to ride the wave on buy the bull bias and sell when it is bear.
There are a lot of uncertainty in the current market, many whom make money on crypto are liquidating now to keep themself a float.
We study the stock chart using GMMA, Woodies CCI, MACD, River, Bollinger Bands and Moving Average with the price action.
Moving Average is a great visual tool. MACD indicator is a easy to understand indicator. Support and Resistance is important and fundamental tool for trading.
When the price action continue to move higher but MACD is weaker, the price action may be change in direction. The opposite is true too, when price action is weaker, forming lower low but the MACD or MACD Histogram is forming higher low. Price action is also may be change in direction.
But remember indicator is like traffic light, it provides you a heads-up.
Manage your trade.
Think Think got more Things
In trading, some predict the up or down on the trend. Here, we look for support, strong support to buy. Or take profit when price action test the resistance.
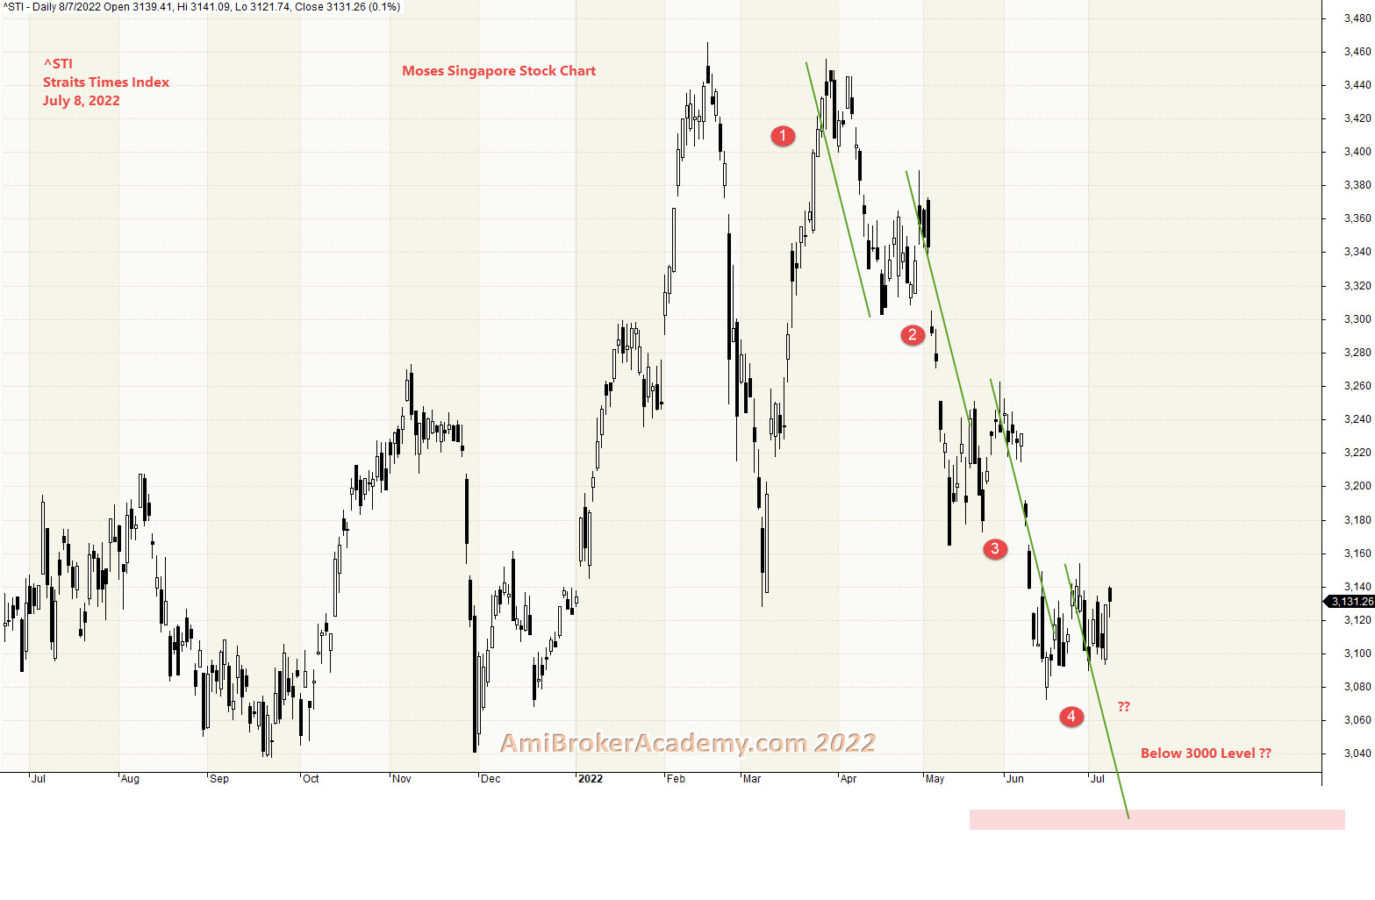
1) Straits Times Index Price Action and Wave Pattern
We see double top, there might be forming a double bottom. Will see.
July 8, 2022 Straits Times Index and Price Action and ABCD wave pattern
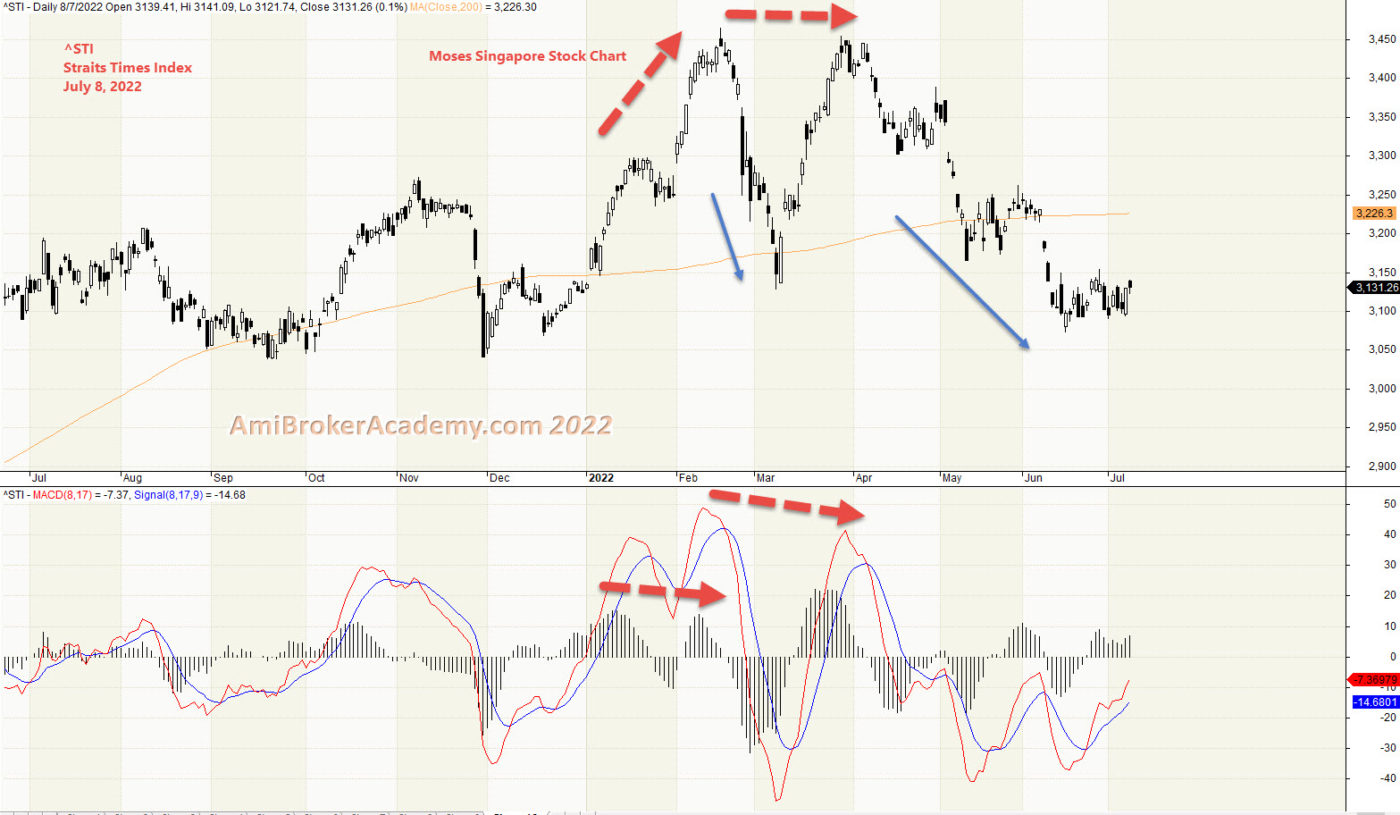
2) ST Index and MACD
July 8, 2022 ST Index and MACD
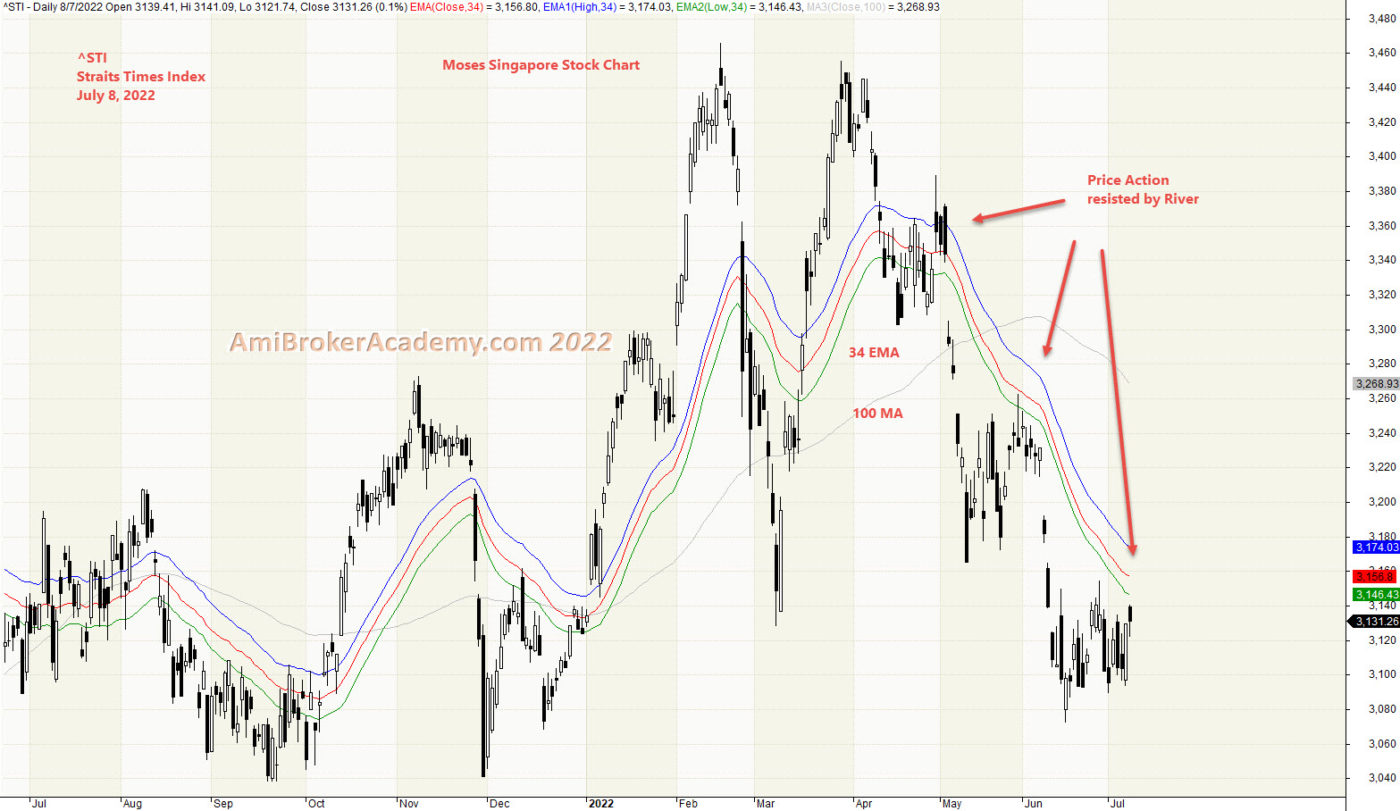
3) Straits Times Index and River
July 8, 2022 Straits Times Index and River and Wave Pattern
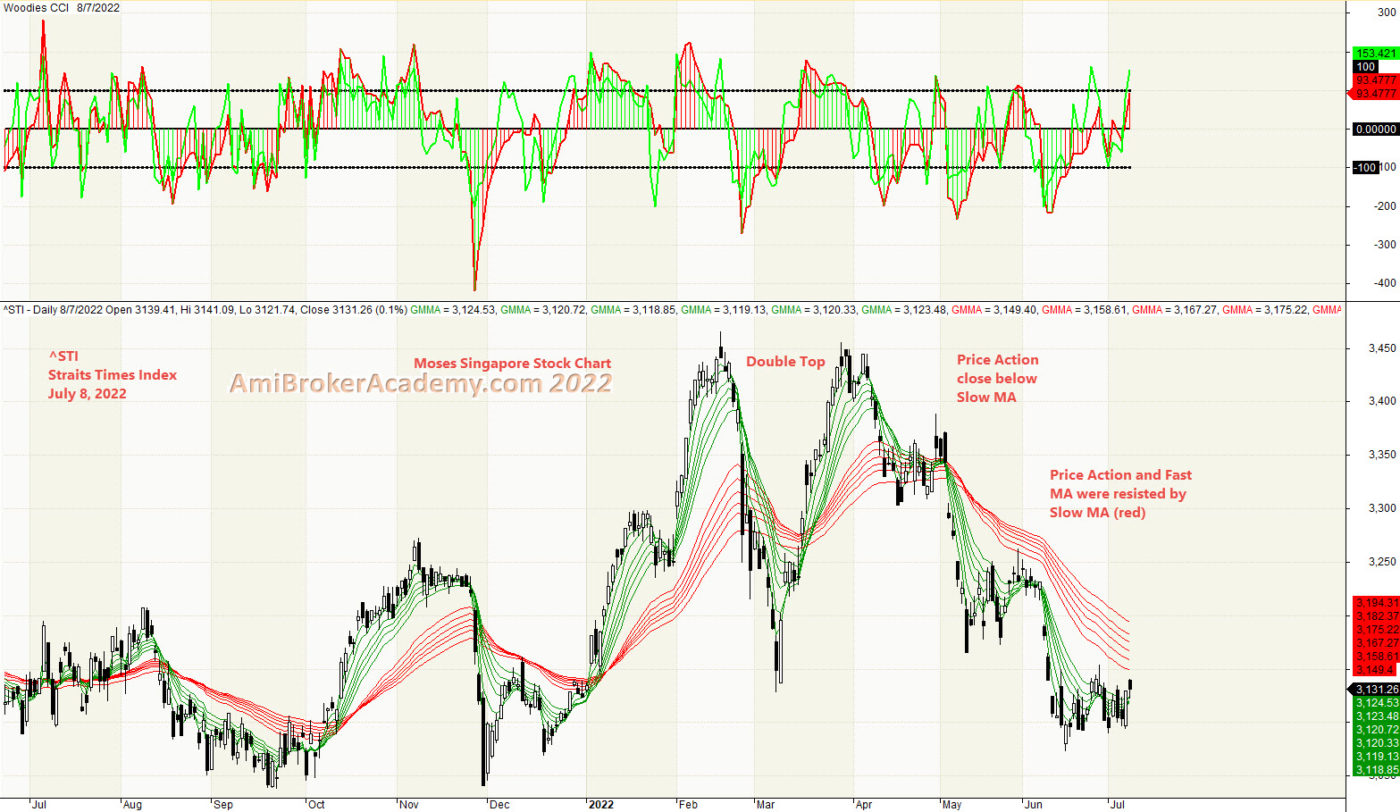
4) Straits Times Index ^STI and GMMA
See chart, price action goes from low to high and deep down and go high again, a perfect double top forms. GMMA forms a very nice pattern, slow ma (green) from below to above and deep down again. 3000 is a nice level that the index has been benchmarking.
2022 suppose to be a better year for Singapore market, but the price action has attempted twice to go higher but fail to breakout above 3400 level. Sigh.
8 July 2022 Straits Times Index and Double Top with GMMA and Woodies CCI
Moses Power Charting
Official AmiBrokerAcademy.com Charting
Disclaimer
The above result is for illustration purpose. It is meant to be used for learning buy or sell signals. We do not recommend for any particular stocks. If particular stocks of such are mentioned, they are meant as a demonstration of Amibroker as a powerful charting software. Amibroker is a charting software, it can program to scan the stocks for buy and sell signals. Or backtest for any trading strategy or technique.
We post script generated signals. Not all scan results are shown here depending on selection criterial. The MACD signal should use with price action. Users must understand what MACD and price action are all about before using them. If necessary you should attend a course to learn more on Technical Analysis (TA) and Moving Average Convergence Divergence, MACD.
Once again, the website does not guarantee any results or investment return based on the information and instruction you have read here. It should be used as learning aids only and if you decide to trade real money, all trading decision should be your own.
We learn from many past and present great traders. Kudo to these master.
Welcome to AmiBroker Academy dot com, amibrokeracademy.com.
If There is Only One Chart This is It
Moses Power Stock Chart.
We Believe – Buy Support or Sell Resistance.
000001.SS Shanghai Stock Exchange Composite Index Charting
Price Action reflect the market emotions, it factor in news, buy or sell emotions.
When the market is bullish, how you trade you eventually still make money. When the market is sideways. You have to ride the wave on buy the bull bias and sell when it is bear.
There are a lot of uncertainty in the current market, many whom make money on crypto are liquidating now to keep themself a float.
We study the stock chart using GMMA, Woodies CCI, MACD, River, Bollinger Bands and Moving Average with the price action.
Moving Average is a great visual tool. MACD indicator is a easy to understand indicator. Support and Resistance is important and fundamental tool for trading.
When the price action continue to move higher but MACD is weaker, the price action may be change in direction. The opposite is true too, when price action is weaker, forming lower low but the MACD or MACD Histogram is forming higher low. Price action is also may be change in direction.
But remember indicator is like traffic light, it provides you a heads-up.
Manage your trade.
Think Think got more Things
In trading, some predict the up or down on the trend. Here, we look for support, strong support to buy. Or take profit when price action test the resistance.
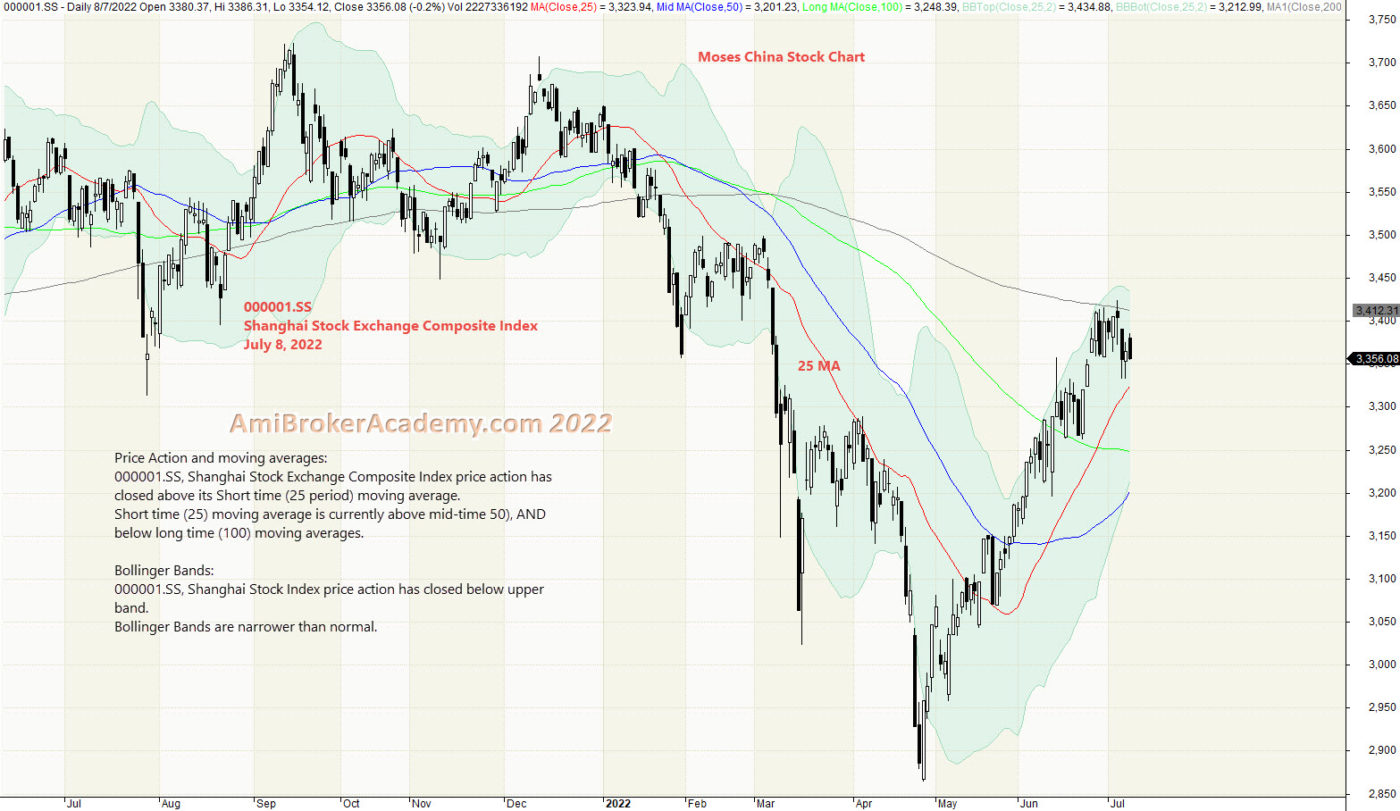
1) 000001.SS Bollinger Bands and Moving Averages
July 8, 2022 Shanghai Stock Exchange Composite Index and Bollinger Bands and Moving Average
2) 000001.SS and MACD
July 8, 2022 Shanghai Stock Exchange Composite Index and MACD
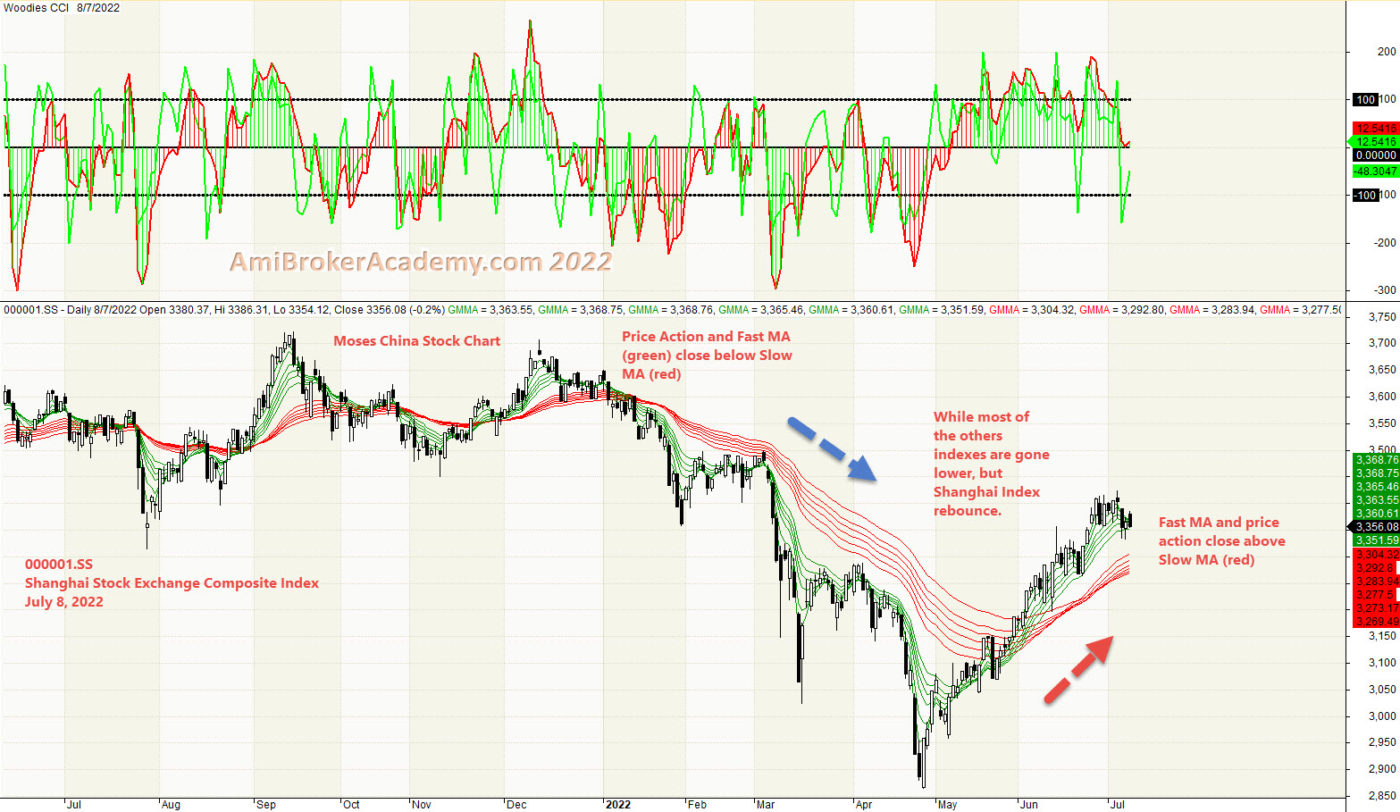
3) Shanghai Stock Exchange Composite Index and GMMA and Woodies CCI
See chart, price action goes from high to low and rebounce. GMMA forms a very nice pattern, slow ma (green) stay above the fast ma (red). and begin to stay above after June.
2022 continues 2021 trend, but after January the price action begin to deep below. April seems to be the worst from chart. Price Action begin to bounce up. But the price action is only half way now.
July 8, 2022 Shanghai Stock Exchange Composite Index and GMMA and Woodies CCI
Moses Power Charting
Official AmiBrokerAcademy.com Charting
Disclaimer
The above result is for illustration purpose. It is meant to be used for learning buy or sell signals. We do not recommend for any particular stocks. If particular stocks of such are mentioned, they are meant as a demonstration of Amibroker as a powerful charting software. Amibroker is a charting software, it can program to scan the stocks for buy and sell signals. Or backtest for any trading strategy or technique.
We post script generated signals. Not all scan results are shown here depending on selection criterial. The MACD signal should use with price action. Users must understand what MACD and price action are all about before using them. If necessary you should attend a course to learn more on Technical Analysis (TA) and Moving Average Convergence Divergence, MACD.
Once again, the website does not guarantee any results or investment return based on the information and instruction you have read here. It should be used as learning aids only and if you decide to trade real money, all trading decision should be your own.
We learn from many past and present great traders. Kudo to these master.
Welcome to AmiBroker Academy dot com, amibrokeracademy.com.
If There is Only One Chart This is It
Moses Power Stock Chart.
We Believe – Buy Support or Sell Resistance.
000001.SS
Price Action reflect the market emotions, it factor in news, buy or sell emotions.
When the market is bullish, how you trade you eventually still make money. When the market is sideways. You have to ride the wave on buy the bull bias and sell when it is bear.
There are a lot of uncertainty in the current market, many whom make money on crypto are liquidating now to keep themself a float.
We study the stock chart using GMMA, Woodies CCI, MACD, River, Bollinger Bands and Moving Average with the price action. The current posting we focus mainly on GMMA.
Moving Average is a great visual tool. MACD indicator is a easy to understand indicator. Support and Resistance is important and fundamental tool for trading.
When the price action continue to move higher but MACD is weaker, the price action may be change in direction. The opposite is true too, when price action is weaker, forming lower low but the MACD or MACD Histogram is forming higher low. Price action is also may be change in direction.
But remember indicator is like traffic light, it provides you a heads-up.
Manage your trade.
Think Think got more Things
In trading, some predict the up or down on the trend. Here, we look for support, strong support to buy. Or take profit when price action test the resistance.
1) Shanghai Stock Exchange Composite Index and GMMA and Woodies CCI
See chart, price action goes from high to low and rebounce. GMMA forms a very nice pattern, slow ma (green) stay above the fast ma (red). and begin to stay above after June.
2022 continues 2021 trend, but after January the price action begin to deep below. April seems to be the worst from chart. Price Action begin to bounce up. But the price action is only half way now.
July 8, 2022 Shanghai Stock Exchange Composite Index and GMMA and Woodies CCI
Moses Power Charting
Official AmiBrokerAcademy.com Charting
Disclaimer
The above result is for illustration purpose. It is meant to be used for learning buy or sell signals. We do not recommend for any particular stocks. If particular stocks of such are mentioned, they are meant as a demonstration of Amibroker as a powerful charting software. Amibroker is a charting software, it can program to scan the stocks for buy and sell signals. Or backtest for any trading strategy or technique.
We post script generated signals. Not all scan results are shown here depending on selection criterial. The MACD signal should use with price action. Users must understand what MACD and price action are all about before using them. If necessary you should attend a course to learn more on Technical Analysis (TA) and Moving Average Convergence Divergence, MACD.
Once again, the website does not guarantee any results or investment return based on the information and instruction you have read here. It should be used as learning aids only and if you decide to trade real money, all trading decision should be your own.
We learn from many past and present great traders. Kudo to these master.
Welcome to AmiBroker Academy dot com, amibrokeracademy.com.
If There is Only One Chart This is It
Moses Power Stock Chart.
We Believe – Buy Support or Sell Resistance.
ST Index
Price Action reflect the market emotions, it factor in news, buy or sell emotions.
When the market is bullish, how you trade you eventually still make money. When the market is sideways. You have to ride the wave on buy the bull bias and sell when it is bear.
There are a lot of uncertainty in the current market, many whom make money on crypto are liquidating now to keep themself a float.
We study the stock chart using GMMA, Woodies CCI, MACD, River, Bollinger Bands and Moving Average with the price action. The current posting we focus mainly on GMMA.
Moving Average is a great visual tool. MACD indicator is a easy to understand indicator. Support and Resistance is important and fundamental tool for trading.
When the price action continue to move higher but MACD is weaker, the price action may be change in direction. The opposite is true too, when price action is weaker, forming lower low but the MACD or MACD Histogram is forming higher low. Price action is also may be change in direction.
But remember indicator is like traffic light, it provides you a heads-up.
Manage your trade.
Think Think got more Things
In trading, some predict the up or down on the trend. Here, we look for support, strong support to buy. Or take profit when price action test the resistance.
1) Straits Times Index ^STI and GMMA
See chart, price action goes from low to high and deep down and go high again, a perfect double top forms. GMMA forms a very nice pattern, slow ma (green) from below to above and deep down again. 3000 is a nice level that the index has been benchmarking.
2022 suppose to be a better year for Singapore market, but the price action has attempted twice to go higher but fail to breakout above 3400 level. Sigh.
8 July 2022 Straits Times Index and Double Top with GMMA and Woodies CCI
Moses Power Charting
Official AmiBrokerAcademy.com Charting
Disclaimer
The above result is for illustration purpose. It is meant to be used for learning buy or sell signals. We do not recommend for any particular stocks. If particular stocks of such are mentioned, they are meant as a demonstration of Amibroker as a powerful charting software. Amibroker is a charting software, it can program to scan the stocks for buy and sell signals. Or backtest for any trading strategy or technique.
We post script generated signals. Not all scan results are shown here depending on selection criterial. The MACD signal should use with price action. Users must understand what MACD and price action are all about before using them. If necessary you should attend a course to learn more on Technical Analysis (TA) and Moving Average Convergence Divergence, MACD.
Once again, the website does not guarantee any results or investment return based on the information and instruction you have read here. It should be used as learning aids only and if you decide to trade real money, all trading decision should be your own.
We learn from many past and present great traders. Kudo to these master.
Welcome to AmiBroker Academy dot com, amibrokeracademy.com.
If There is Only One Chart This is It
Moses Power Stock Chart.
We Believe – Buy Support or Sell Resistance.
BEL 20 Charting
Price Action reflect the market emotions, it factor in news, buy or sell emotions.
When the market is bullish, how you trade you eventually still make money. When the market is sideways. You have to ride the wave on buy the bull bias and sell when it is bear.
There are a lot of uncertainty in the current market, many whom make money on crypto are liquidating now to keep themself a float.
In our last posting, you study the BEL 20 Index using GMMA, Woodies CCI, MACD, River, Bollinger Bands and Moving Average with the price action. The current posting we focus mainly on support resistance.
Moving Average is a great visual tool. MACD indicator is a easy to understand indicator. Support and Resistance is important and fundamental tool for trading.
When the price action continue to move higher but MACD is weaker, the price action may be change in direction. The opposite is true too, when price action is weaker, forming lower low but the MACD or MACD Histogram is forming higher low. Price action is also may be change in direction.
But remember indicator is like traffic light, it provides you a heads-up.
Manage your trade.
Think Think got more Things
In trading, some predict the up or down on the trend. Here, we look for support, strong support to buy. Or take profit when price action test the resistance.
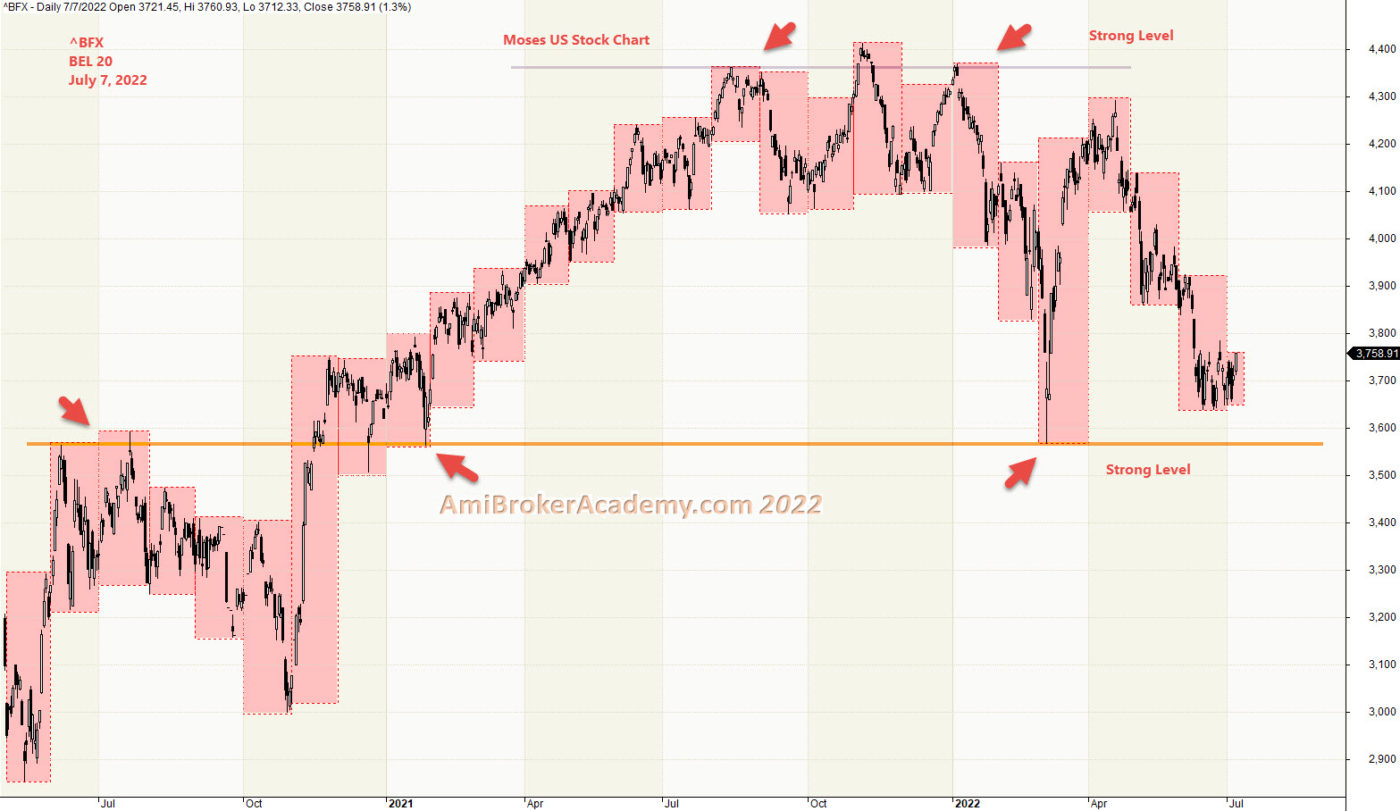
1) BEL 20 ^BFX and Month High Low
See chart, with the boxes, it is very easy for you to find the strong level, or Support Resistance. The following chart is a twenty four months chart. Price Action is now drawn to a strong level. near support. Manage your risk.
Moses Power Charting
Official AmiBrokerAcademy.com Charting
Disclaimer
The above result is for illustration purpose. It is meant to be used for learning buy or sell signals. We do not recommend for any particular stocks. If particular stocks of such are mentioned, they are meant as a demonstration of Amibroker as a powerful charting software. Amibroker is a charting software, it can program to scan the stocks for buy and sell signals. Or backtest for any trading strategy or technique.
We post script generated signals. Not all scan results are shown here depending on selection criterial. The MACD signal should use with price action. Users must understand what MACD and price action are all about before using them. If necessary you should attend a course to learn more on Technical Analysis (TA) and Moving Average Convergence Divergence, MACD.
Once again, the website does not guarantee any results or investment return based on the information and instruction you have read here. It should be used as learning aids only and if you decide to trade real money, all trading decision should be your own.
We learn from many past and present great traders. Kudo to these master.
Welcome to AmiBroker Academy dot com, amibrokeracademy.com.
If There is Only One Chart This is It
Moses Power Stock Chart.
We Believe – Buy Support or Sell Resistance.
BEL 20 Charting
Price Action reflect the market emotions, it factor in news, buy or sell emotions.
When the market is bullish, how you trade you eventually still make money. When the market is sideways. You have to ride the wave on buy the bull bias and sell when it is bear.
There are a lot of uncertainty in the current market, many whom make money on crypto are liquidating now to keep themself a float.
Moving Average is a great visual tool. MACD indicator is a easy to understand indicator. Support and Resistance is important and fundamental tool for trading.
When the price action continue to move higher but MACD is weaker, the price action may be change in direction. The opposite is true too, when price action is weaker, forming lower low but the MACD or MACD Histogram is forming higher low. Price action is also may be change in direction.
But remember indicator is like traffic light, it provides you a heads-up.
Manage your trade.
Think Think got more Things
In trading, some predict the up or down on the trend. Here, we look for support, strong support to buy. Or take profit when price action test the resistance.
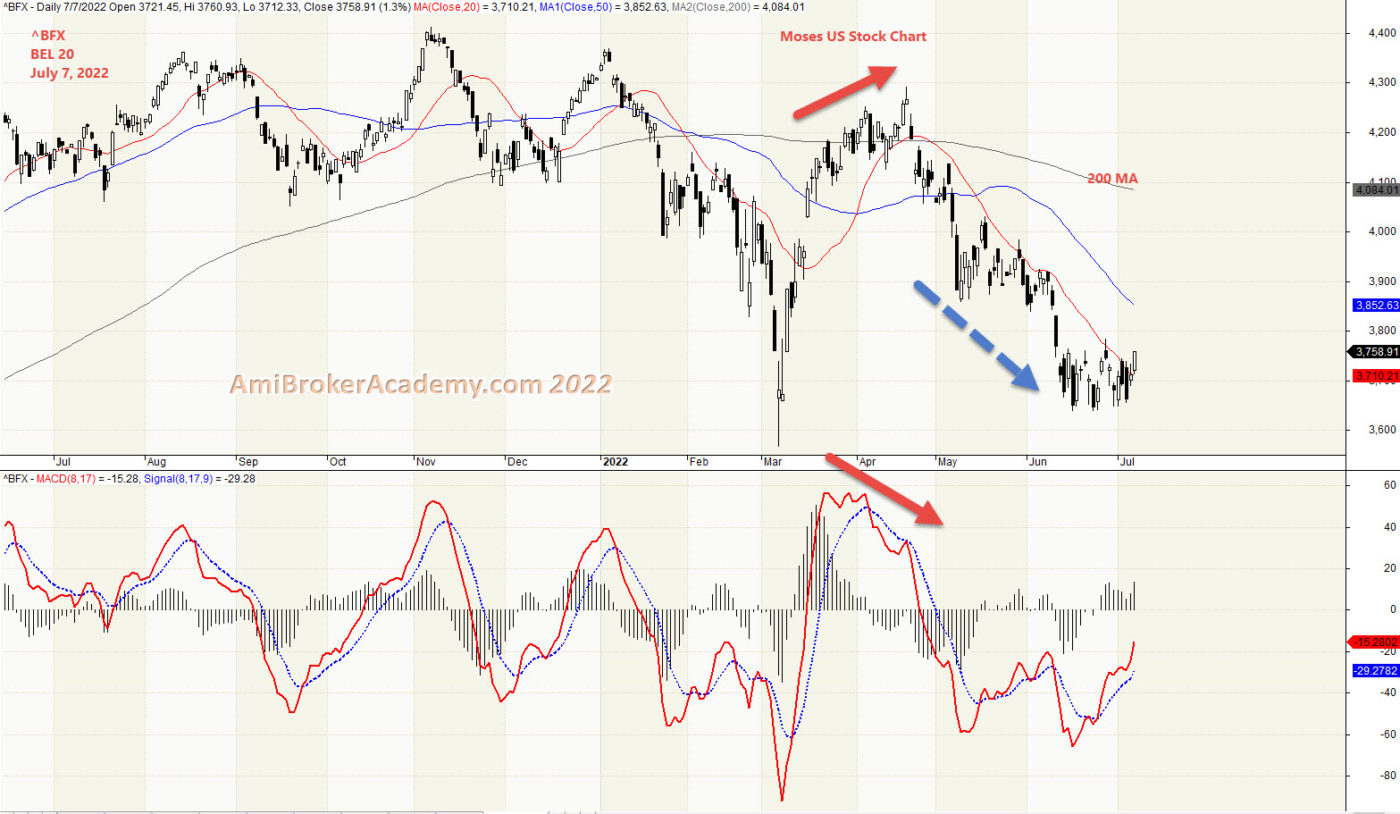
1) BEL 20 ^BFX and MACD
20220707 BEL 20 and MACD
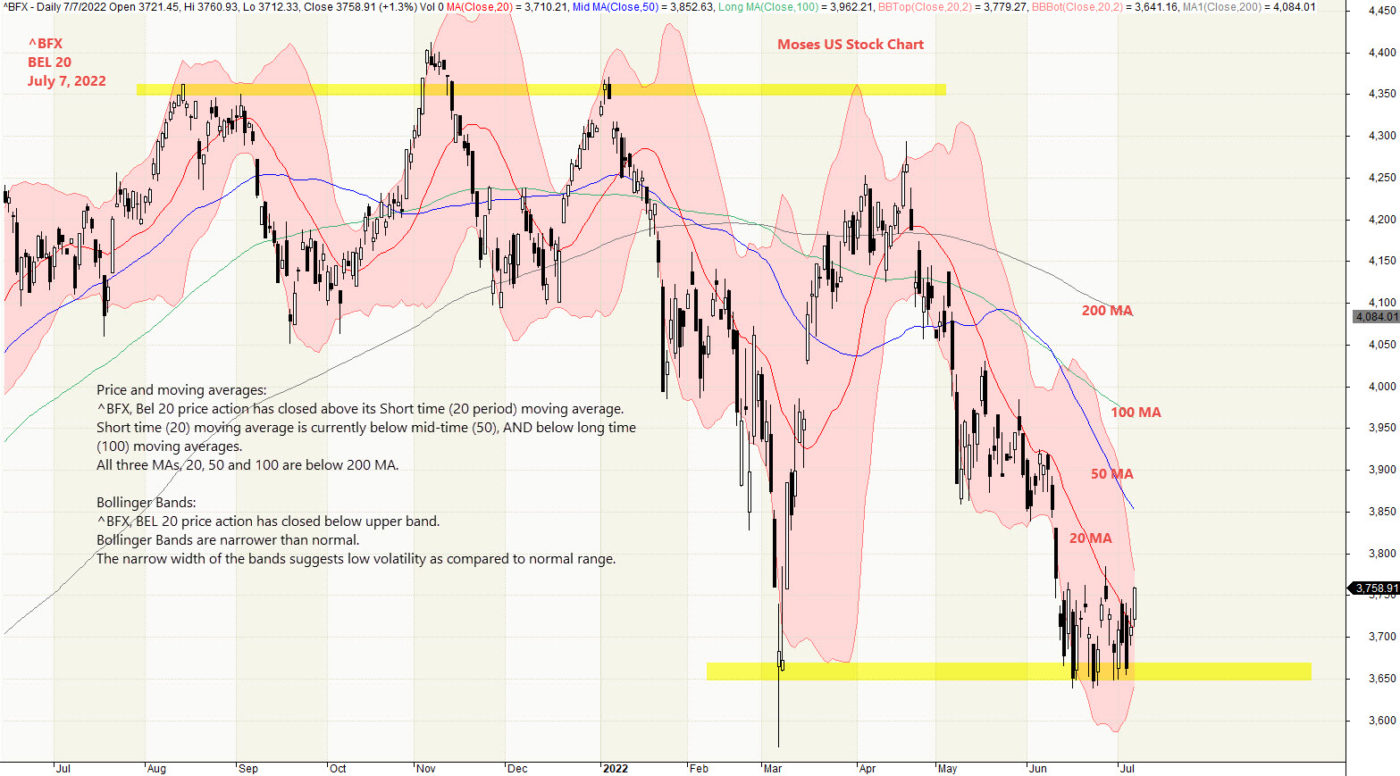
2) ^BFX Bollinger Bands and Moving Averages
2022 July 7 BEL 20 ^BFX and Bollinger Bands and Moving Averages
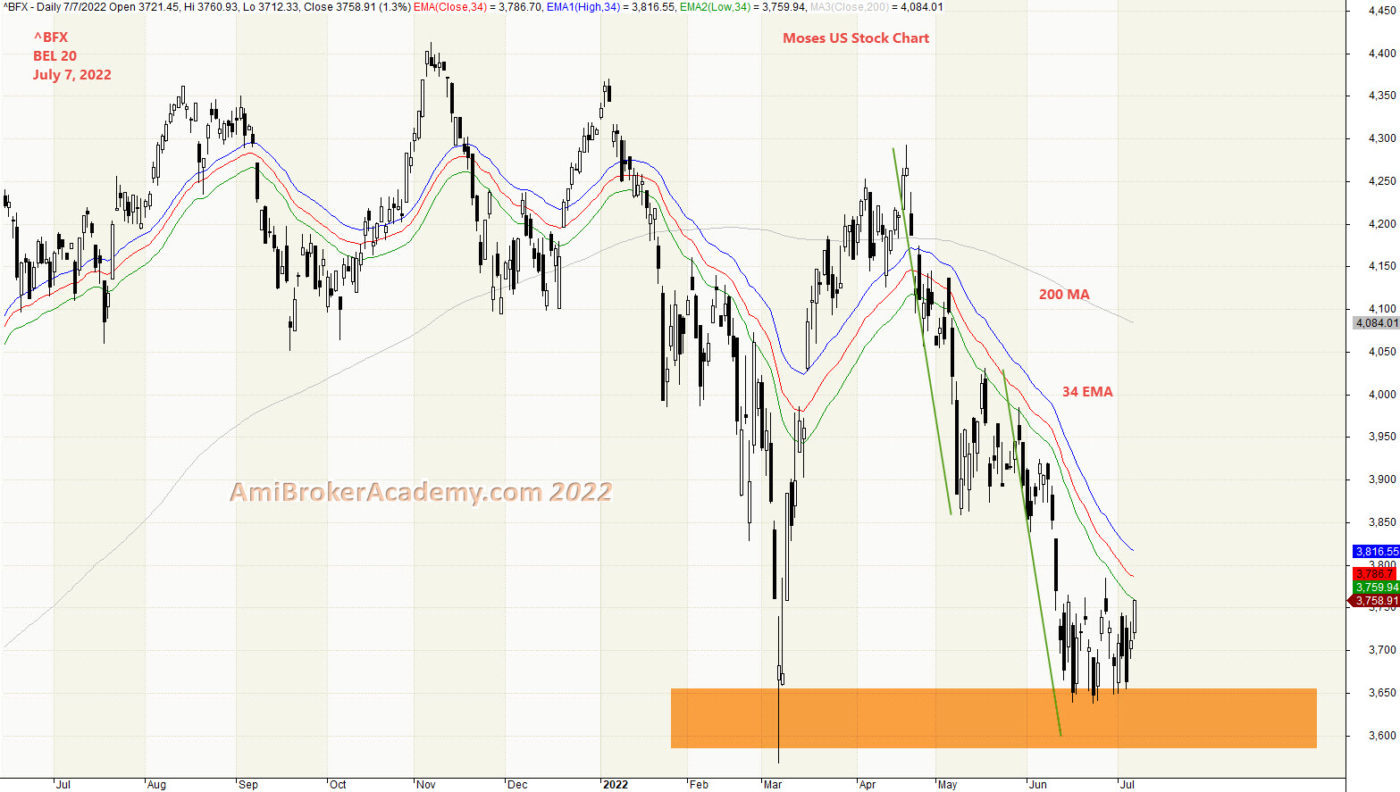
3) ^BFX BEL 20 and River
Double bottom?
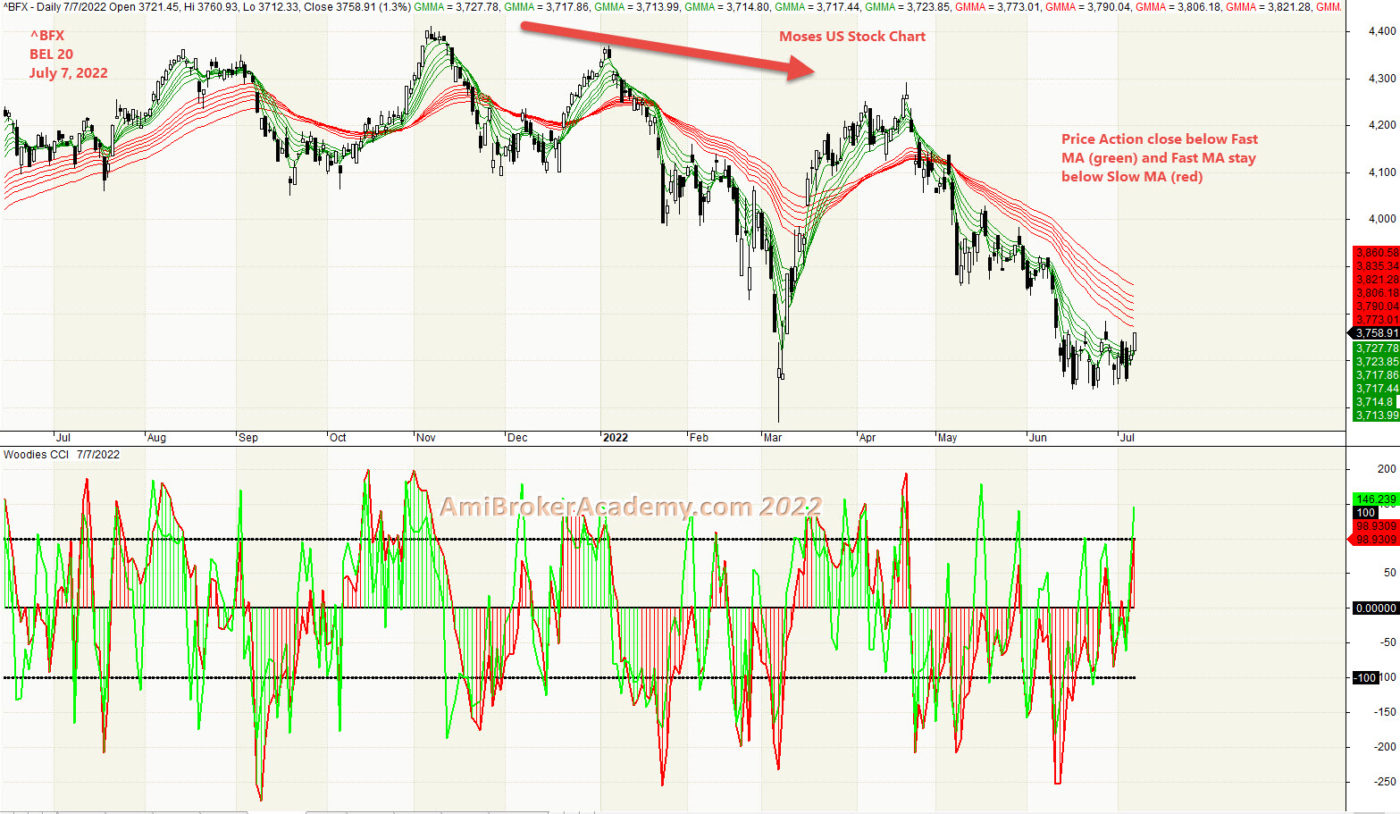
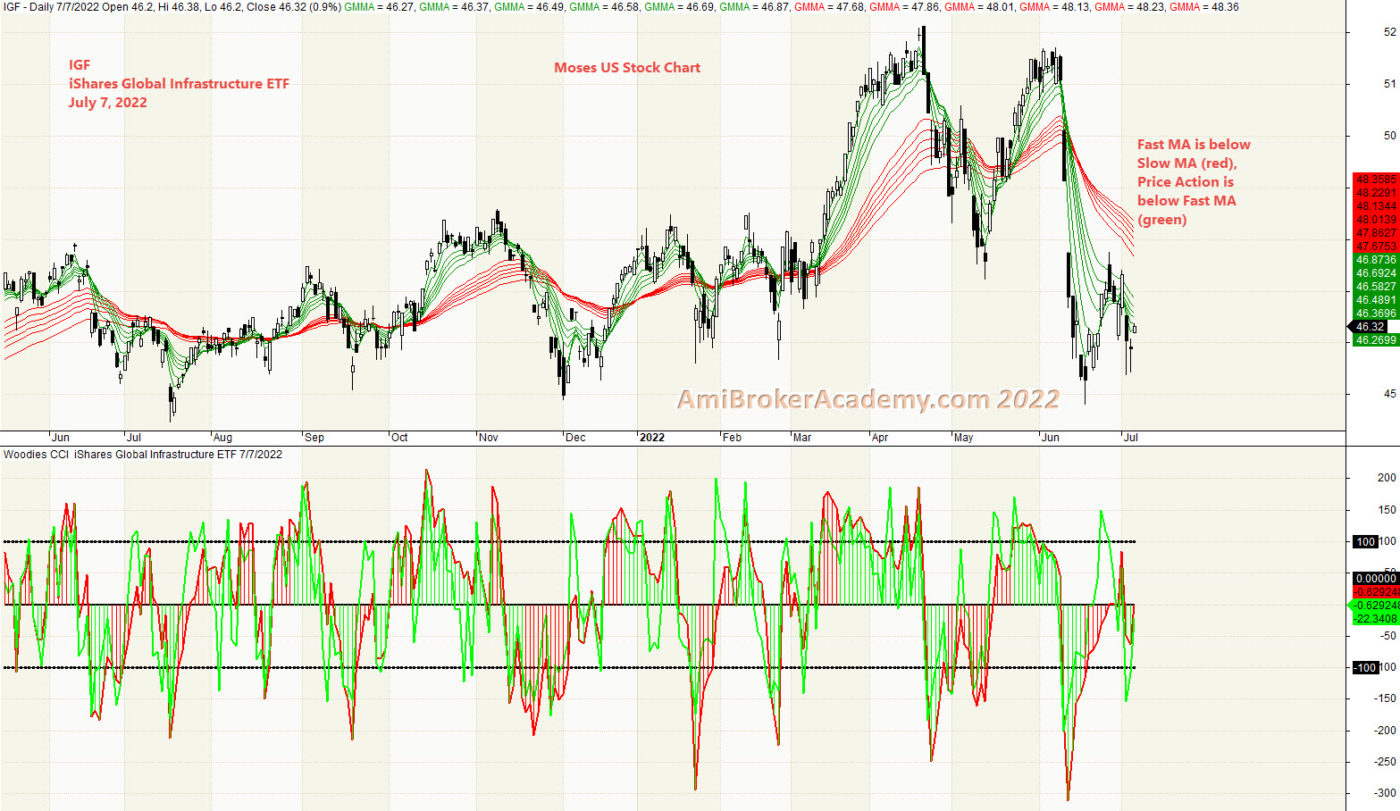
4) iShares Global Infrastructure ETF and GMMA and Woodies CCI
July 7, 2022 BEL 20 and GMMA and Woodies CCI
Moses Power Charting
Official AmiBrokerAcademy.com Charting
Disclaimer
The above result is for illustration purpose. It is meant to be used for learning buy or sell signals. We do not recommend for any particular stocks. If particular stocks of such are mentioned, they are meant as a demonstration of Amibroker as a powerful charting software. Amibroker is a charting software, it can program to scan the stocks for buy and sell signals. Or backtest for any trading strategy or technique.
We post script generated signals. Not all scan results are shown here depending on selection criterial. The MACD signal should use with price action. Users must understand what MACD and price action are all about before using them. If necessary you should attend a course to learn more on Technical Analysis (TA) and Moving Average Convergence Divergence, MACD.
Once again, the website does not guarantee any results or investment return based on the information and instruction you have read here. It should be used as learning aids only and if you decide to trade real money, all trading decision should be your own.
We learn from many past and present great traders. Kudo to these master.
Welcome to AmiBroker Academy dot com, amibrokeracademy.com.
If There is Only One Chart This is It
Moses Power Stock Chart.
We Believe – Buy Support or Sell Resistance.
iShares Global Infrastructure ETF
Price Action reflect the market emotions, it factor in news, buy or sell emotions.
When the market is bullish, how you trade you eventually still make money. When the market is sideways. You have to ride the wave on buy the bull bias and sell when it is bear.
There are a lot of uncertainty in the current market, many whom make money on crypto are liquidating to keep a float.
Moving Average is a great visual tool. MACD indicator is a easy to understand indicator. Support and Resistance is important and fundamental tool for trading.
When the price action continue to move higher but MACD is weaker, the price action may be change in direction. The opposite is true too, when price action is weaker, forming lower low but the MACD or MACD Histogram is forming higher low. Price action is also may be change in direction.
Manage your trade.
Think Think got more Things
In trading, some predict the up or down on the trend. Here, we look for support, strong support to buy. Or take profit when price action test the resistance.
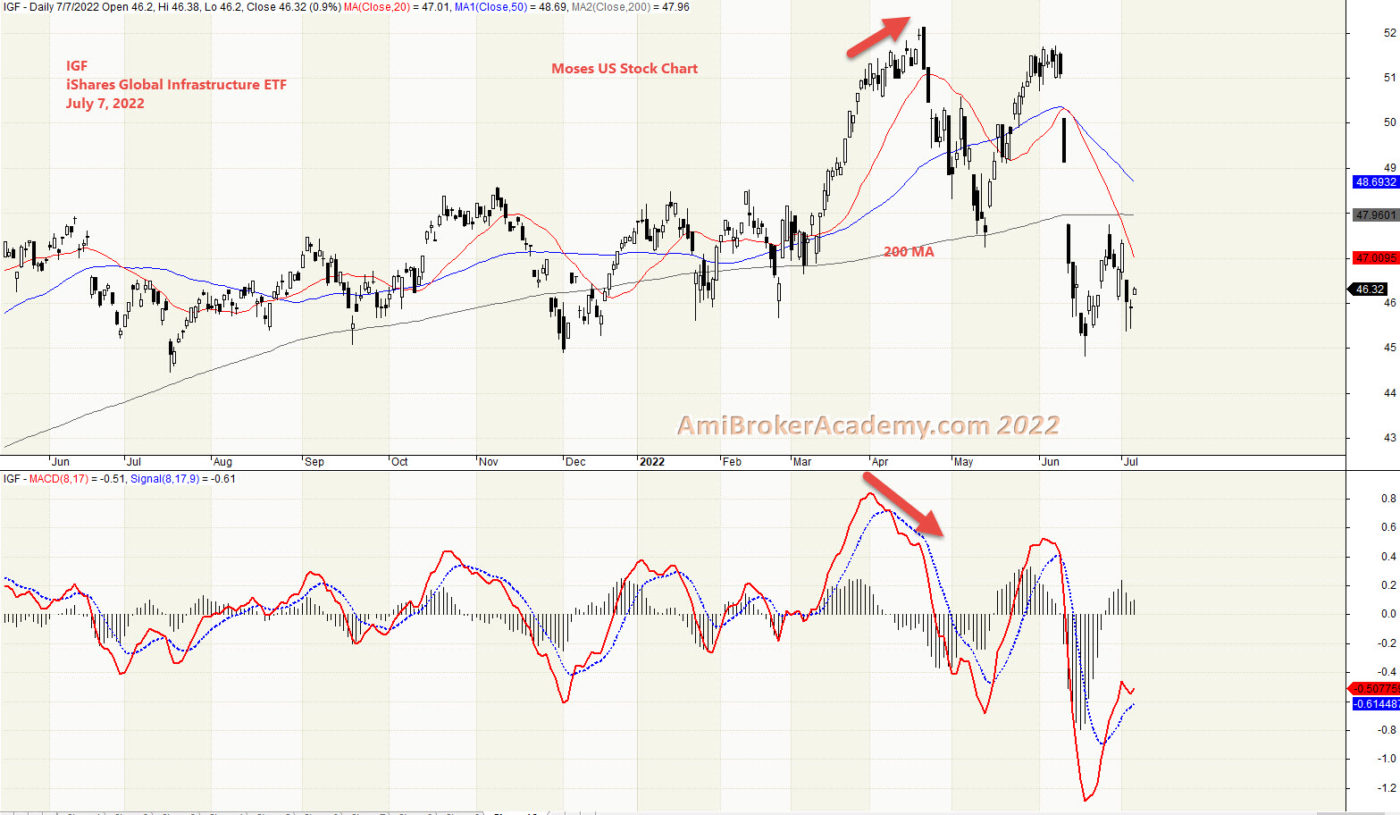
1) iShares Global Infrastructure ETF and MACD
20220707 iShares Global Infrastructure ETF and MACD and MACD Divergence
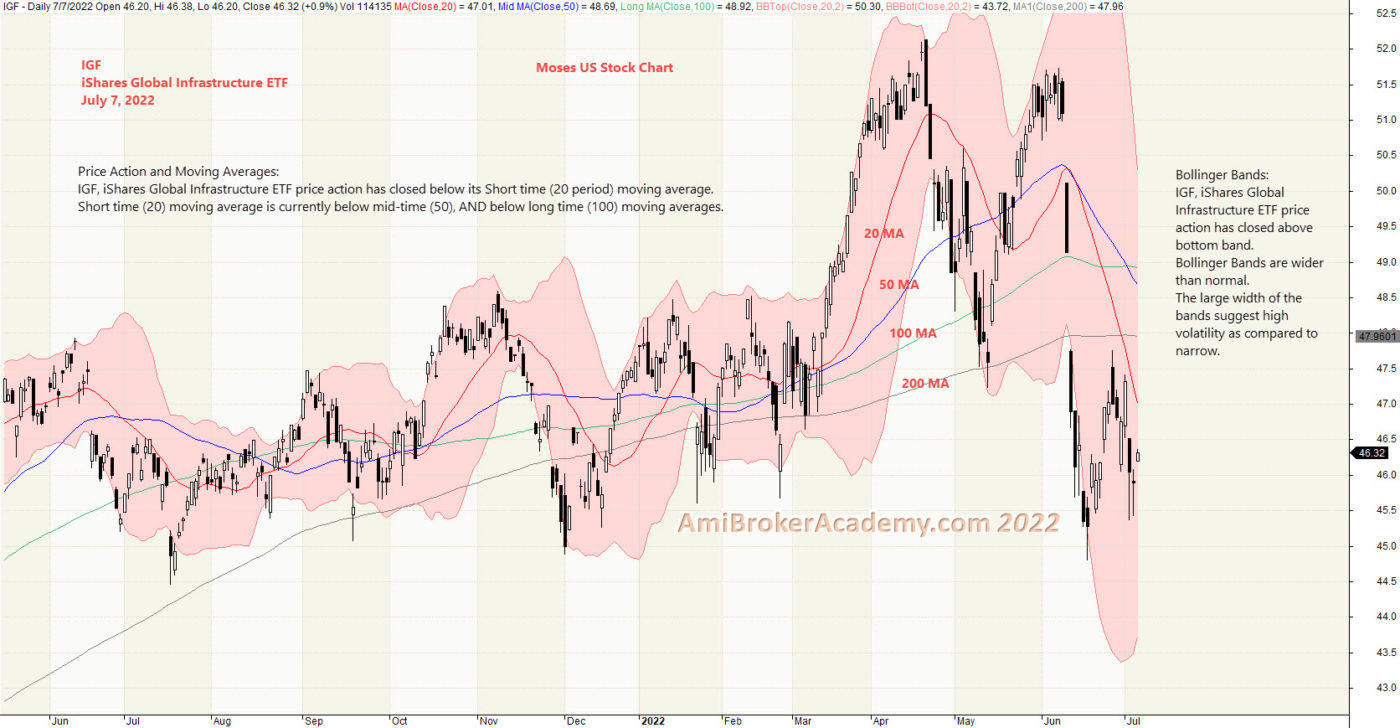
2) iShares Global Infrastructure ETF and Bollinger Bands and Moving Averages
20220707 iShares Global Infrastructure ETF and Bollinger Bands and Moving Averages
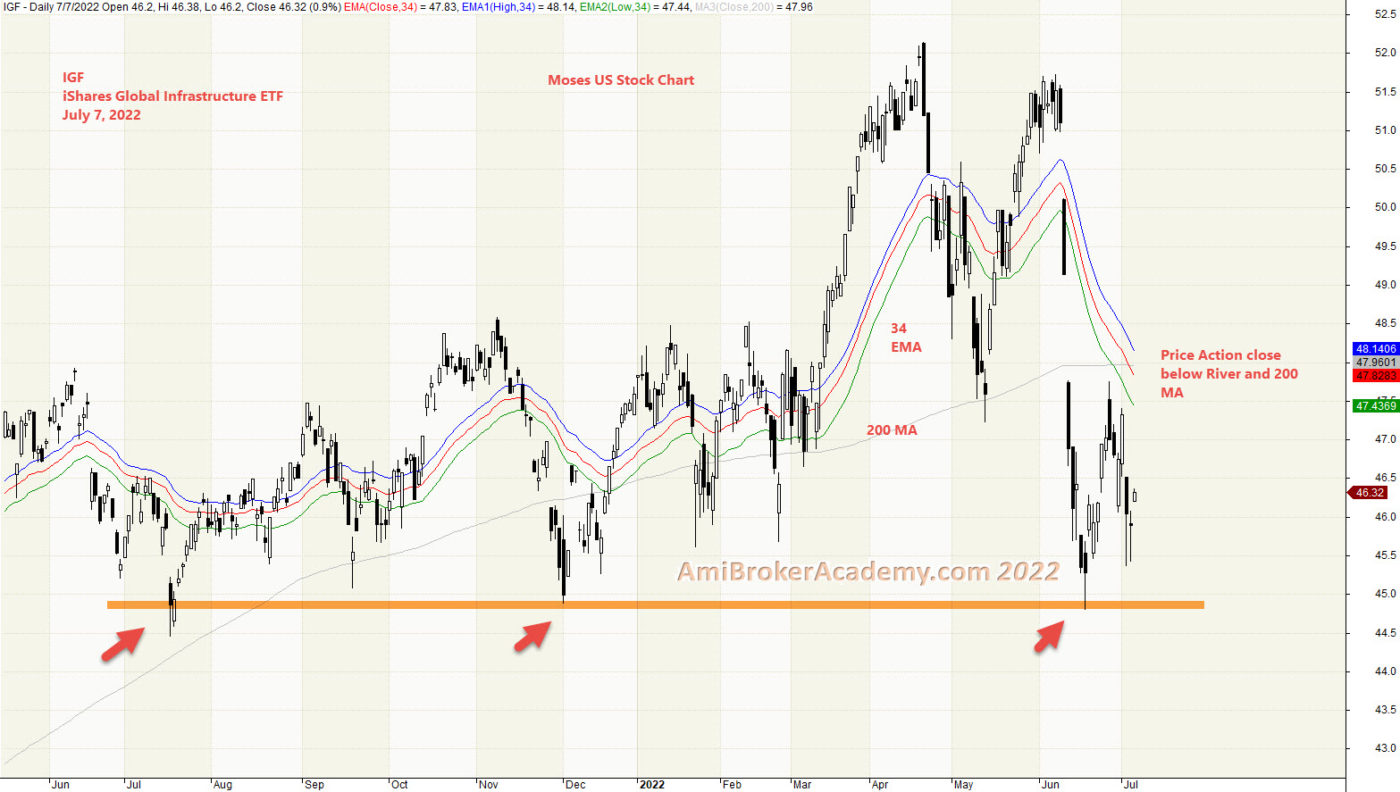
3) iShares Global Infrastructure ETF and River
20220707 iShares Global Infrastructure ETF and River
4) iShares Global Infrastructure ETF and GMMA and Woodies CCI
20220707 iShares Global Infrastructure ETF and GMMA and Woodies CCI
Moses Power Charting
Official AmiBrokerAcademy.com Charting
Disclaimer
The above result is for illustration purpose. It is meant to be used for learning buy or sell signals. We do not recommend for any particular stocks. If particular stocks of such are mentioned, they are meant as a demonstration of Amibroker as a powerful charting software. Amibroker is a charting software, it can program to scan the stocks for buy and sell signals. Or backtest for any trading strategy or technique.
We post script generated signals. Not all scan results are shown here depending on selection criterial. The MACD signal should use with price action. Users must understand what MACD and price action are all about before using them. If necessary you should attend a course to learn more on Technical Analysis (TA) and Moving Average Convergence Divergence, MACD.
Once again, the website does not guarantee any results or investment return based on the information and instruction you have read here. It should be used as learning aids only and if you decide to trade real money, all trading decision should be your own.
We learn from many past and present great traders. Kudo to these master.
Welcome to AmiBroker Academy dot com, amibrokeracademy.com.
If There is Only One Chart This is It
Moses Power Stock Chart.
We Believe – Buy Support or Sell Resistance.
1) S59 SIA Engineering Company
Price Action reflect the market emotions, it factor in news, buy or sell emotions.
When the market is bullish, how you trade you eventually still make money. When the market is sideways. You have to ride the wave on buy the bull bias and sell when it is bear.
There are a lot of uncertainty in the current market, many whom make money on crypto are liquidating to keep a float.
Moving Average is a great visual tool. MACD indicator is a easy to understand indicator. Support and Resistance is important and fundamental tool for trading.
When the price action continue to move higher but MACD is weaker, the price action may be change in direction. The opposite is true too, when price action is weaker, forming lower low but the MACD or MACD Histogram is forming higher low. Price action is also may be change in direction.
Manage your trade.
Think Think got more Things
In trading, some predict the up or down on the trend. Here, we look for support, strong support to buy. Or take profit when price action test the resistance.
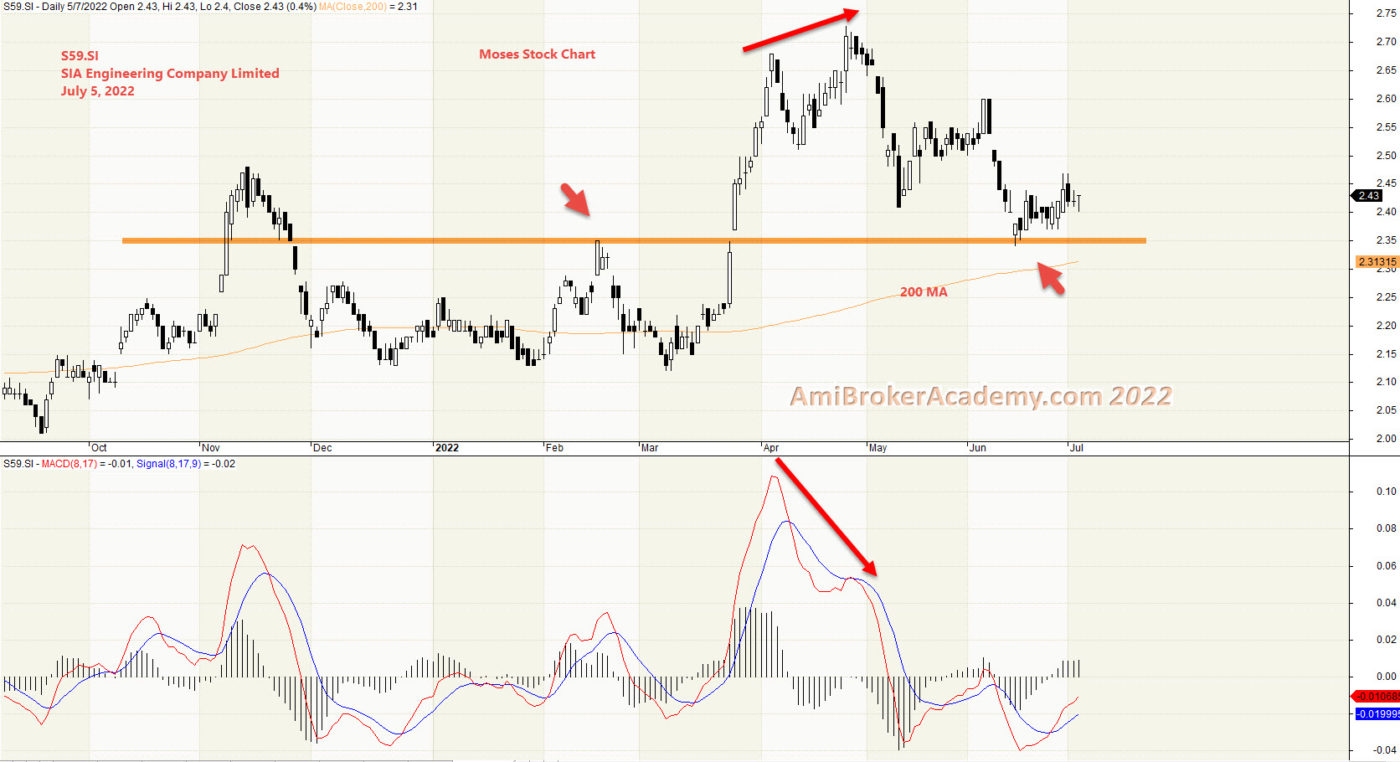
SIA Engineering Company and MACD
20220705 SIA Engineering Company and MACD
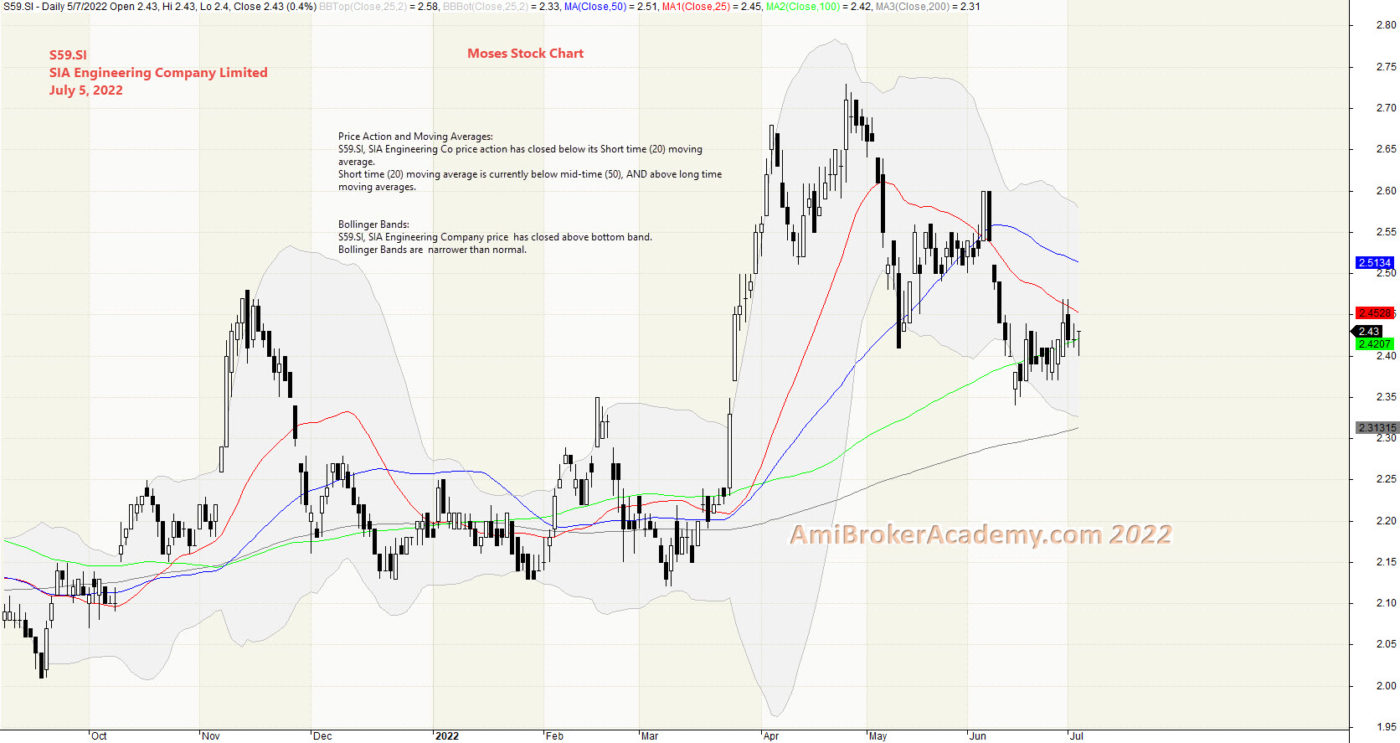
SIA Engineering Company and Bollinger Bands
20220705 SIA Engineering Company and Bollinger Bands and Moving Averages
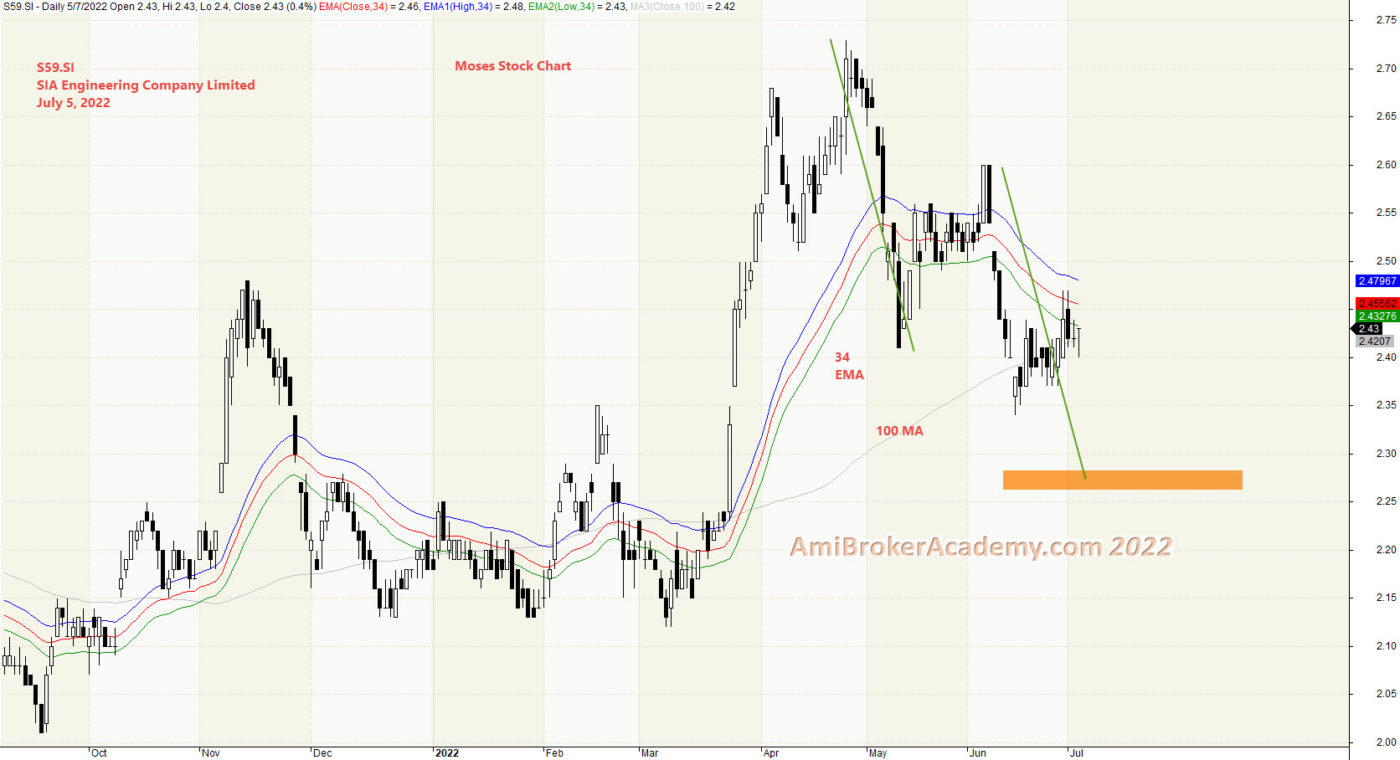
SIA Engineering Company and River
20220705 SIA Engineering Company and River
Moses Power Charting
Official AmiBrokerAcademy.com Charting
Disclaimer
The above result is for illustration purpose. It is meant to be used for learning buy or sell signals. We do not recommend for any particular stocks. If particular stocks of such are mentioned, they are meant as a demonstration of Amibroker as a powerful charting software. Amibroker is a charting software, it can program to scan the stocks for buy and sell signals. Or backtest for any trading strategy or technique.
We post script generated signals. Not all scan results are shown here depending on selection criterial. The MACD signal should use with price action. Users must understand what MACD and price action are all about before using them. If necessary you should attend a course to learn more on Technical Analysis (TA) and Moving Average Convergence Divergence, MACD.
Once again, the website does not guarantee any results or investment return based on the information and instruction you have read here. It should be used as learning aids only and if you decide to trade real money, all trading decision should be your own.
We learn from many past and present great traders. Kudo to these master.
Welcome to AmiBroker Academy dot com, amibrokeracademy.com.
If There is Only One Chart This is It
Moses Power Stock Chart.
We Believe – Buy Support or Sell Resistance.
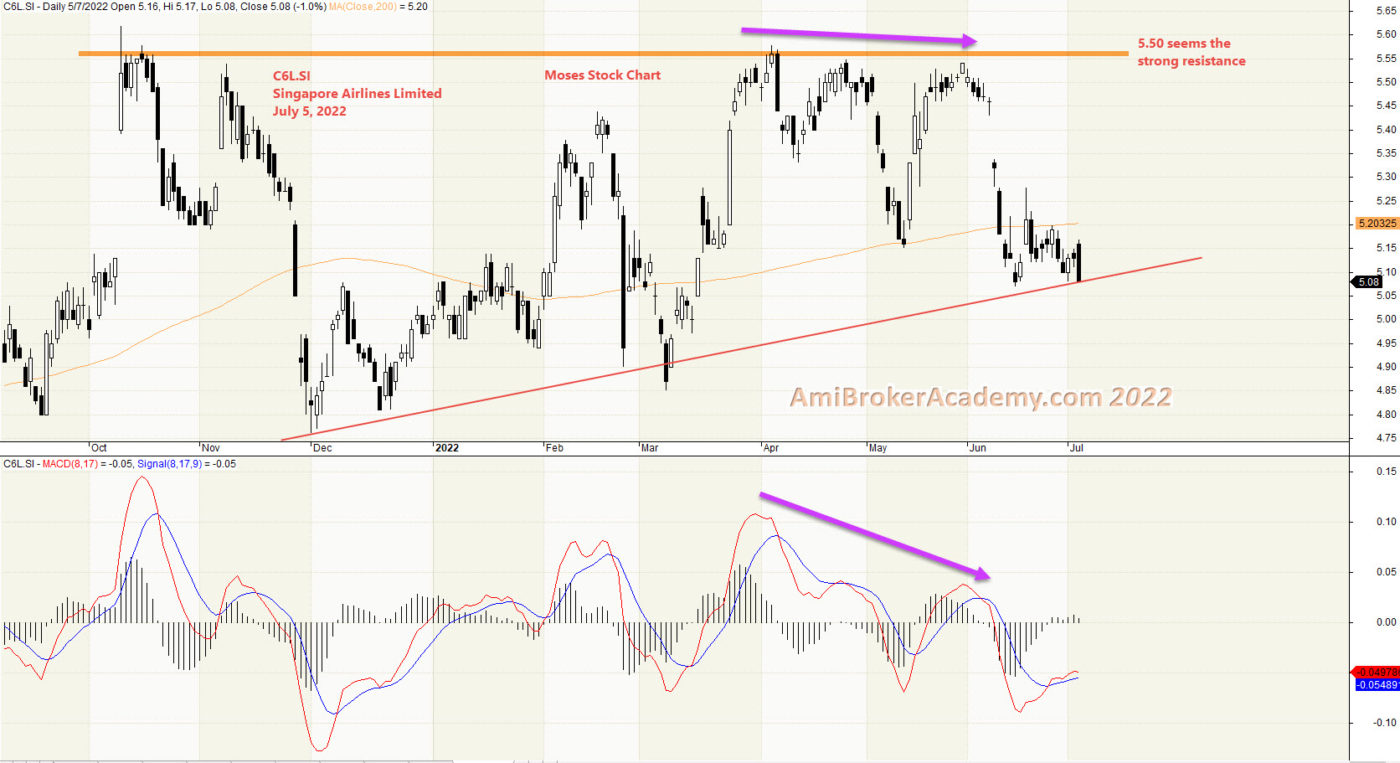
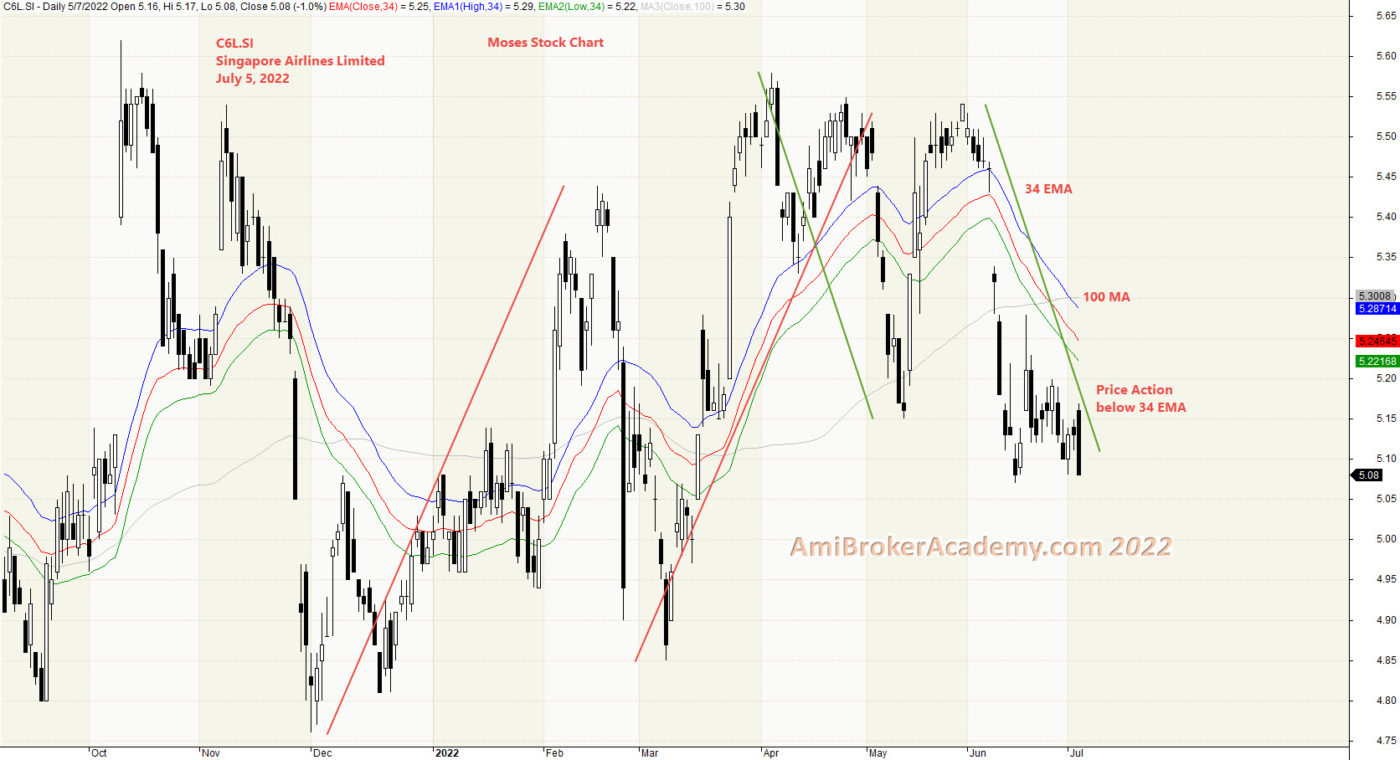
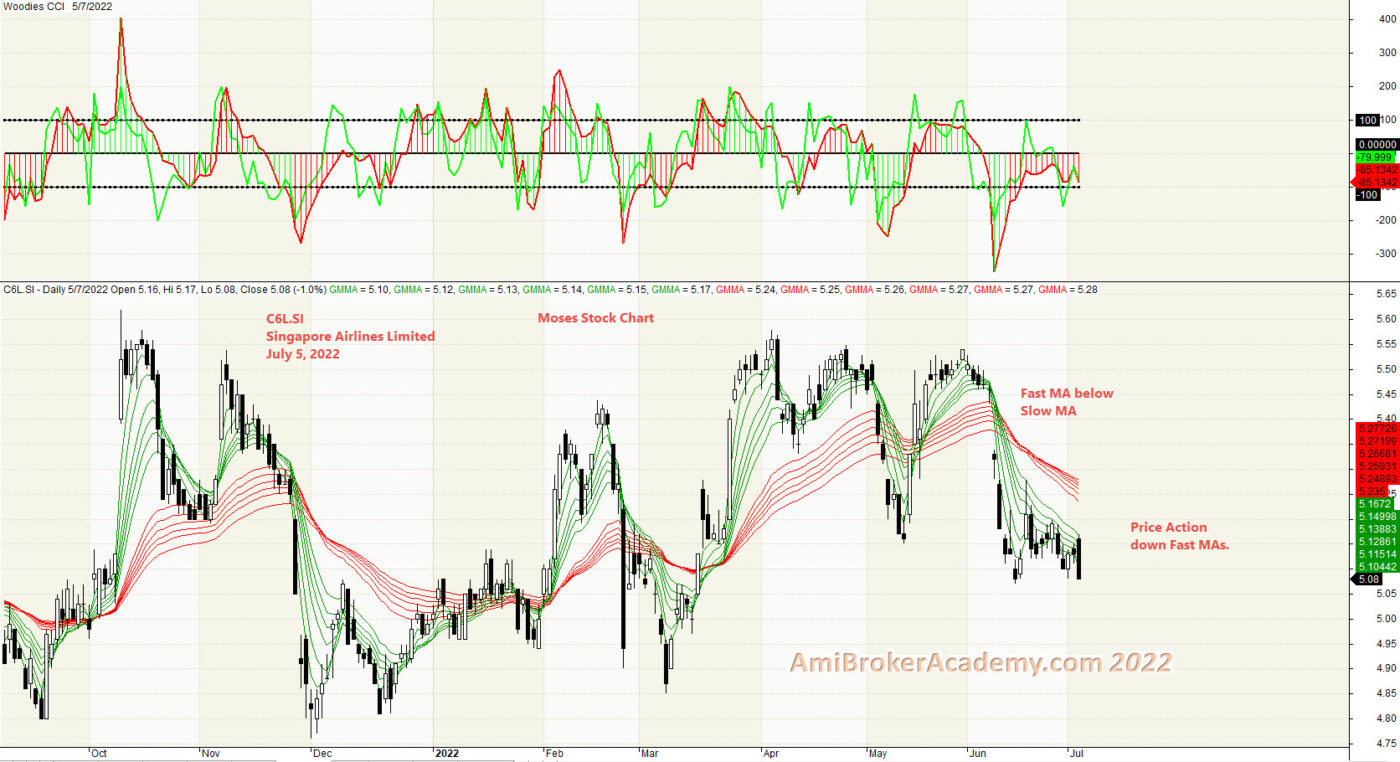
1) Singapore Airlines SIA
Price Action reflect the market emotions, it factor in news, buy or sell emotions.
When the market is bullish, how you trade you eventually still make money. When the market is sideways. You have to ride the wave on buy the bull bias and sell when it is bear.
There are a lot of uncertainty in the current market, many whom make money on crypto are liquidating to keep a float.
Moving Average is a great visual tool. MACD indicator is a easy to understand indicator. Support and Resistance is important and fundamental tool for trading.
When the price action continue to move higher but MACD is weaker, the price action may be change in direction. The opposite is true too, when price action is weaker, forming lower low but the MACD or MACD Histogram is forming higher low. Price action is also may be change in direction.
Manage your trade.
Think Think got more Things
In trading, some predict the up or down on the trend. Here, we look for support, strong support to buy. Or take profit when price action test the resistance.
Singapore Airlines and MACD
20220705 Singapore Airlines and MACD
Singapore Airlines and River
In addition to the River, we also plot the ABCD wave pattern, see chart.
20220705 Singapore Airlines and River
Singapore Airlines and GMMA and Woodlies CCI
20220705 Singapore Airlines and GMMA and Woodlies CCI
Moses Power Charting
Official AmiBrokerAcademy.com Charting
Disclaimer
The above result is for illustration purpose. It is meant to be used for learning buy or sell signals. We do not recommend for any particular stocks. If particular stocks of such are mentioned, they are meant as a demonstration of Amibroker as a powerful charting software. Amibroker is a charting software, it can program to scan the stocks for buy and sell signals. Or backtest for any trading strategy or technique.
We post script generated signals. Not all scan results are shown here depending on selection criterial. The MACD signal should use with price action. Users must understand what MACD and price action are all about before using them. If necessary you should attend a course to learn more on Technical Analysis (TA) and Moving Average Convergence Divergence, MACD.
Once again, the website does not guarantee any results or investment return based on the information and instruction you have read here. It should be used as learning aids only and if you decide to trade real money, all trading decision should be your own.
We learn from many past and present great traders. Kudo to these master.