June 30 2022
Welcome!
Welcome to AmiBroker Academy dot com, amibrokeracademy.com.
If There is Only One Chart This is It
Investors should reduce exposure to Chinese stocks listed in US, that was from many market experts such as Credit Swiss, read the following for why, It’s ‘game over’ for U.S.-listed Chinese companies, global asset manager says. Let study a stock like Lenovo.
Remember, the opinions from the respective authors do not represent us. Be aware.
Moses Power Stock Chart.
We Believe – Buy Support or Sell Resistance.
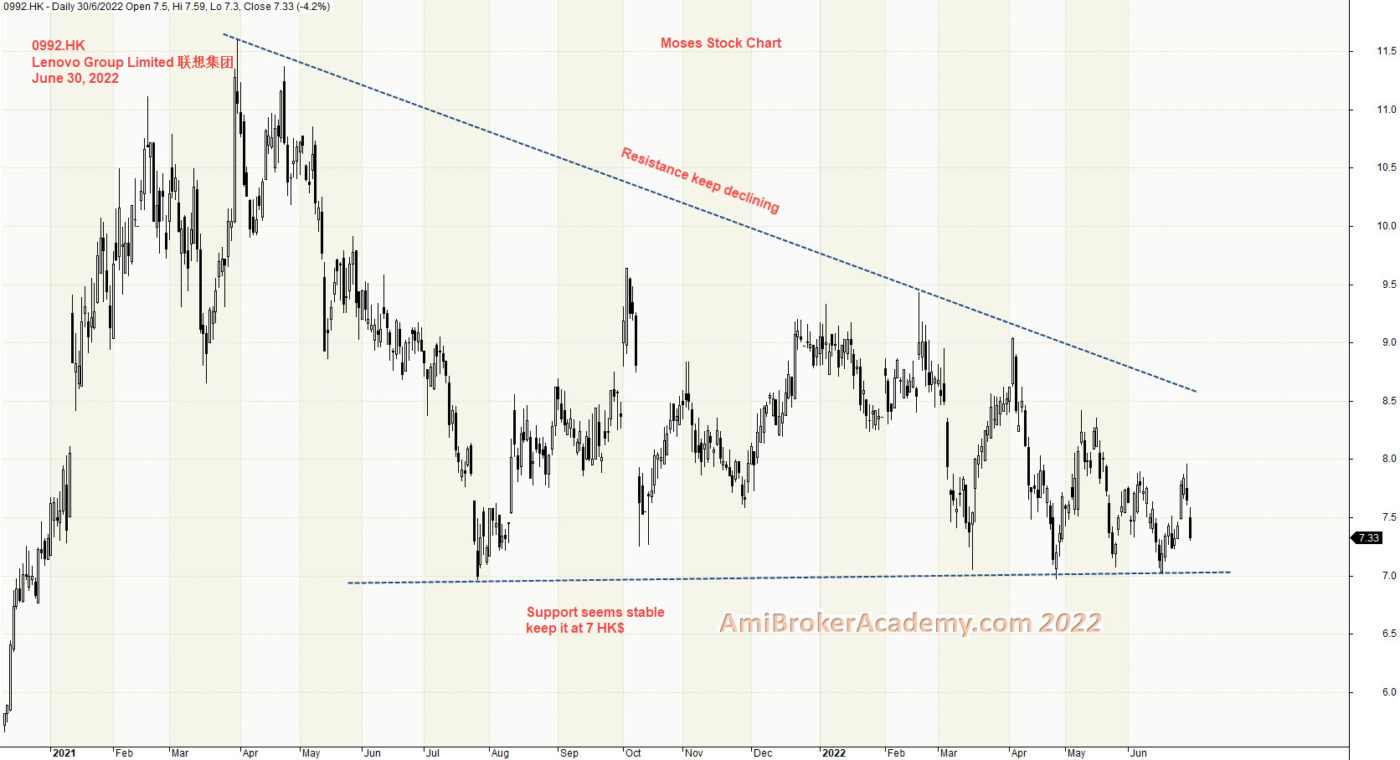
1) Lenovo Group Limited 联想集团 and Price Action
Price Action reflect the market emotions, it factor in news, buy or sell emotions.
Moving Average is a great visual tool. But trendline is the most fundamental. When we connect the high to draw a trendline, or connect the low to draw a trendline.
From the trendline connect the high, we see the trendline is slopping down. Bearish. When the trendline slopping down also means the price action is forming lower high.
When the price action connecting the low, the trendline can be a support. See chart, the support continue to maintain at 7 HK$.
If you are a buy and hold strategist, Will you sell now or buy now? Remember only buy near support, and sell near resistance. Wait for the price action draw near either resistance or support before action.
Think Think got more Things
In trading, some predict the up or down on the trend. Here, we look for support, strong support to buy. Or take profit when price action test the resistance.
Moses Power Charting
Official AmiBrokerAcademy.com Charting
Disclaimer
The above result is for illustration purpose. It is meant to be used for learning buy or sell signals. We do not recommend for any particular stocks. If particular stocks of such are mentioned, they are meant as a demonstration of Amibroker as a powerful charting software. Amibroker is a charting software, it can program to scan the stocks for buy and sell signals. Or backtest for any trading strategy or technique.
We post script generated signals. Not all scan results are shown here depending on selection criterial. The MACD signal should use with price action. Users must understand what MACD and price action are all about before using them. If necessary you should attend a course to learn more on Technical Analysis (TA) and Moving Average Convergence Divergence, MACD.
Once again, the website does not guarantee any results or investment return based on the information and instruction you have read here. It should be used as learning aids only and if you decide to trade real money, all trading decision should be your own.
We learn from many past and present great traders. Kudo to these master.