2 July 2022
Welcome!
Welcome to AmiBroker Academy dot com, amibrokeracademy.com.
If There is Only One Chart This is It
Investors should reduce exposure to Chinese stocks listed in US, as market experts from Credit Swiss suggested, read the following for why, It’s ‘game over’ for U.S.-listed Chinese companies, global asset manager says. But what about cryptocurrency.
Remember, the opinions from the respective authors do not represent us. We read chart and try to understand what the price action suggest.
Moses Power Stock Chart.
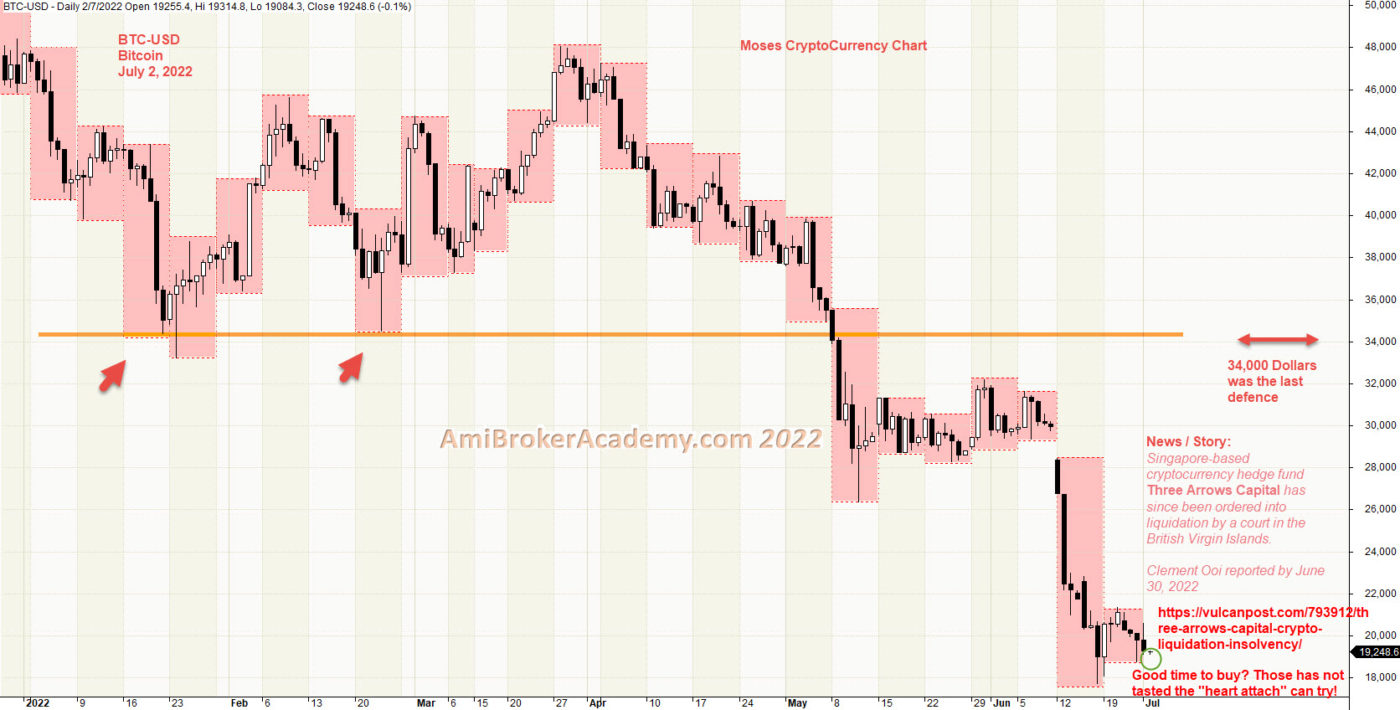
We Believe – Buy Support or Sell Resistance.
1) Bitcoin CryptoCurrency and Weekly High Low
Price Action reflect the market emotions, it factor in news, buy or sell emotions.
When the market is bullish, how you trade you also make money. When the market is sideways or bearish. You need a lot of strategy and critical thinking to stay ahead of market. Bull market has made many rich man.
Now, many are liquidating to keep a float. Read some of the recent update on the rich man story. S’pore-based Three Arrows Capital fails to pay debts – now under liquidation due to insolvency.
Moving Average is a great visual tool. MACD indicator is a easy to understand indicator. But there are fundamental tool such as support and resistance. When you study the high low, or weekly or monthly high low will give you a lot of insight. For your case here, we study the week high low, study seven months weekly high low.
For Bitcoin, from the week high low, we spot a strong level, see chart. Now price action has broken down below the strong level in May. Now the price action stay below the strong level. Is it a good to buy? Will see.
Manage your risk, the price action attempt to return to high in June but fail. Now the price action has gone lower.
If you are a buy and hold strategist, Will you sell now or buy now? Remember only buy near support, and sell near resistance. Wait for the price action draw near either resistance or support before action.
Think Think got more Things
In trading, some predict the up or down on the trend. Here, we look for support, strong support to buy. Or take profit when price action test the resistance.
Moses Power Charting
Official AmiBrokerAcademy.com Charting
Disclaimer
The above result is for illustration purpose. It is meant to be used for learning buy or sell signals. We do not recommend for any particular stocks. If particular stocks of such are mentioned, they are meant as a demonstration of Amibroker as a powerful charting software. Amibroker is a charting software, it can program to scan the stocks for buy and sell signals. Or backtest for any trading strategy or technique.
We post script generated signals. Not all scan results are shown here depending on selection criterial. The MACD signal should use with price action. Users must understand what MACD and price action are all about before using them. If necessary you should attend a course to learn more on Technical Analysis (TA) and Moving Average Convergence Divergence, MACD.
Once again, the website does not guarantee any results or investment return based on the information and instruction you have read here. It should be used as learning aids only and if you decide to trade real money, all trading decision should be your own.
We learn from many past and present great traders. Kudo to these master.