11 September, 2018
Thanks for visiting the site.
VC Visteon Corporation Charting
Buy Support Sell Resistance or Buy Low Sell High
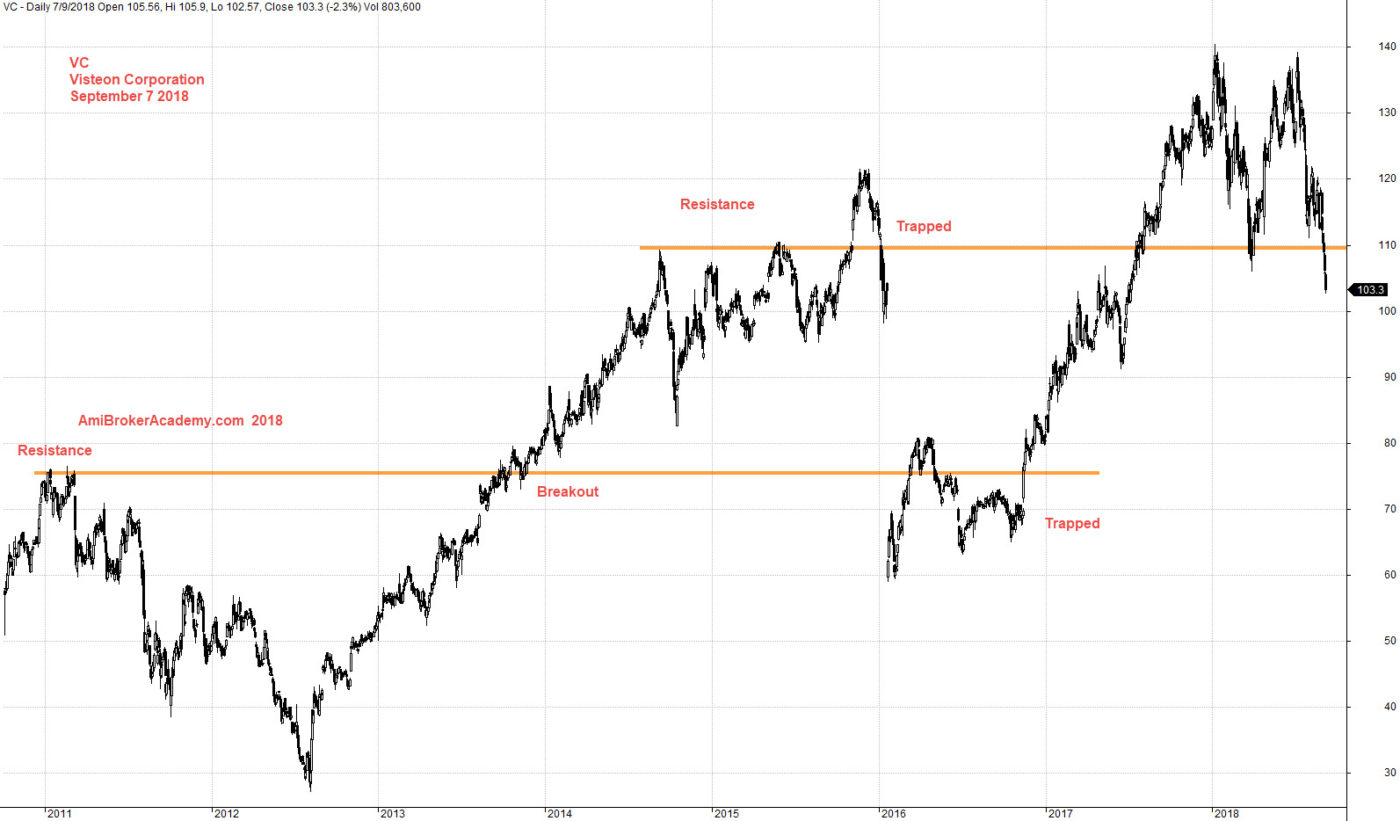
Study chart of Visteon Corporation stock price. Apply buy support and sell resistance strategy, see chart picture worth a thousand words, where is the support, where is the resistance.
Stock price now test and retest 140 dollars level, and fail. The price action retest the 110 and fall through the support. 110 dollars is a very strong level, resistance turns support. See chart, picture worth a thousand words.
Remind you again, buy support and sell resistance. Can you see number of traps? Bull trapped, when price action breakout of resistance. Instead of wait to buy at support, those that rush in the buy got trapped. See chart. Same same for the bear trapped, when those whom try to sell at the resistance turns support. Picture worth a thousand words, see chart.
Manage your risk.
September 7, 2018 Visteon Corporation Buy Hold Strategy
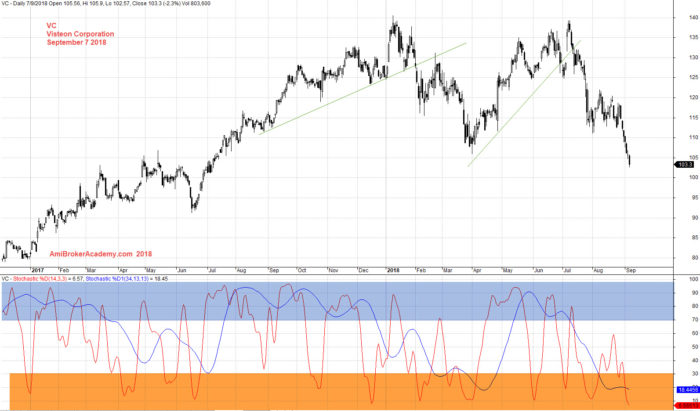
Price Action goes higher and pullback. Remember to take profit when the price action breakout below the bull trendline. See chart, picture worth a thousand words. If you add indicator like stochastic, when the price action reach oversold in stochastic, be aware of the price action may breakout below bull trend line. See chart for more. Trade with eyes open.
September 7, 2018 Visteon Corporation Charting
Another view for when to take profit, is check the MACD signals. Trade with eyes open.
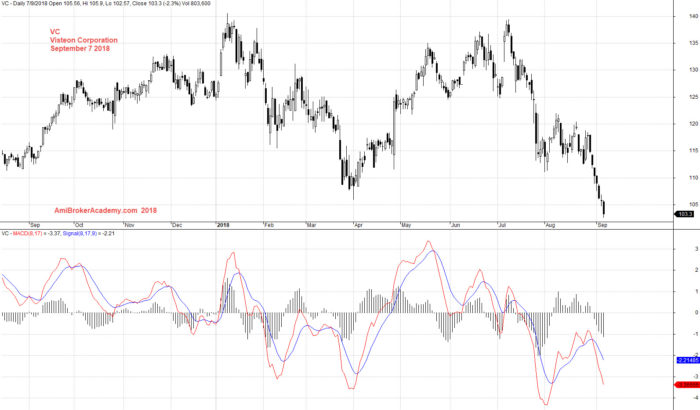
September 7, 2018 Visteon Corporation and MACD
Moses US Stock Chart Analysis
AmiBrokerAcademy.com
Disclaimer
The above result is for illustration purpose. It is not meant to be used for buy or sell decision. We do not recommend any particular stocks. If particular stocks of such are mentioned, they are meant as demonstration of Amibroker as a powerful charting software and MACD. Amibroker can program to scan the stocks for buy and sell signals.
These are script generated signals. Not all scan results are shown here. The MACD signal should use with price action. Users must understand what MACD and price action are all about before using them. If necessary you should attend a course to learn more on Technical Analysis (TA) and Moving Average Convergence Divergence, MACD.
Once again, the website does not guarantee any results or investment return based on the information and instruction you have read here. It should be used as learning aids only and if you decide to trade real money, all trading decision should be your own.