11 September, 2018
Let’s study the Social media stock. It does not matter, it is social media or eCommerce. The bottom line is sell advertisement. The more the fans or subscription, win.
Thanks for visiting the site.
FB Facebook Inc Charting
Buy Support Sell Resistance or Buy Low Sell High
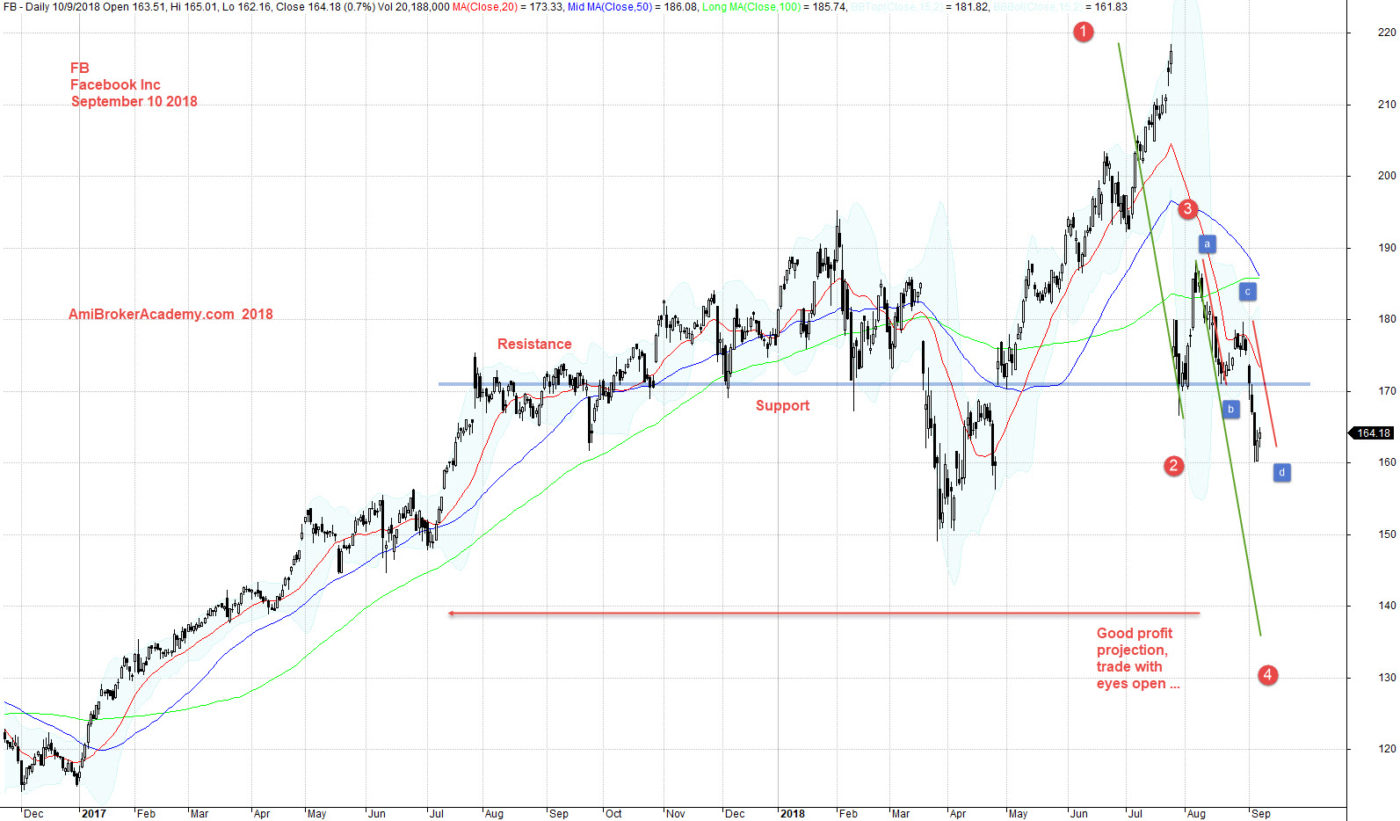
Study chart of Facebook stock price. Apply buy support and sell resistance strategy, see chart picture worth a thousand words, where is the support, where is the resistance.
Stock price tested near 220 dollars level, and fail. Worst gap down, why? There are many version of the story. Can you verify which one is real? I can’t, so do not trouble by the cause the price travel south. From a technical analysis view point. There is a potential bearish ABCD pattern. See chart, picture worth a thousand words.
140 dollars can be a conservative projection. Of course, all setup can fail. Trade with your eyes open.
Remind you again, buy support and sell resistance.
Manage your risk.
September 10, 2018 Facebook Inc and Projection
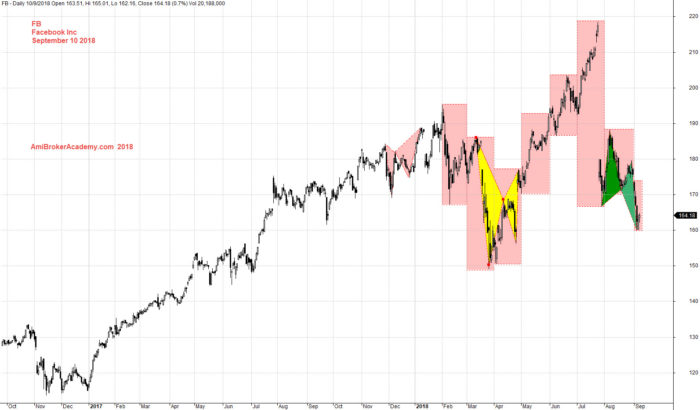
See chart, price action breakout higher than 190 after pullback to the low of 150. The price action after test 220 and fail. We could see a bearish ABCD pattern. Trade with eyes open.
September 10, 2018 Facebook Inc and Patterns
It is always great to have more data, see chart below. The price action stop and support at each of the key levels. See chart.
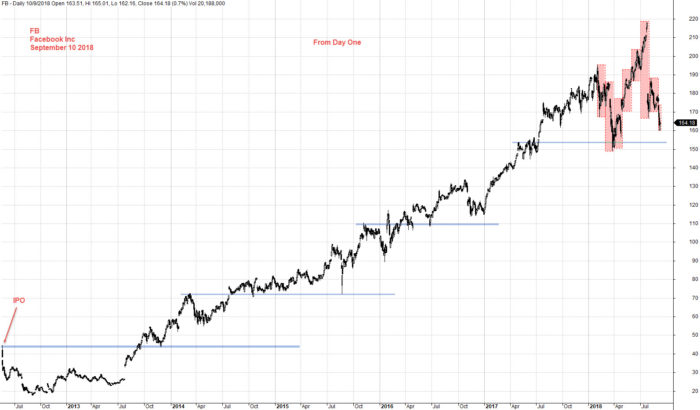
September 10, 2018 Facebook Inc from Day One and Key Levels
Moses US Stock Chart Analysis
AmiBrokerAcademy.com
Disclaimer
The above result is for illustration purpose. It is not meant to be used for buy or sell decision. We do not recommend any particular stocks. If particular stocks of such are mentioned, they are meant as demonstration of Amibroker as a powerful charting software and MACD. Amibroker can program to scan the stocks for buy and sell signals.
These are script generated signals. Not all scan results are shown here. The MACD signal should use with price action. Users must understand what MACD and price action are all about before using them. If necessary you should attend a course to learn more on Technical Analysis (TA) and Moving Average Convergence Divergence, MACD.
Once again, the website does not guarantee any results or investment return based on the information and instruction you have read here. It should be used as learning aids only and if you decide to trade real money, all trading decision should be your own.