10 September, 2018
Thanks for visiting the site.
Bitcoin Charting

September 8, 2018 Bitcoin reach the peak at 20000
If we reference to the July low and swing high, we redraw the Fibonacci retracement. We see the low touch the 78%. See chart, picture worth a thousand words.
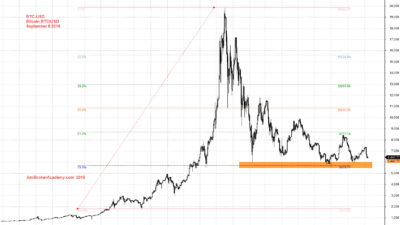
September 8, 2018 Bitcoin redraw the Fibo retracement
Study the chart, we see the price action is like a dead cat bounce. The price action is getting weaker and get close to the 78%. See chart.
We will study the price action using tools such as stochastic and MACD.
The following chart we see the relation of Fast and Slow Stochastic and Bitcoin price action, see chart picture worth a thousand words. Trade with eyes open.

September 8, 2018 Bitcoin and Stochastic
The following chart is the Bitcoin and MACD relation. See chart, picture worth a thousand words.
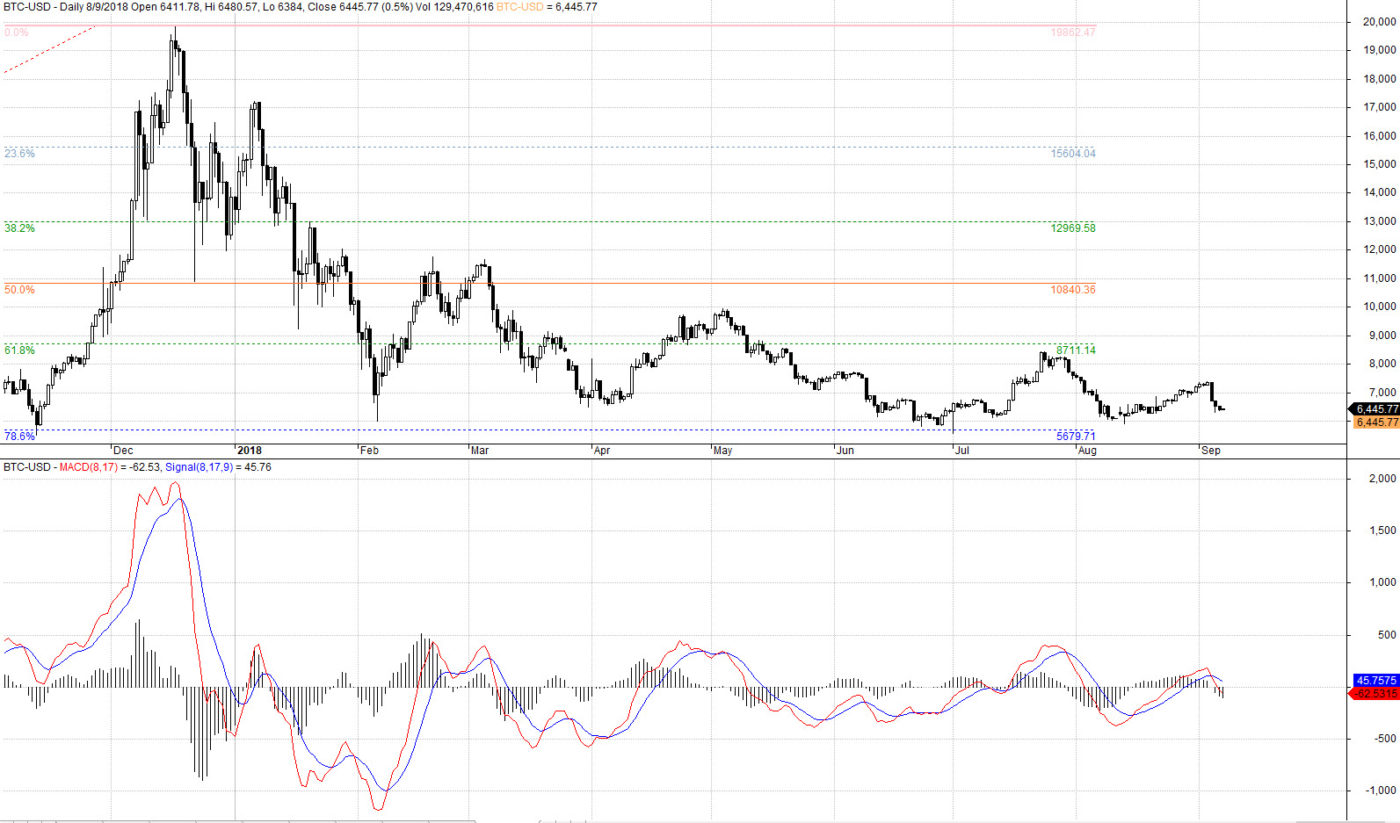
September 8, 2018 Bitcoin and MACD
Moses US Stock Chart Analysis
AmiBrokerAcademy.com
Disclaimer
The above result is for illustration purpose. It is not meant to be used for buy or sell decision. We do not recommend any particular stocks. If particular stocks of such are mentioned, they are meant as demonstration of Amibroker as a powerful charting software and MACD. Amibroker can program to scan the stocks for buy and sell signals.
These are script generated signals. Not all scan results are shown here. The MACD signal should use with price action. Users must understand what MACD and price action are all about before using them. If necessary you should attend a course to learn more on Technical Analysis (TA) and Moving Average Convergence Divergence, MACD.
Once again, the website does not guarantee any results or investment return based on the information and instruction you have read here. It should be used as learning aids only and if you decide to trade real money, all trading decision should be your own.