8 September, 2018
Buy Hold Traders
Back in early 2000 or late 1900 where many companies use share option to retain talent. Many of the people go broke because of no Finance understand and greedy.
Many see the paper money, and thought they are rich. They are if there can exchange the paper (shares) into to cash. They will be alright. But many go ahead to spend the money without understanding that everyone are investment geniuses in bull markets.
Interestingly all setup to fail this overnight millionaire, it takes more than one working day, most of time many be up to five business day before you can trade in the stock exchange. By then the price decline. Many will hold to wait for the price to recover back to the last price, but never for a short time.
In Singapore, there are stock went from above ten dollars to below sub one dollars. Many have hold and continue to hold till the company go private again. Imaging, if you are these traders, you are one of those buy and hold traders.
Singapore Stock Stories
Thanks for visiting the site.
5DP Heeton Holdings Charting
Study Support Resistance
To maximize your profit and minimize risk is to buy low sell high, or in other words, buy support sell resistance.
Study Heeton Holdings stock price. Use buy support sell resistance strategy. Remember to take profit when the price action breakout below the bullish trend line. See chart picture worth a thousand words.
To understand a stock, it is good to have more data, so when you can study the stock chart for about ten years it gives a good view about the stock. See chart, we have data from 2009. The stock price went from below 15 cents to above 70 cents in five years. The price action retest 70 cents and nearly breakout further in 75 cents but fail. The price action begin to decline in 2015.
Trade with eyes open.
Manage your risk.
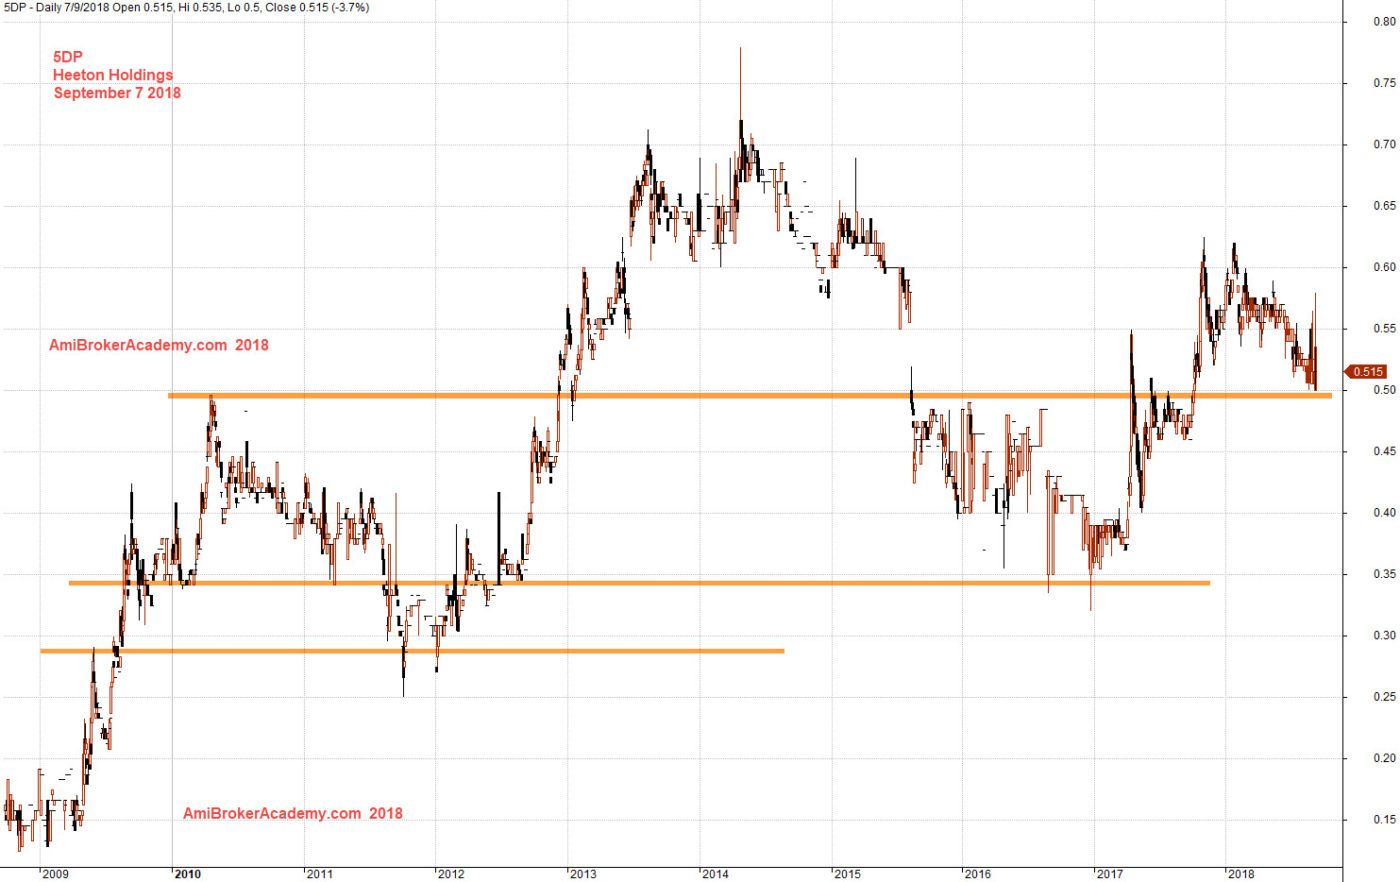
September 7, 2018 Heeton Holdings Support Resistance From 2010
You can not trade in such a picture, this is for investment or portfolio traders. You need to the share in a more recent movement. See the next few charts. Moving Average provides you another view of the stock trend. You apply any period, such as 20, 50 or such as 34 period as long as it makes sense to you. And you can create a story line for your self to justify why buy and sell.
For our case here, we choose 34 period, and EMA. Instead of normal close price, we use high, low and close EMA. Three EMA forms a band, you can see them like a river. So, let’s call it River.
When the River slopping up, and price action bounces above the River, it is bull trend. The opposite is true as well, slopping down, resisted and stay below River, bearish.
Picture worth a thousand words, see chart. So, it is clear that the stock price has been on the bear trend from 2018.
Do you get it? Enjoy learning.
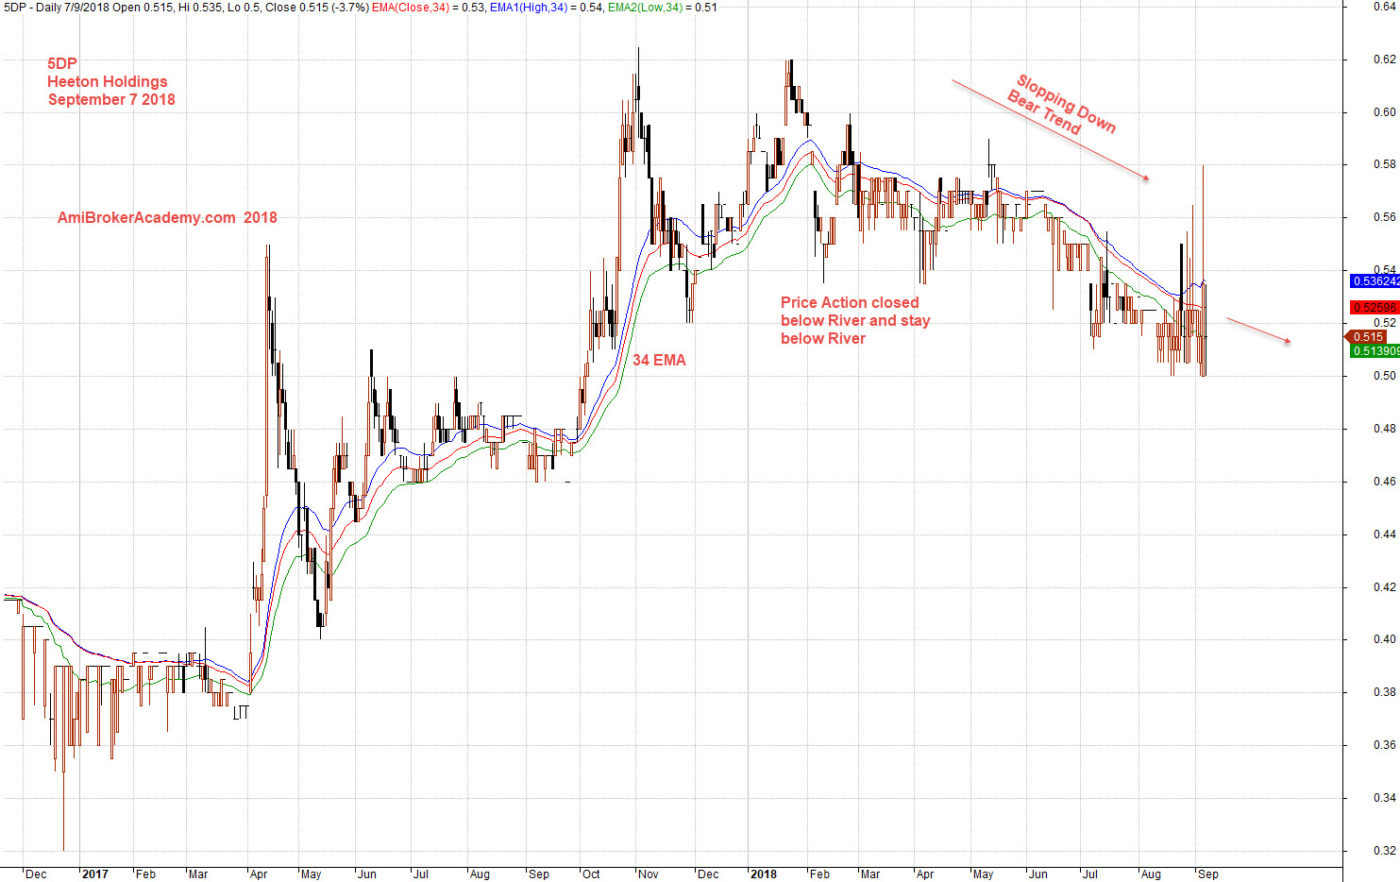
20180907 Heeton Holdings and EMA River
In order to trade, buy or sell. You need to be sure, so MACD indicator will give you more information. We like to mention here, there is no right no wrong. So, do just believe that do not use indicators and so one. If you will spend time to study all the indicators, you will know each of the indicator has a rich background and history on why it was found. In our example here, we see there is a potential of bullish divergence. And remember all setup can fail. The divergence gives you a heads up, you must find the right moment to enter the market. When, that is where the candlestick patterns come in.
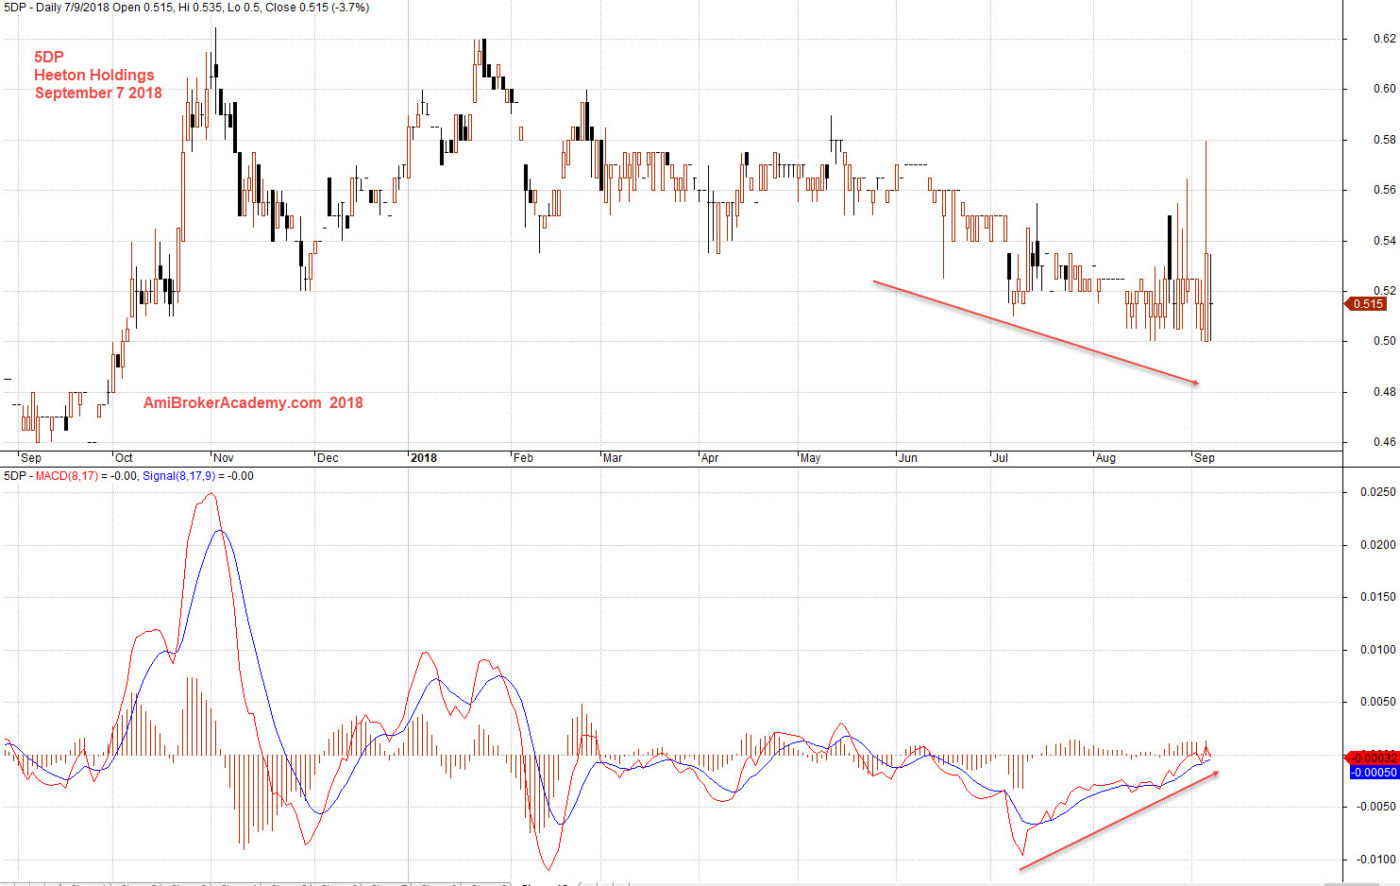
September 7, 2018 Heeton Holdings and MACD
Moses
AmiBrokerAcademy.com – we are different
Disclaimer
The above result is for illustration purpose. It is not meant to be used for buy or sell decision. We do not recommend any particular stocks. If particular stocks of such are mentioned, they are meant as demonstration of Amibroker as a powerful charting software and MACD. Amibroker can program to scan the stocks for buy and sell signals.
These are script generated signals. Not all scan results are shown here. The MACD signal should use with price action. Users must understand what MACD and price action are all about before using them. If necessary you should attend a course to learn more on Technical Analysis (TA) and Moving Average Convergence Divergence, MACD.
Once again, the website does not guarantee any results or investment return based on the information and instruction you have read here. It should be used as learning aids only and if you decide to trade real money, all trading decision should be your own.