7 September, 2018
Singapore Stock Stories
Thanks for visiting the site.
STI Straits Times Index Charting
Study Straits Times Stock Index price action. See chart picture worth a thousand words. ST Index try three time to close higher than 3650 but fail. So, we have a funny head and shoulders pattern. Now the price action is in the process of completeing the cd leg. It may be resulting in AB = CD or greater. There is no right no wrong, so trade with your eyes open. In case, the right comes true.
Trade with eyes open.
Manage your risk.
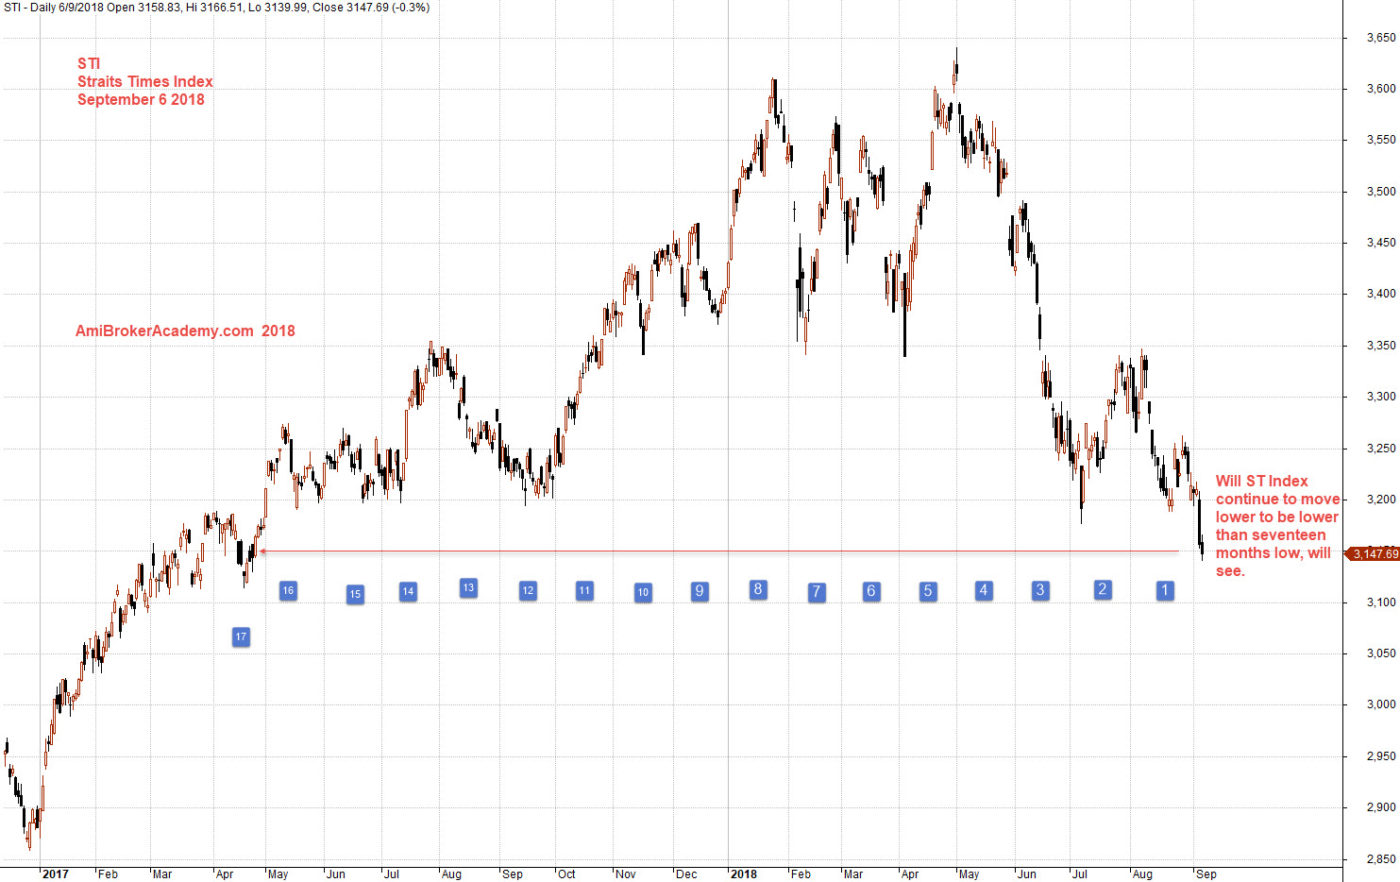
September 6, 2018 Straits Times Index and Low
STI Straits Times Index Charting
Head and Shoulders, see chart. Trade with your eyes open. See the bearish ABCD pattern, the price action is in the CD leg, a H M Gartley ABCD pattern. Trade with your eyes open. Manage your risk.
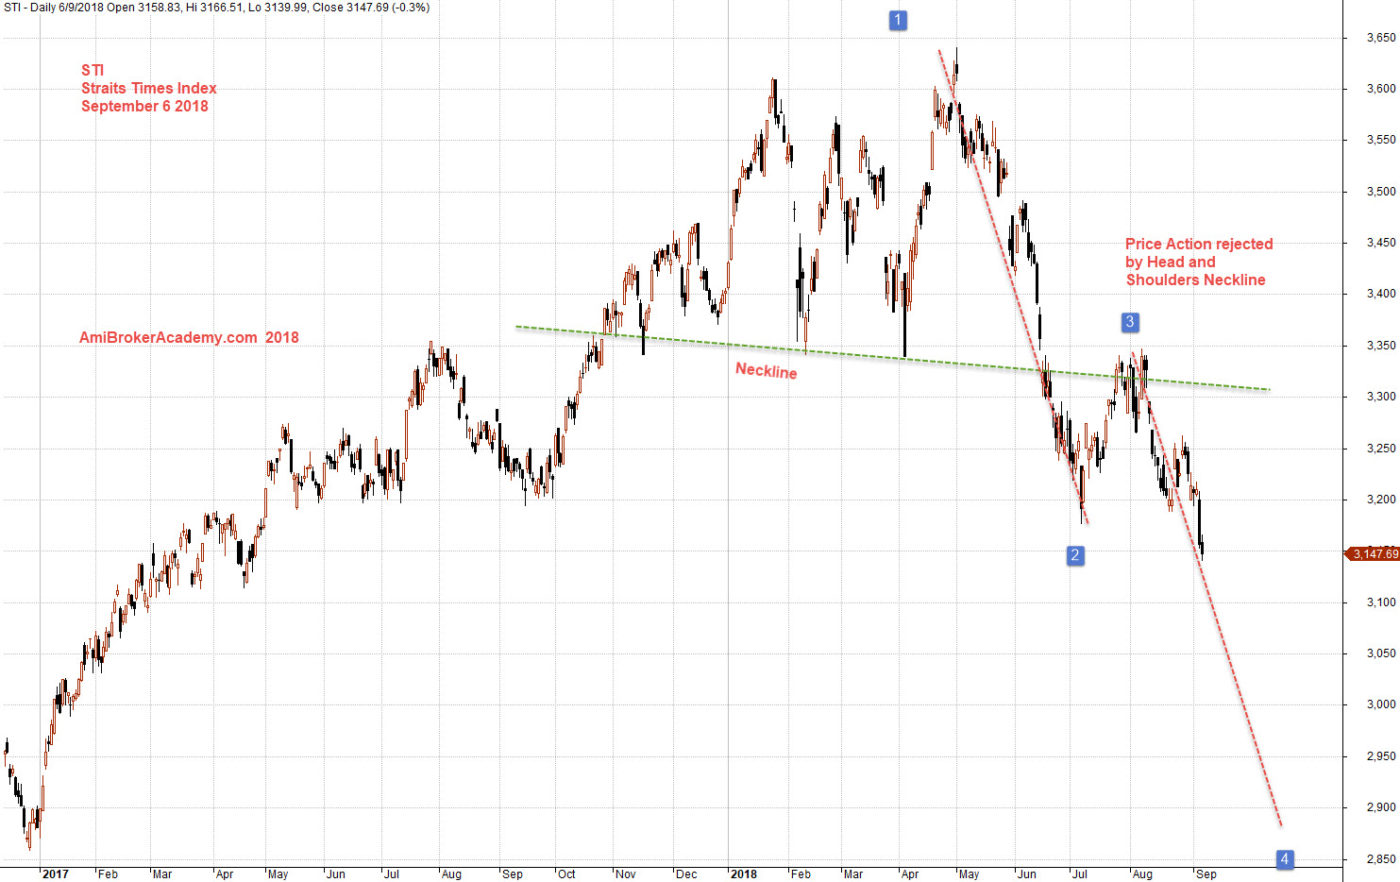
September 6, 2018 Straits Times Index Head and Shoulders
Moses
AmiBrokerAcademy.com
Disclaimer
The above result is for illustration purpose. It is not meant to be used for buy or sell decision. We do not recommend any particular stocks. If particular stocks of such are mentioned, they are meant as demonstration of Amibroker as a powerful charting software and MACD. Amibroker can program to scan the stocks for buy and sell signals.
These are script generated signals. Not all scan results are shown here. The MACD signal should use with price action. Users must understand what MACD and price action are all about before using them. If necessary you should attend a course to learn more on Technical Analysis (TA) and Moving Average Convergence Divergence, MACD.
Once again, the website does not guarantee any results or investment return based on the information and instruction you have read here. It should be used as learning aids only and if you decide to trade real money, all trading decision should be your own.