8 September, 2018
Buy Hold Traders Failure
In Singapore, there were a stock or may be a few stocks went from ipo to above ten dollars and fall below sub one dollars. At least I know of two companies. Many of employees have exercise the options and hold, and continue to hold till the company go private again. Imaging, if you are these employees or traders, you are one of those buy and hold traders.
Singapore Stock Stories
Thanks for visiting the site.
40D Starburst Holdings Charting
Study Support Resistance
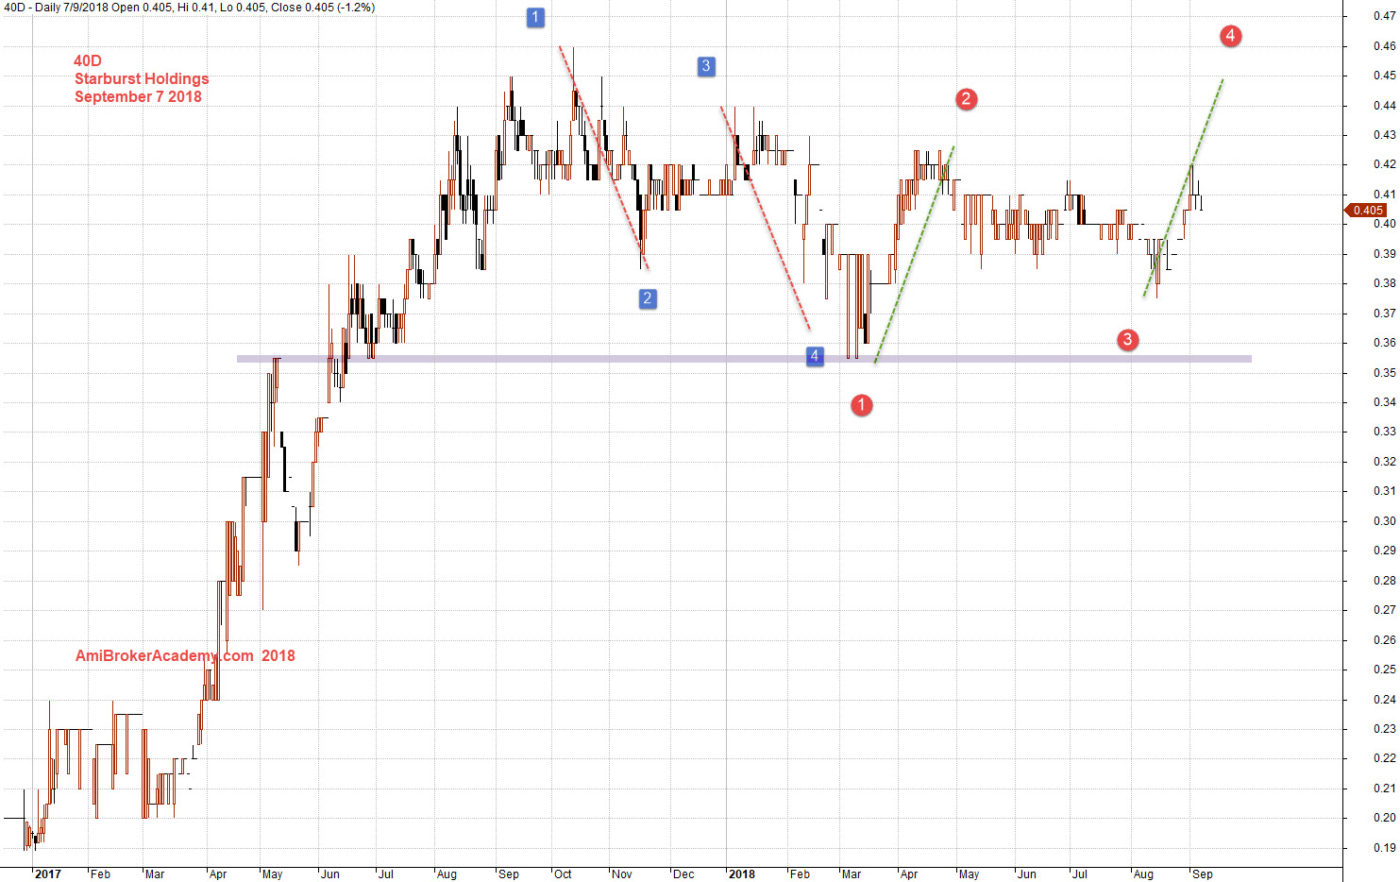
To maximize your profit and minimize risk is to buy low sell high, or in other words, buy support sell resistance.
Study Starburst Holdings stock price. Use buy support sell resistance strategy. Remember to take profit when the price action breakout below the bullish trend line. See chart picture worth a thousand words.
To understand a stock, it is good to have more data.
The stock breakout from resistance and continue to climb higher, and manage to test 45 cents. The stock price pullback to test the resistance, and resistance turns support the stock price rebounce. See chart, picture worth a thousand words. You see bearish ABCD and turns bullish ABCD.
Trade with eyes open. As setup can fail.
Manage your risk.
September 7, 2018 Starburst Holdings and ABCD
In order to trade, buy or sell. You need to be sure, so add MACD indicator will give you more information. There is no right no wrong. If you will spend time to study all the indicators, you will know each of the indicator has a rich background and history on why they were found.
In our example here, we see there is a potential of bullish divergence at start of 2018. And remember all setup can fail. The divergence gives you a heads up, there were a pullback after the low.
Do you get it? Enjoy learning.
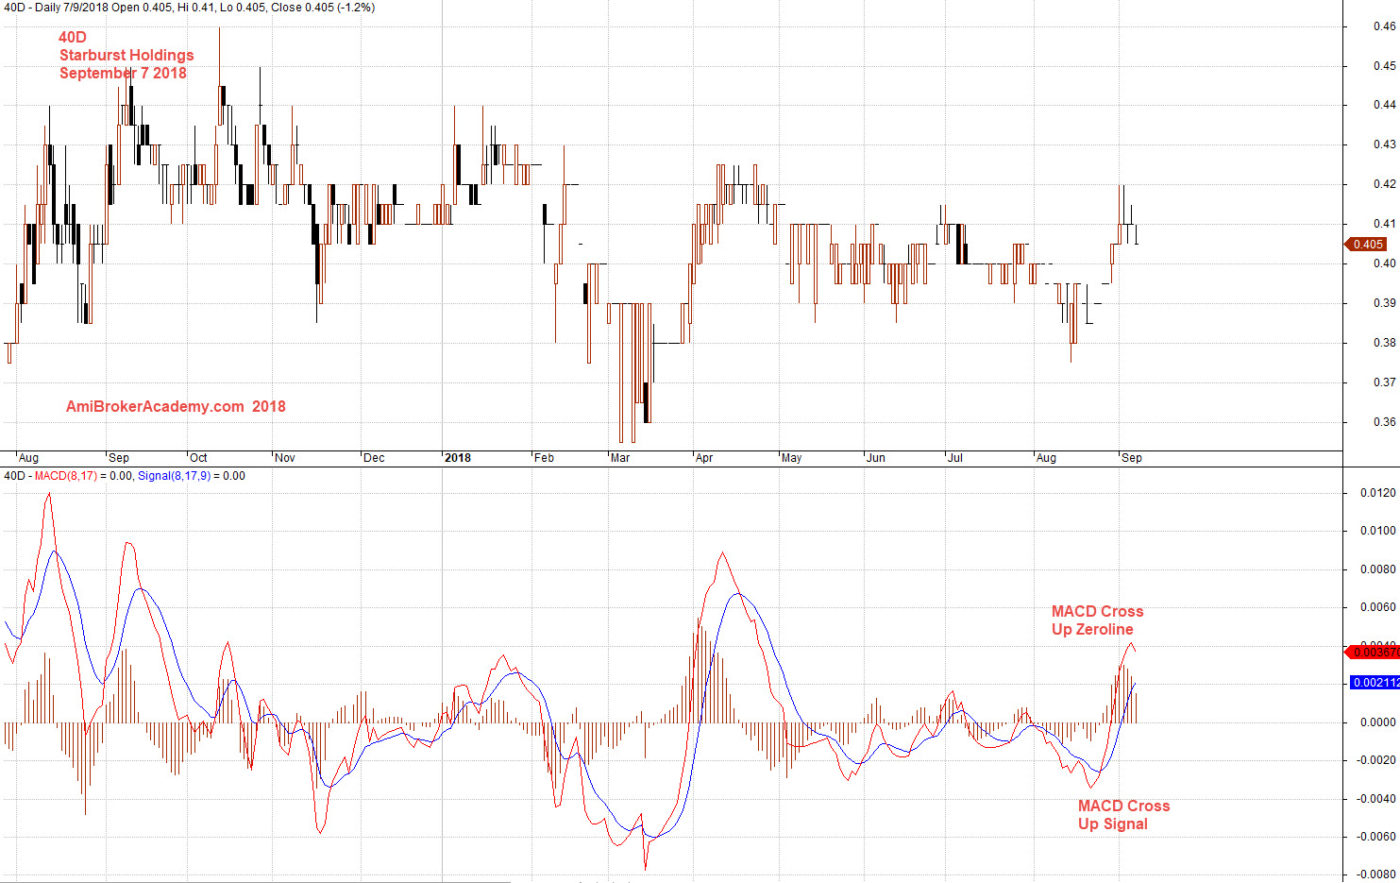
September 7, 2018 Starburst Holdings and MACD
In order to understand the stock better, it is good to have more data. See we manage to have the stock chart from day one, ipo until present. The stock went rocket to the high of near eighty cents, short of probably three cents. But the price action suddenly to fail, and the stock price fail the sustain. The stock price went sideways for a few months, and begin to drift south. It was a pain for those whom bought the shares at IPO. the worst were those whom thought they missed a good stock and jump in at the peak. As trader if you do not understand to cut lost fast, you will be ended up like this example. The stock price is now near IPO day.
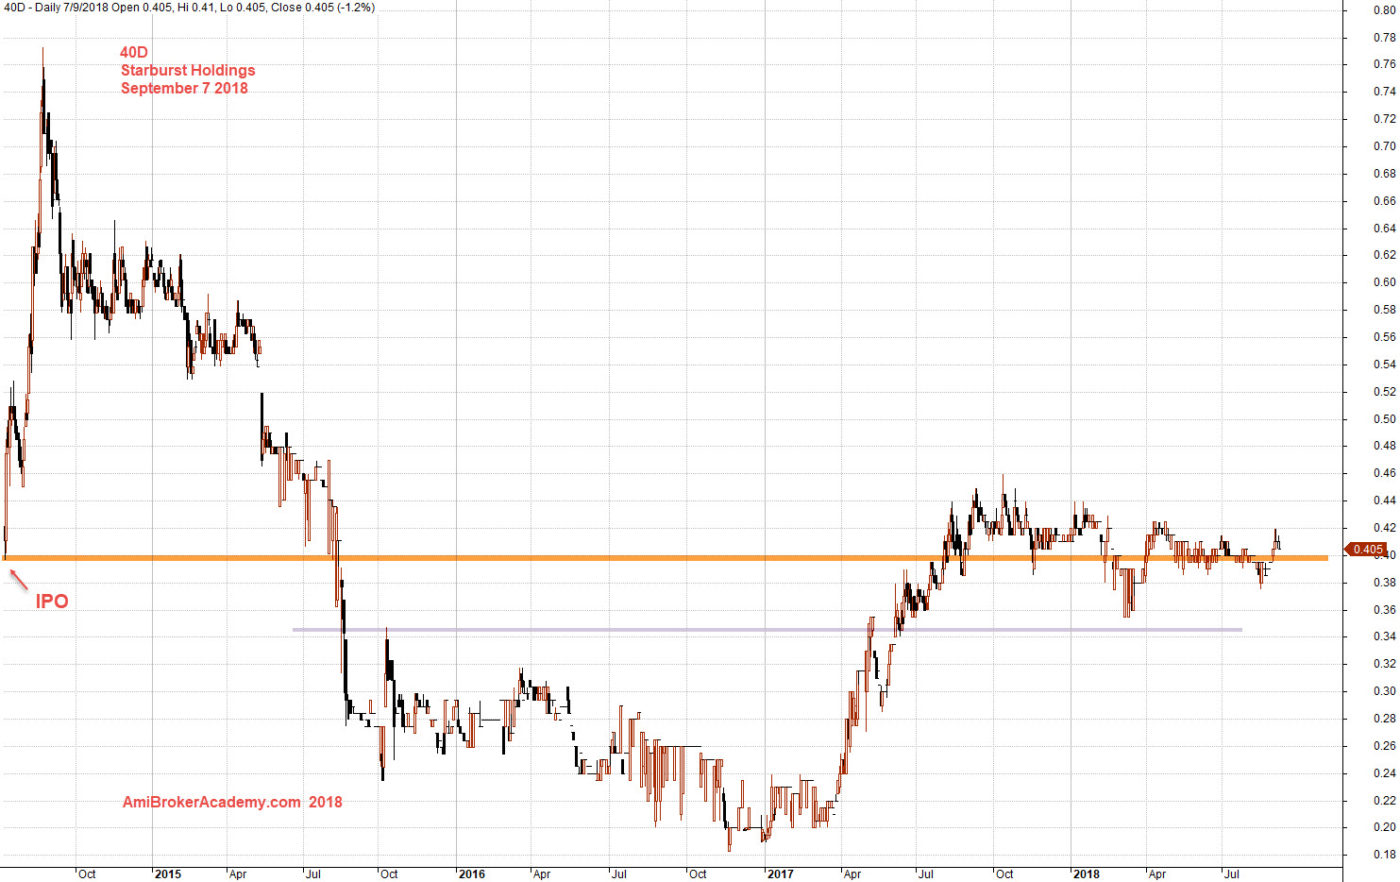
September 7, 2018 Starburst Holdings Charting
Moses
AmiBrokerAcademy.com – we are different
Disclaimer
The above result is for illustration purpose. It is not meant to be used for buy or sell decision. We do not recommend any particular stocks. If particular stocks of such are mentioned, they are meant as demonstration of Amibroker as a powerful charting software and MACD. Amibroker can program to scan the stocks for buy and sell signals.
These are script generated signals. Not all scan results are shown here. The MACD signal should use with price action. Users must understand what MACD and price action are all about before using them. If necessary you should attend a course to learn more on Technical Analysis (TA) and Moving Average Convergence Divergence, MACD.
Once again, the website does not guarantee any results or investment return based on the information and instruction you have read here. It should be used as learning aids only and if you decide to trade real money, all trading decision should be your own.