May 25, 2017
Singapore Stock Analysis
AUE Golden Energy and Resouces and MA Wave
To understand stock chart better, study the Golden Energy and Resources using moving average. Instead of use one, we use high, low and close of 34 period. The three MAs we call them wave, or river. The price action will bounce up or down of the MA band.
First the price action bounce above the MA band, and then close below the MA band and the price action get resisted and bounced below the MA band. Golden Energy and Resources try to reverse, the price action close above the MA and supported by MA. But the reversal fail and the price cross down, and resisted by MA.
Manage your risk.
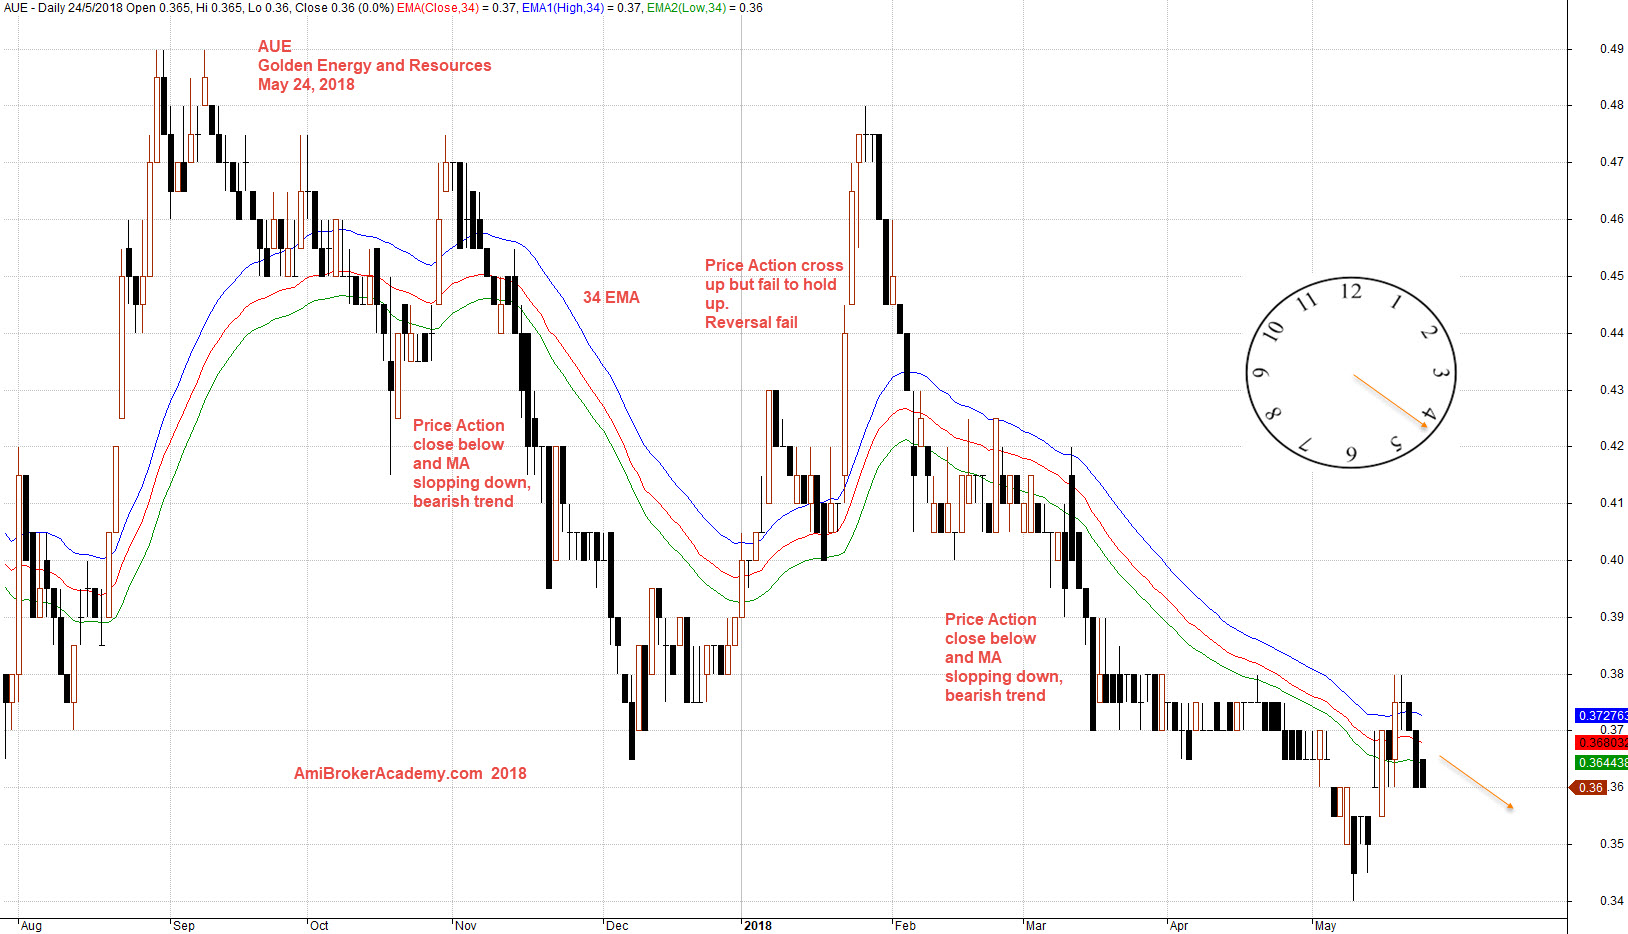
May 24, 2018 Golden Energy and Resouces and EMA Wave
Moses
AmiBrokerAcademy.com
Disclaimer
The above result is for illustration purpose. It is not meant to be used for buy or sell decision. We do not recommend any particular stocks. If particular stocks of such are mentioned, they are meant as demonstration of Amibroker as a powerful charting software and MACD. Amibroker can program to scan the stocks for buy and sell signals.
These are script generated signals. Not all scan results are shown here. The MACD signal should use with price action. Users must understand what MACD and price action are all about before using them. If necessary you should attend a course to learn more on Technical Analysis (TA) and Moving Average Convergence Divergence, MACD.
Once again, the website does not guarantee any results or investment return based on the information and instruction you have read here. It should be used as learning aids only and if you decide to trade real money, all trading decision should be your own.