May 25, 2017
Singapore Stock Analysis – Stock Stories
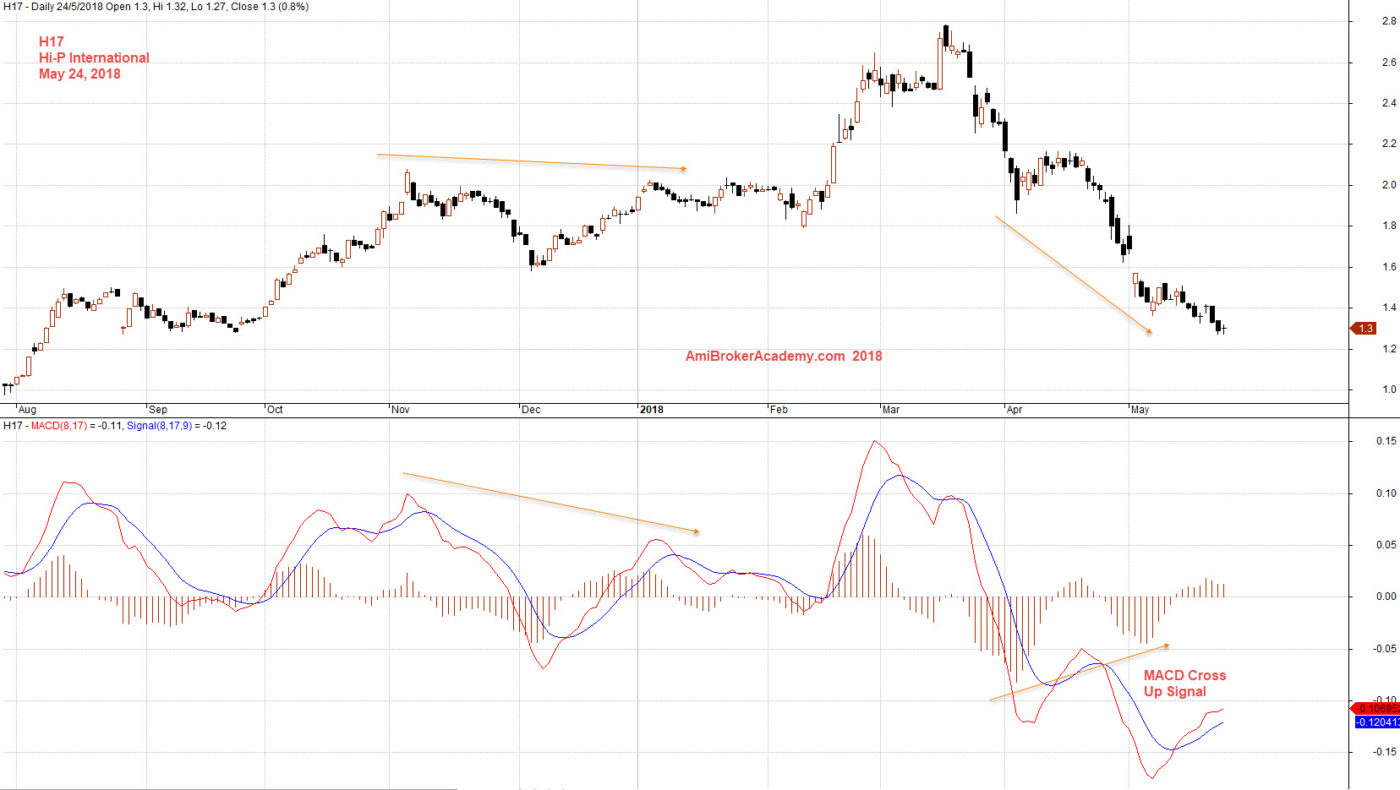
H17 Hi-P International and MACD
Study Hi-P International stock chart, picture worth a thousand words. We see price forms higher high and higher low til March 2018. Thereafter the price action takes a turn to form lower low and lower high.
Use MACD indicator, we see MACD-H forms a higher low. This signal a possibility on trend change. Remember all setup can fail.
Trade with Eyes Open Manage Your Risk
May 24, 2018 Hi-P International and MACD
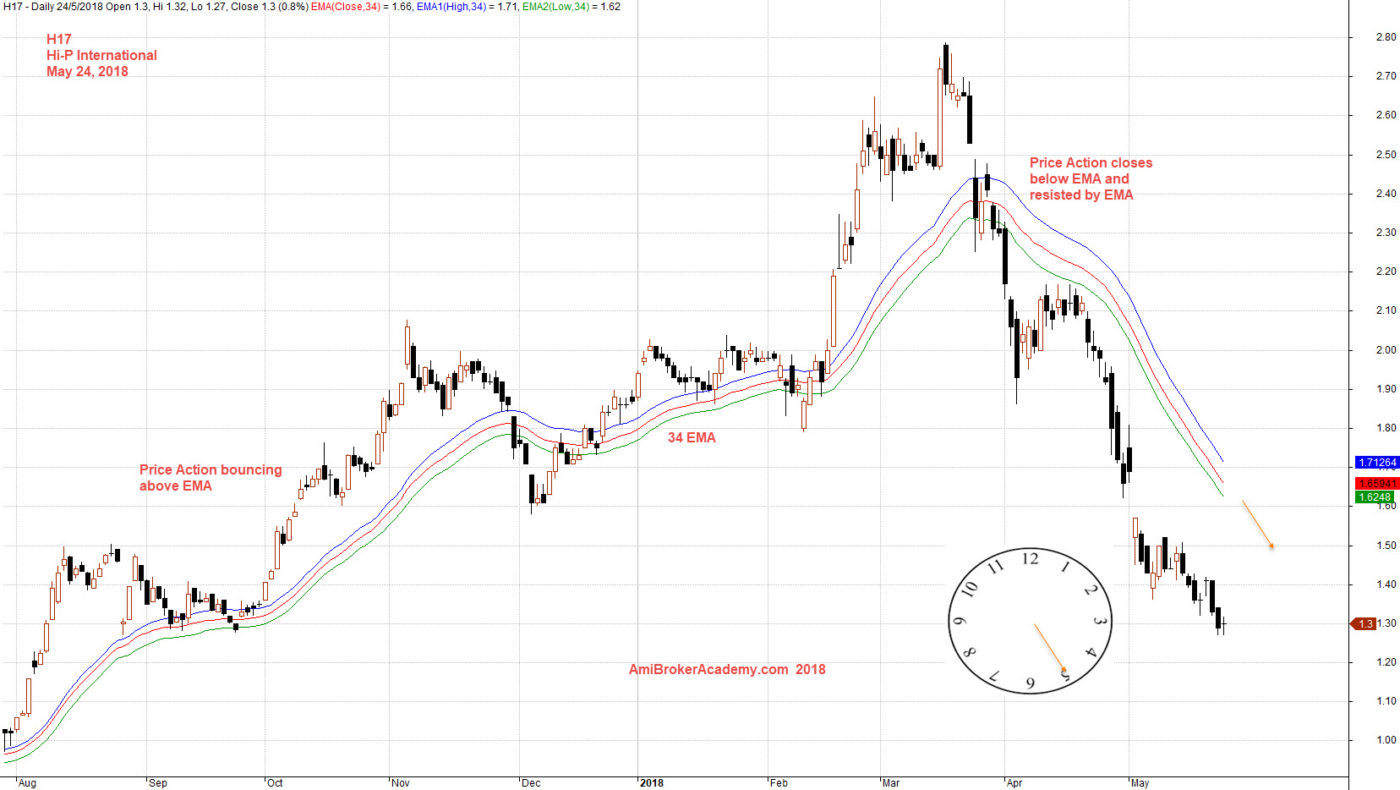
H17 Hi-P International and Moving Average Wave
We use another tool, Moving Average to study the price action. Instead of using one MA, we use high, low and close of 34 period moving average. We call the three MA as MA band, or wave or river. See chart. Picture worth a thousand words.
The price action first bounce above the MS band, and after March this year. the price action close below MA band. Price action resisted by MA Band.
Next, if you observe the MA wave, first it slopping up, after March 2018 the MA wave slopping down. Slopping up is bullish, slopping down is bearish.
Even up trend, or bullish trend you still can go counter trend to sell.
May 24, 2018 Hi-P International and EMA Wave
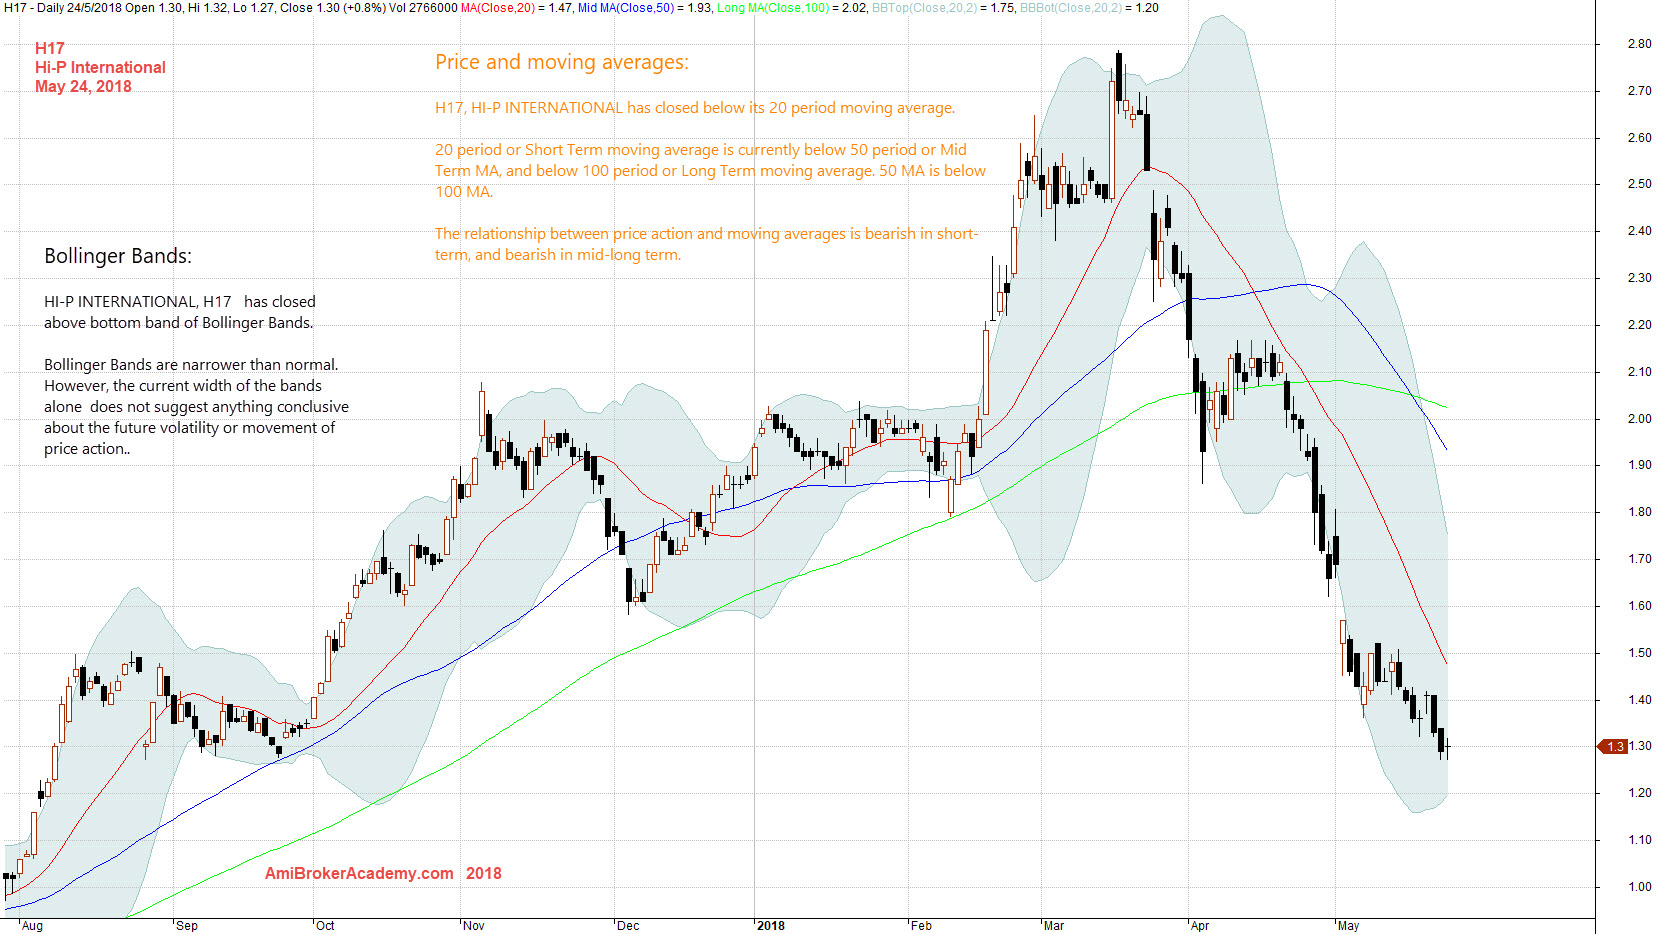
H17 Hi-P International and Moving Average and Bollinger Bands
To study the chart further, use Moving Average and Bollinger bands.
Bollinger Bands:
HI-P INTERNATIONAL, H17 has closed above bottom band of Bollinger Bands.
Bollinger Bands are narrower than normal.
However, the current width of the bands alone does not suggest anything conclusive about the future volatility or movement of price action..
Price and moving averages:
H17, HI-P INTERNATIONAL has closed below its 20 period moving average.
20 period or Short Term moving average is currently below 50 period or Mid Term MA, and below 100 period or Long Term moving average. 50 MA is below 100 MA.
The relationship between price action and moving averages is bearish in short-term, and bearish in mid-long term.
May 24, 2018 Hi-P International and Moving Averages and Bollinger Bands
Moses
AmiBrokerAcademy.com
Disclaimer
The above result is for illustration purpose. It is not meant to be used for buy or sell decision. We do not recommend any particular stocks. If particular stocks of such are mentioned, they are meant as demonstration of Amibroker as a powerful charting software and MACD. Amibroker can program to scan the stocks for buy and sell signals.
These are script generated signals. Not all scan results are shown here. The MACD signal should use with price action. Users must understand what MACD and price action are all about before using them. If necessary you should attend a course to learn more on Technical Analysis (TA) and Moving Average Convergence Divergence, MACD.
Once again, the website does not guarantee any results or investment return based on the information and instruction you have read here. It should be used as learning aids only and if you decide to trade real money, all trading decision should be your own.