26 May, 2018
Thank you for visiting the site. Hope you like the content.
Correlation China Shanghai Stock Index and US Volatility Index
See chart, picture worth a thousand words. What’s the correlation of the two nations? When the fear factor increase the stock market has a great sell off. When the market begin to climb up, the fear factor drops.
So, just an imagination, may be US ^VIX can be use for Asia market like China Shanghai Index. But all setup can fail. Watch out, trade with eyes open.
Manager your trade risk.
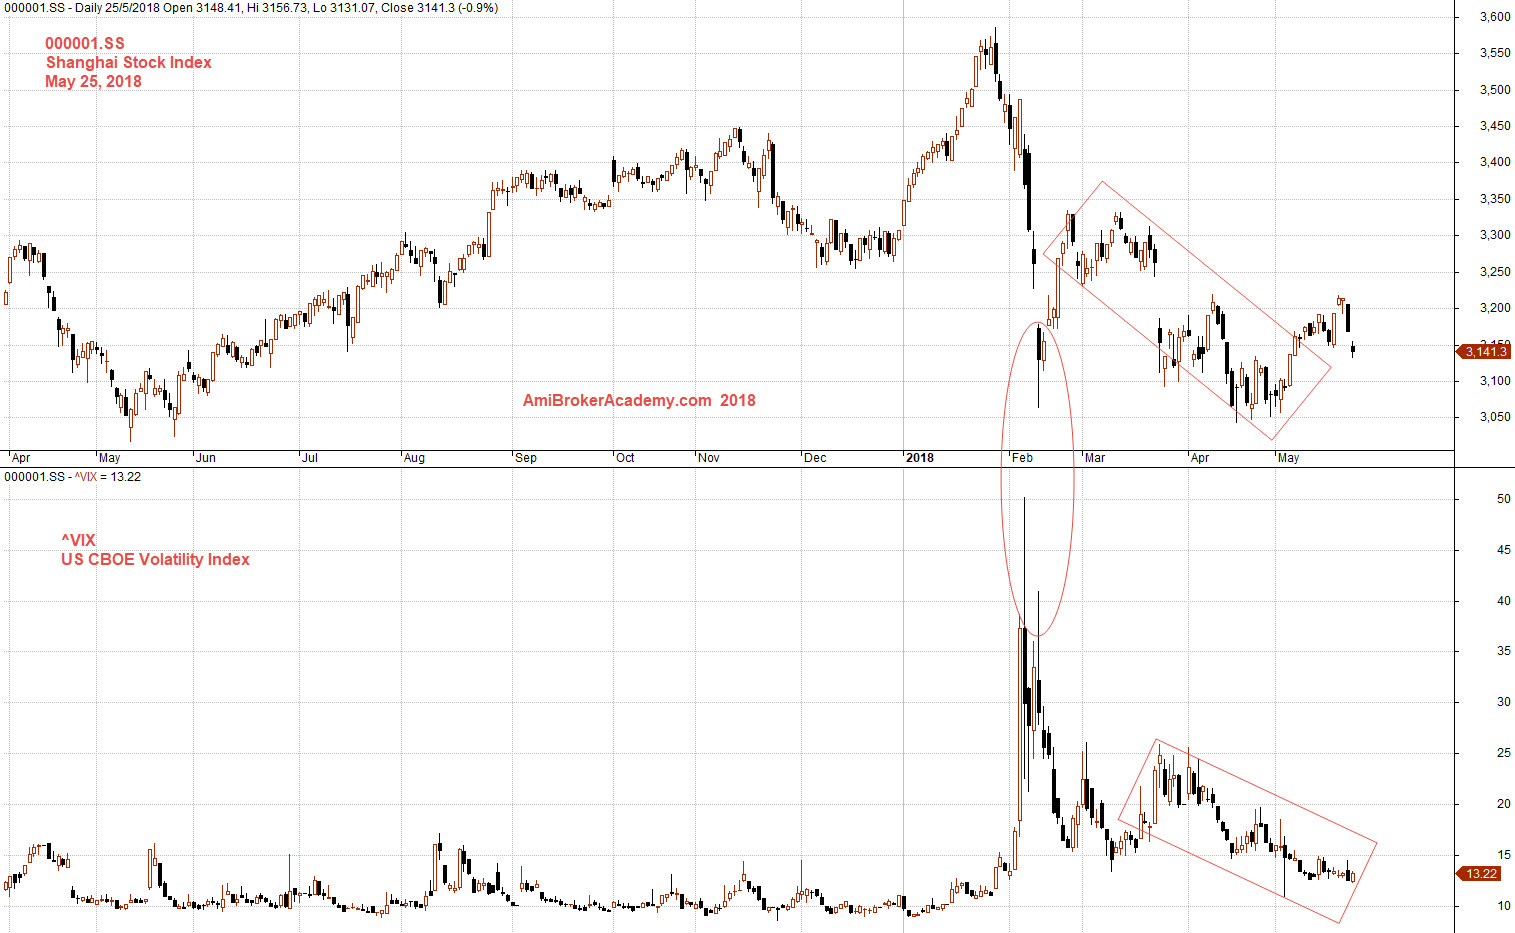
May 25, 2018 Shanghai Stock Index and US Volatility Index Correlation
Free MACD Scan One-day US Stock MACD Screening Results on May 23 2018
Remember all setup can fail. This is true for all indicators. It is also true for MACD signals setup.
But, even the setup can fail. Without the MACD scan results, how to find a stock might moves in the near eight thousand stocks market. The MACD signals at least reduce the among the stocks you need to study and make your trade plan.
Manage your risk.
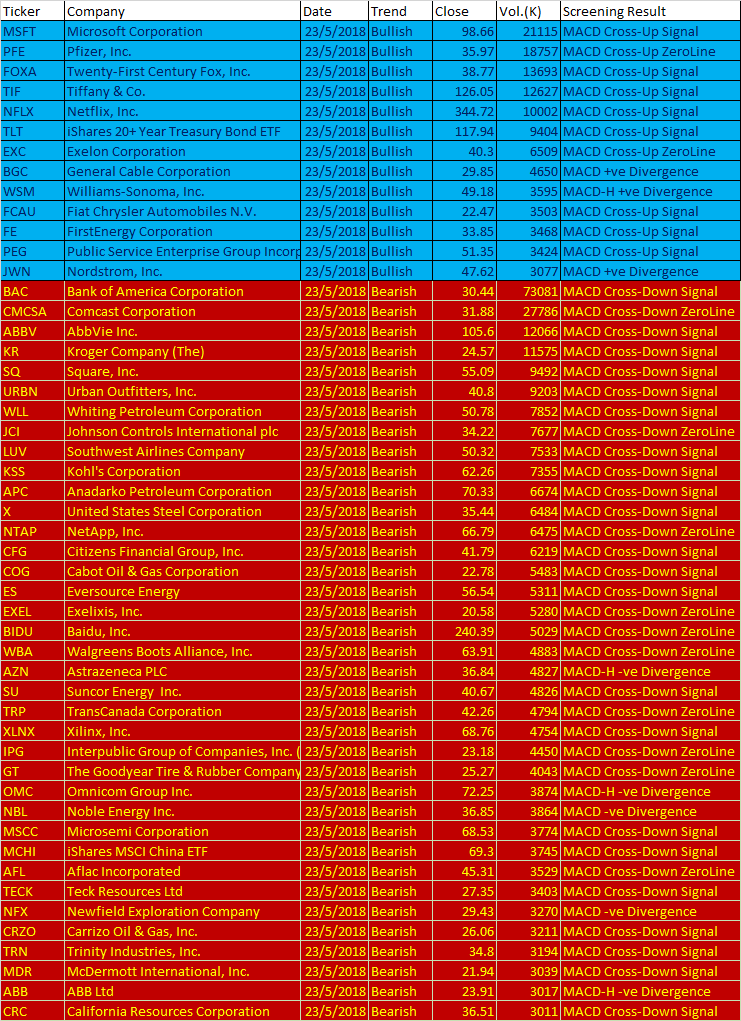
May 23, 2018 US Stock 1-day MACD Screening Results
These are the six types of MACD Signals:
- MACD line crosses above MACD signal – Bullish trend
- MACD line crosses above zero line – Bullish trend
- MACD Histogram +ve Divergence – Bullish trend
- MACD line crosses below MACD signal – Bearish trend
- MACD line crosses below zero line – Bearish trend
- MACD Histogram -ve Divergence – Bearish trend
| Ticker | Company | Date | Trend | Close | Vol.(K) | Screening Result |
| MSFT | Microsoft Corporation | 23/5/2018 | Bullish | 98.66 | 21115 | MACD Cross-Up Signal |
| PFE | Pfizer, Inc. | 23/5/2018 | Bullish | 35.97 | 18757 | MACD Cross-Up ZeroLine |
| FOXA | Twenty-First Century Fox, Inc. | 23/5/2018 | Bullish | 38.77 | 13693 | MACD Cross-Up Signal |
| TIF | Tiffany & Co. | 23/5/2018 | Bullish | 126.05 | 12627 | MACD Cross-Up Signal |
| NFLX | Netflix, Inc. | 23/5/2018 | Bullish | 344.72 | 10002 | MACD Cross-Up Signal |
| TLT | iShares 20+ Year Treasury Bond ETF | 23/5/2018 | Bullish | 117.94 | 9404 | MACD Cross-Up Signal |
| EXC | Exelon Corporation | 23/5/2018 | Bullish | 40.3 | 6509 | MACD Cross-Up ZeroLine |
| BGC | General Cable Corporation | 23/5/2018 | Bullish | 29.85 | 4650 | MACD +ve Divergence |
| WSM | Williams-Sonoma, Inc. | 23/5/2018 | Bullish | 49.18 | 3595 | MACD-H +ve Divergence |
| FCAU | Fiat Chrysler Automobiles N.V. | 23/5/2018 | Bullish | 22.47 | 3503 | MACD Cross-Up Signal |
| FE | FirstEnergy Corporation | 23/5/2018 | Bullish | 33.85 | 3468 | MACD Cross-Up Signal |
| PEG | Public Service Enterprise Group Incorporated | 23/5/2018 | Bullish | 51.35 | 3424 | MACD Cross-Up Signal |
| JWN | Nordstrom, Inc. | 23/5/2018 | Bullish | 47.62 | 3077 | MACD +ve Divergence |
| BAC | Bank of America Corporation | 23/5/2018 | Bearish | 30.44 | 73081 | MACD Cross-Down Signal |
| CMCSA | Comcast Corporation | 23/5/2018 | Bearish | 31.88 | 27786 | MACD Cross-Down ZeroLine |
| ABBV | AbbVie Inc. | 23/5/2018 | Bearish | 105.6 | 12066 | MACD Cross-Down Signal |
| KR | Kroger Company (The) | 23/5/2018 | Bearish | 24.57 | 11575 | MACD Cross-Down Signal |
| SQ | Square, Inc. | 23/5/2018 | Bearish | 55.09 | 9492 | MACD Cross-Down Signal |
| URBN | Urban Outfitters, Inc. | 23/5/2018 | Bearish | 40.8 | 9203 | MACD Cross-Down Signal |
| WLL | Whiting Petroleum Corporation | 23/5/2018 | Bearish | 50.78 | 7852 | MACD Cross-Down Signal |
| JCI | Johnson Controls International plc | 23/5/2018 | Bearish | 34.22 | 7677 | MACD Cross-Down ZeroLine |
| LUV | Southwest Airlines Company | 23/5/2018 | Bearish | 50.32 | 7533 | MACD Cross-Down Signal |
| KSS | Kohl’s Corporation | 23/5/2018 | Bearish | 62.26 | 7355 | MACD Cross-Down Signal |
| APC | Anadarko Petroleum Corporation | 23/5/2018 | Bearish | 70.33 | 6674 | MACD Cross-Down Signal |
| X | United States Steel Corporation | 23/5/2018 | Bearish | 35.44 | 6484 | MACD Cross-Down Signal |
| NTAP | NetApp, Inc. | 23/5/2018 | Bearish | 66.79 | 6475 | MACD Cross-Down ZeroLine |
| CFG | Citizens Financial Group, Inc. | 23/5/2018 | Bearish | 41.79 | 6219 | MACD Cross-Down Signal |
| COG | Cabot Oil & Gas Corporation | 23/5/2018 | Bearish | 22.78 | 5483 | MACD Cross-Down Signal |
| ES | Eversource Energy | 23/5/2018 | Bearish | 56.54 | 5311 | MACD Cross-Down Signal |
| EXEL | Exelixis, Inc. | 23/5/2018 | Bearish | 20.58 | 5280 | MACD Cross-Down ZeroLine |
| BIDU | Baidu, Inc. | 23/5/2018 | Bearish | 240.39 | 5029 | MACD Cross-Down ZeroLine |
| WBA | Walgreens Boots Alliance, Inc. | 23/5/2018 | Bearish | 63.91 | 4883 | MACD Cross-Down ZeroLine |
| AZN | Astrazeneca PLC | 23/5/2018 | Bearish | 36.84 | 4827 | MACD-H -ve Divergence |
| SU | Suncor Energy Inc. | 23/5/2018 | Bearish | 40.67 | 4826 | MACD Cross-Down Signal |
| TRP | TransCanada Corporation | 23/5/2018 | Bearish | 42.26 | 4794 | MACD Cross-Down ZeroLine |
| XLNX | Xilinx, Inc. | 23/5/2018 | Bearish | 68.76 | 4754 | MACD Cross-Down Signal |
| IPG | Interpublic Group of Companies, Inc. (The) | 23/5/2018 | Bearish | 23.18 | 4450 | MACD Cross-Down ZeroLine |
| GT | The Goodyear Tire & Rubber Company | 23/5/2018 | Bearish | 25.27 | 4043 | MACD Cross-Down ZeroLine |
| OMC | Omnicom Group Inc. | 23/5/2018 | Bearish | 72.25 | 3874 | MACD-H -ve Divergence |
| NBL | Noble Energy Inc. | 23/5/2018 | Bearish | 36.85 | 3864 | MACD -ve Divergence |
| MSCC | Microsemi Corporation | 23/5/2018 | Bearish | 68.53 | 3774 | MACD Cross-Down Signal |
| MCHI | iShares MSCI China ETF | 23/5/2018 | Bearish | 69.3 | 3745 | MACD Cross-Down Signal |
| AFL | Aflac Incorporated | 23/5/2018 | Bearish | 45.31 | 3529 | MACD Cross-Down ZeroLine |
| TECK | Teck Resources Ltd | 23/5/2018 | Bearish | 27.35 | 3403 | MACD Cross-Down Signal |
| NFX | Newfield Exploration Company | 23/5/2018 | Bearish | 29.43 | 3270 | MACD -ve Divergence |
| CRZO | Carrizo Oil & Gas, Inc. | 23/5/2018 | Bearish | 26.06 | 3211 | MACD Cross-Down Signal |
| TRN | Trinity Industries, Inc. | 23/5/2018 | Bearish | 34.8 | 3194 | MACD Cross-Down Signal |
| MDR | McDermott International, Inc. | 23/5/2018 | Bearish | 21.94 | 3039 | MACD Cross-Down Signal |
| ABB | ABB Ltd | 23/5/2018 | Bearish | 23.91 | 3017 | MACD-H -ve Divergence |
| CRC | California Resources Corporation | 23/5/2018 | Bearish | 36.51 | 3011 | MACD Cross-Down Signal |
Moses US Stock ScanYou must understand what MACD is all about before using the results.
AmiBroker Academy.com
Disclaimer:
The above result is for illustration purpose. It is not meant to be used for buy or sell decision. We do not recommend any particular stocks. If particular stocks of such are mentioned, they are meant as demonstration of Amibroker as a powerful charting software and MACD. Amibroker can program to scan the stocks for buy and sell signals.
These are script generated signals. Not all scan results are shown here. The MACD signal should use with price action. Users must understand what MACD and price action are all about before using them. If necessary you should attend a course to learn more on Technical Analysis (TA) and Moving Average Convergence Divergence, MACD.
Once again, the website does not guarantee any results or investment return based on the information and instruction you have read here. It should be used as learning aids only and if you decide to trade real money, all trading decision should be your own.