20 July 2022
Welcome!
Welcome to AmiBroker Academy dot com, amibrokeracademy.com.
If There is Only One Chart This is It
Moses Power Stock Chart.
We Believe – Buy Support or Sell Resistance.
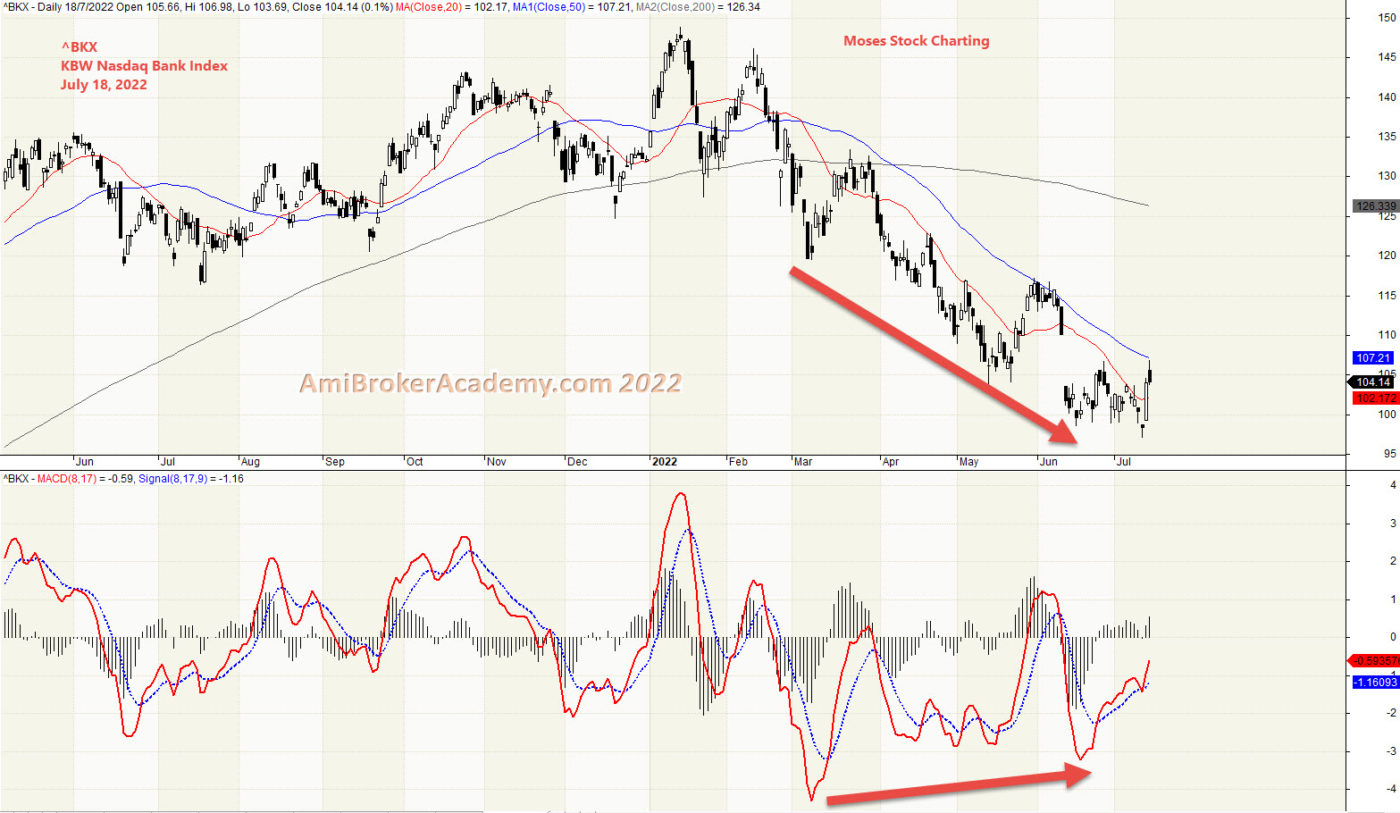
Bank Index
There are literally thousands of other options when it comes to these digital currencies. Majority of the cryptocurrency is deep, and study some index to under the market emotion. One thing to look at is bank index. such as ^BKX, BKW NASDAQ Bank Index.
Price Action reflect the market emotions, it factor in news, buy or sell emotions.
When the market is bullish, how you trade you eventually still make money. When the market is sideways. You have to ride the wave on buy the bull bias and sell when it is bear.
There are a lot of uncertainty in the current market, many whom make money on crypto are liquidating now to keep themself a float.
We study the stock chart using GMMA, Woodies CCI, MACD, River, Bollinger Bands and Moving Average with the price action.
Moving Average is a great visual tool. MACD indicator is a easy to understand indicator. Support and Resistance is important and fundamental tool for trading.
When the price action continue to move higher but MACD is weaker, the price action may be change in direction. The opposite is true too, when price action is weaker, forming lower low but the MACD or MACD Histogram is forming higher low. Price action is also may be change in direction.
But remember indicator is like traffic light, it provides you a heads-up.
Manage your trade.
Think Think got more Things
In trading, some predict the up or down on the trend. Here, we look for support, strong support to buy. Or take profit when price action test the resistance.
1) ^BKX NASDAQ Bank Index and MACD
2022 is the peak thereafter price goes south, price action hit the low in July. Price Action retest the low a few times.
Price goes lower but the MACD forms higher low. Can the price action rebounce? Will see.
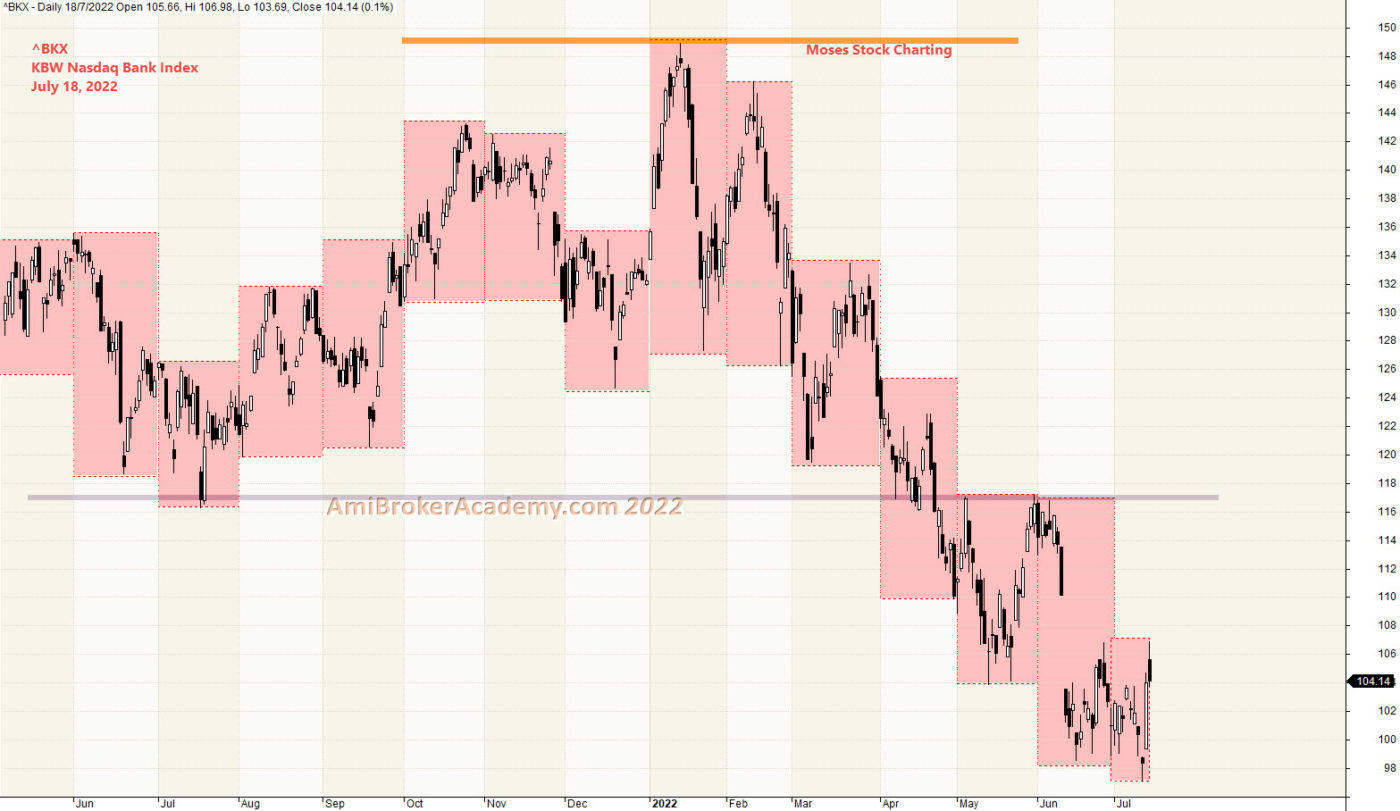
2) NASDAQ Bank Index and Month High Low
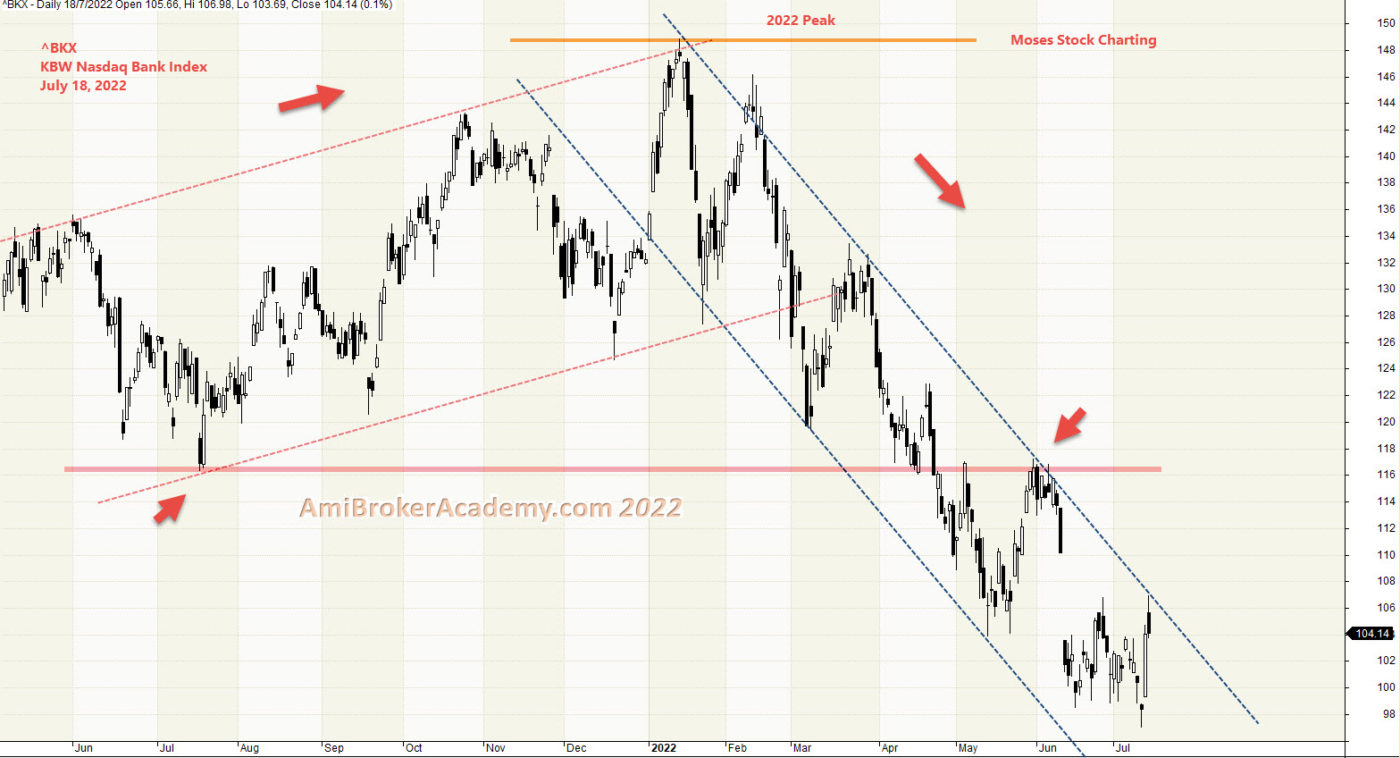
3) KBW NASDAQ Bank Index Price Action and Equal Distance Channel
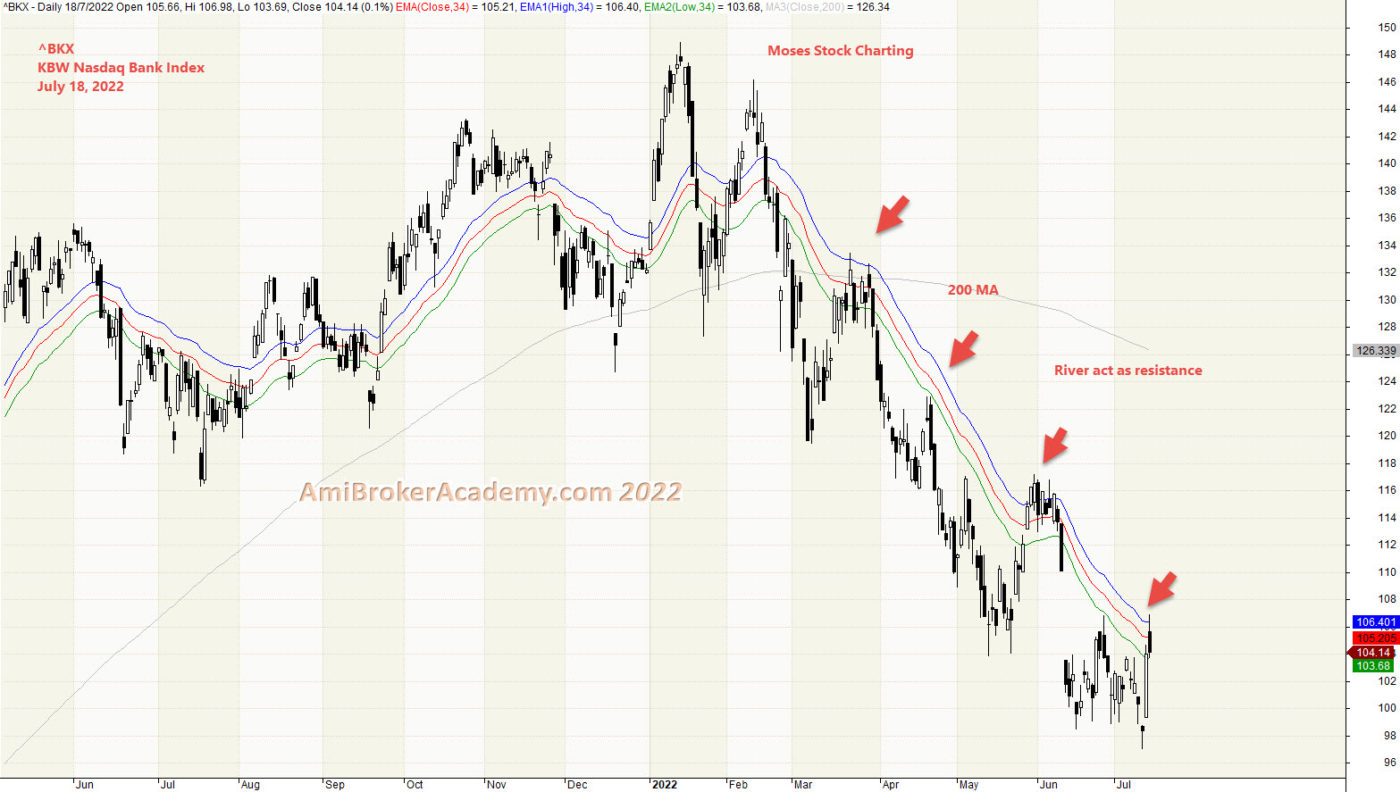
4) KBW NASDAQ Bank Index and River
Price Action close below River and resisted by River. River after zigzag and begin to slop down. Bearish.
Moses Power Charting
Official AmiBrokerAcademy.com Charting
Disclaimer
The above result is for illustration purpose. It is meant to be used for learning buy or sell signals. We do not recommend for any particular stocks. If particular stocks of such are mentioned, they are meant as a demonstration of Amibroker as a powerful charting software. Amibroker is a charting software, it can program to scan the stocks for buy and sell signals. Or backtest for any trading strategy or technique.
We post script generated signals. Not all scan results are shown here depending on selection criterial. The MACD signal should use with price action. Users must understand what MACD and price action are all about before using them. If necessary you should attend a course to learn more on Technical Analysis (TA) and Moving Average Convergence Divergence, MACD.
Once again, the website does not guarantee any results or investment return based on the information and instruction you have read here. It should be used as learning aids only and if you decide to trade real money, all trading decision should be your own.
We learn from many past and present great traders. Kudo to these master.