October 15, 2018
Thanks for visiting the site.
Moses Stock Stories – Thinking Out Loud
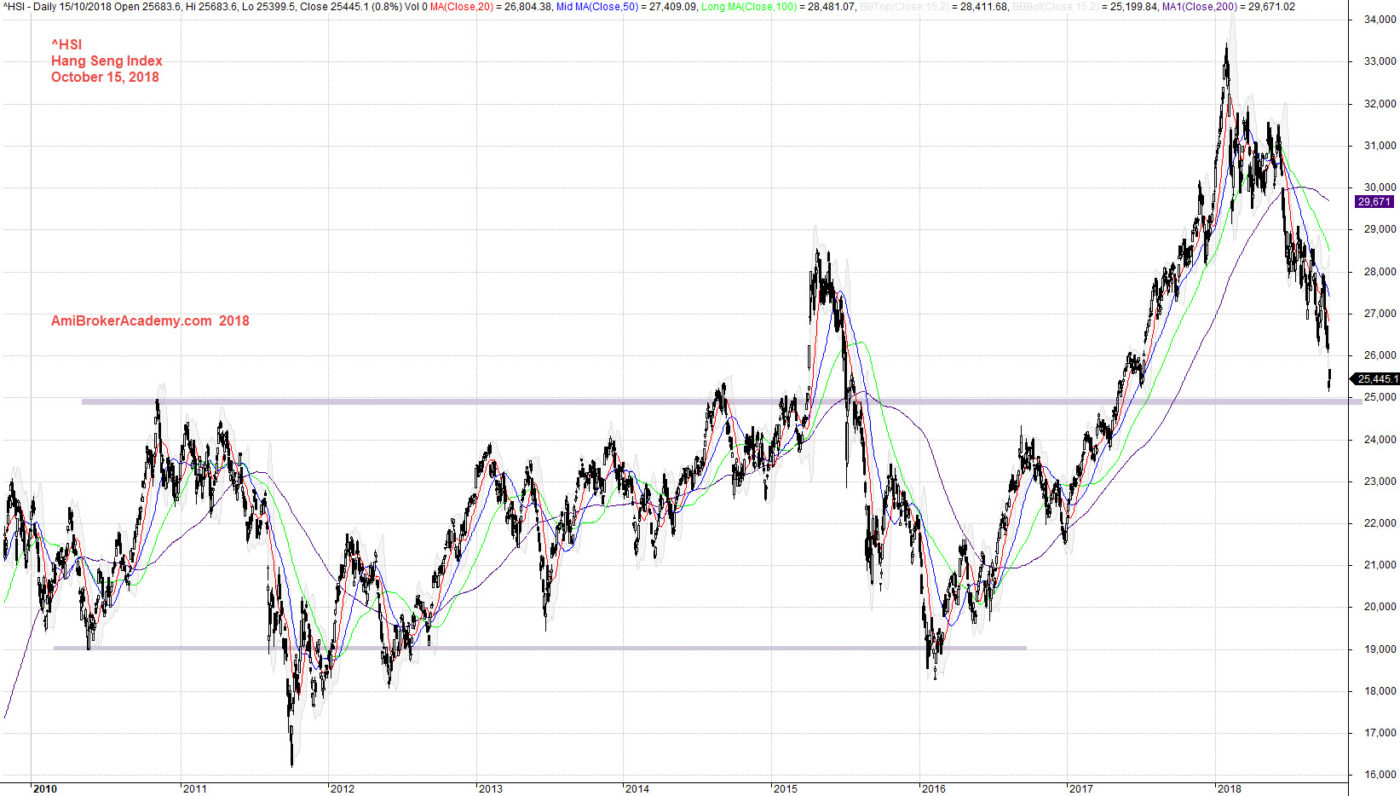
^HSI Hang Seng Index Charting
Study Hong Kong Hang Seng stock index, see chart picture worth a thousand words. We added moving averages, 20, 50 and 100 period. The three moving averages form a colourful band. See the price action from 2012 from low near 16,000 to go bull, to now in 2018 the HSI is above 33,000. The index has nearly double.
Trade with your eyes open.
Manage Your Risk!
October 15, 2018 Hang Seng Index Buy Hold Strategy
If you can see the whole chart, “press Ctrl and -” to zoom out to see the entire chart.
Add MACD indicator, see chart, picture worth a thousand words.
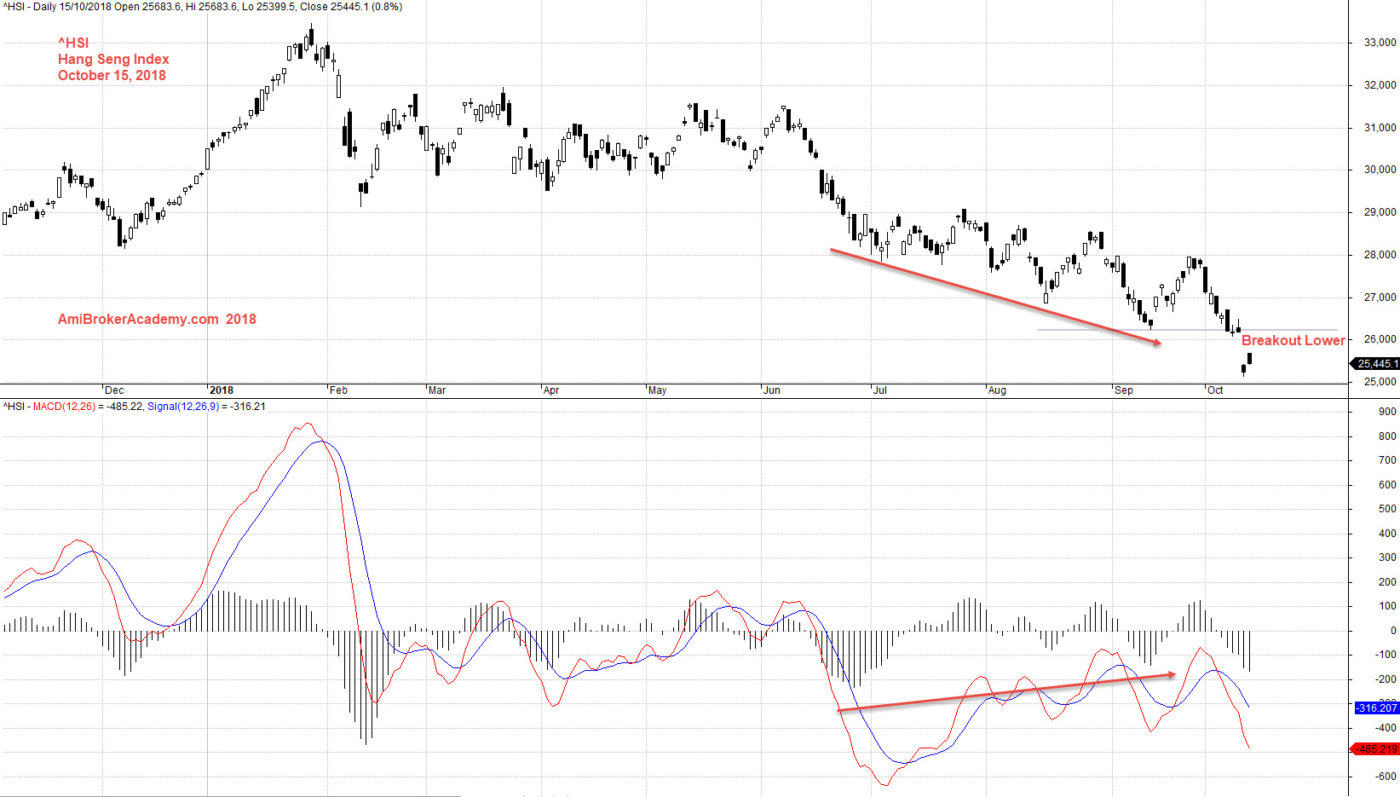
October 15, 2018 Hang Seng Index and MACD
Moses
AmiBrokerAcademy.com
Disclaimer
The above result is for illustration purpose. It is not meant to be used for buy or sell decision. We do not recommend any particular stocks. If particular stocks of such are mentioned, they are meant as demonstration of Amibroker as a powerful charting software and MACD. Amibroker can program to scan the stocks for buy and sell signals.
These are script generated signals. Not all scan results are shown here. The MACD signal should use with price action. Users must understand what MACD and price action are all about before using them. If necessary you should attend a course to learn more on Technical Analysis (TA) and Moving Average Convergence Divergence, MACD.
Once again, the website does not guarantee any results or investment return based on the information and instruction you have read here. It should be used as learning aids only and if you decide to trade real money, all trading decision should be your own.