October 15, 2018
Thanks for visiting the site.
‘October Effect’
October effect is a theory that stocks tend to decline during the month of October. See chart, ^VIX fear factor increase, which is opposite from the Index. Such as NASDAQ Composite Index is declined.
Moses Stock Stories
^VIX Volatility Index Charting
Study Volatility index, see price action picture worth a thousand words. Volatility Index is also known as fear indicator. The bigger the number indicates the market is lack in confident.
See chart, the “October Effect”, the price action has zoomed up. As the price action as NASDAQ Composite Index decline.
Trade with your eyes open.
Manage Your Risk!
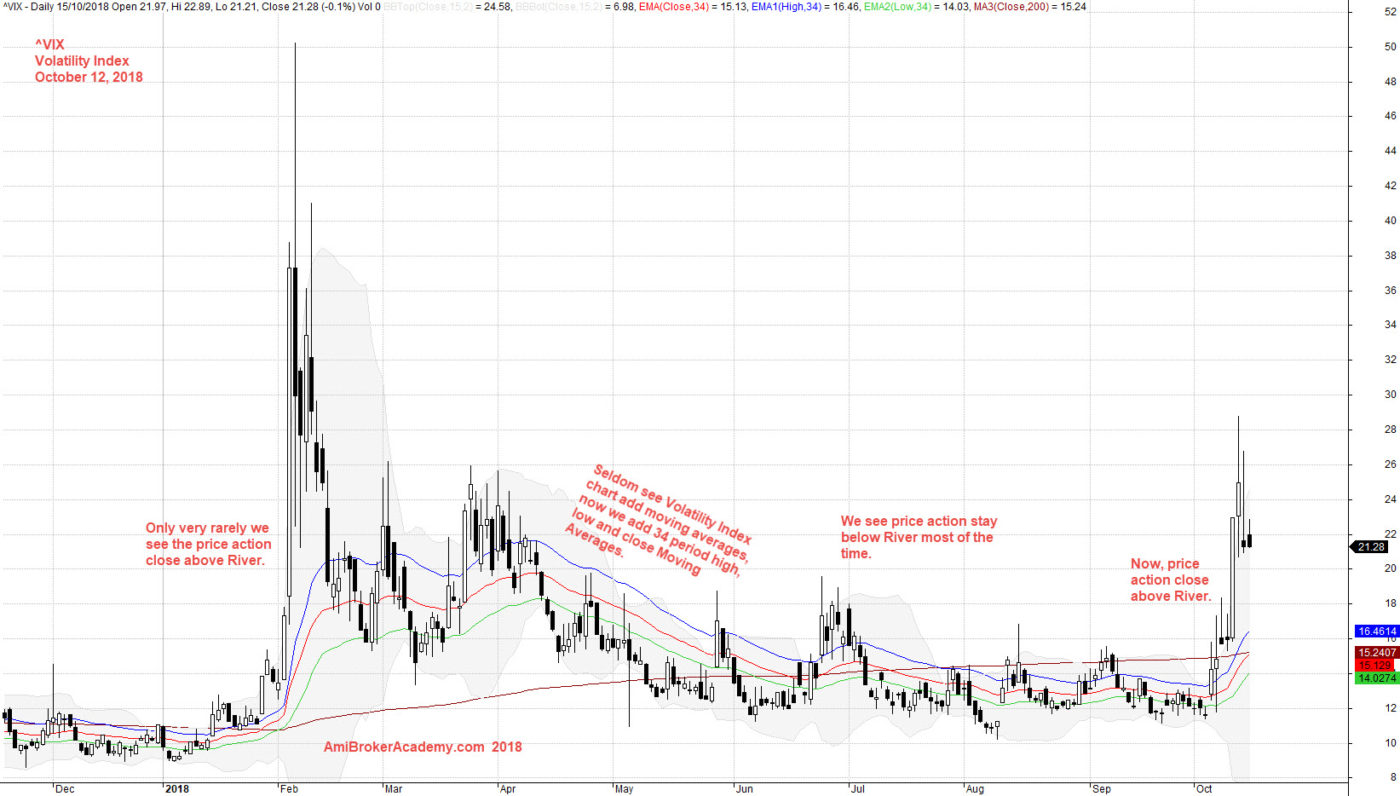
October 15, 2018 Volatility Index and River
If you can see the whole chart, “press Ctrl and -” to zoom out to see the entire chart.
Add MACD indicator, see chart.
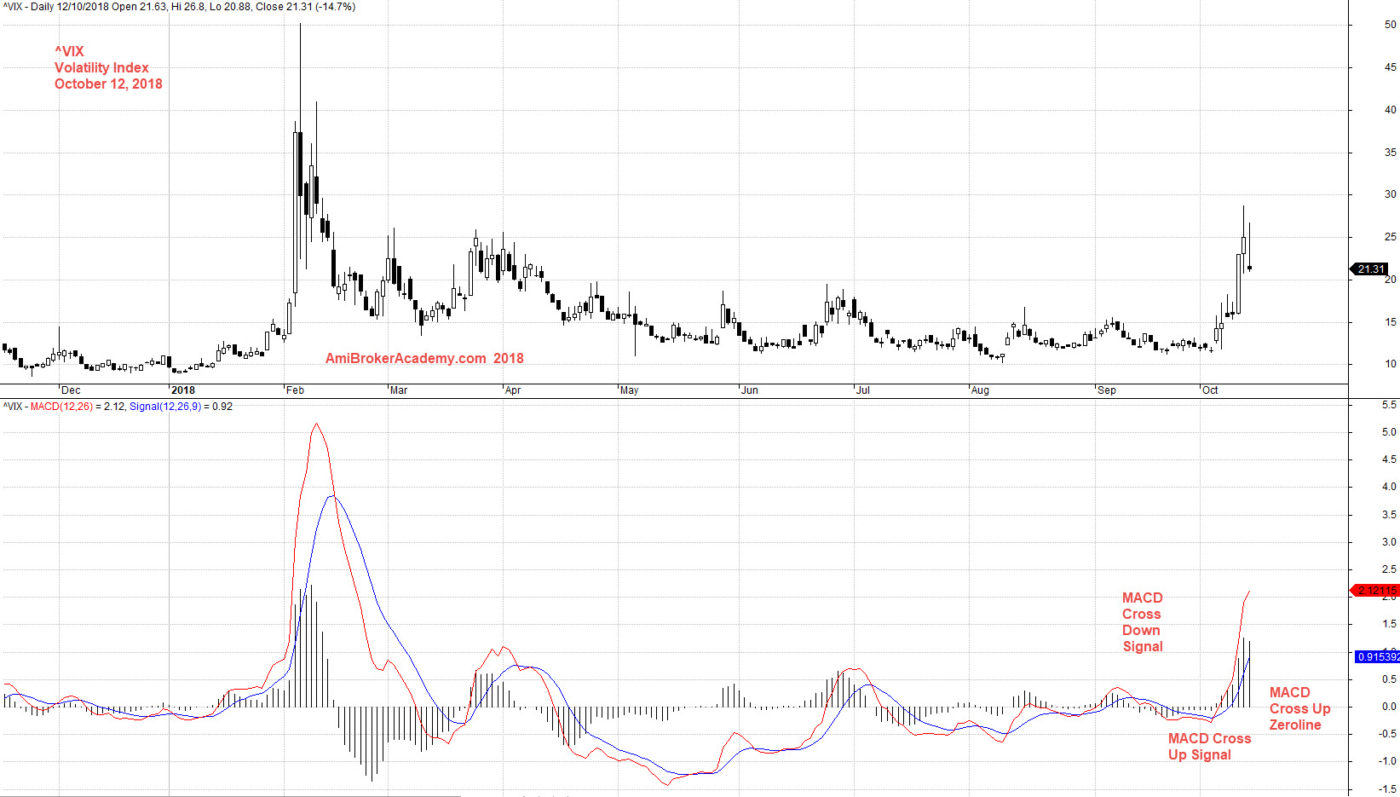
October 12, 2018 Volatility Index and MACD
Moses
AmiBrokerAcademy.com
Disclaimer
The above result is for illustration purpose. It is not meant to be used for buy or sell decision. We do not recommend any particular stocks. If particular stocks of such are mentioned, they are meant as demonstration of Amibroker as a powerful charting software and MACD. Amibroker can program to scan the stocks for buy and sell signals.
These are script generated signals. Not all scan results are shown here. The MACD signal should use with price action. Users must understand what MACD and price action are all about before using them. If necessary you should attend a course to learn more on Technical Analysis (TA) and Moving Average Convergence Divergence, MACD.
Once again, the website does not guarantee any results or investment return based on the information and instruction you have read here. It should be used as learning aids only and if you decide to trade real money, all trading decision should be your own.