15 October, 2018
Thanks for visiting the site.
Moses Stock Stories – Think Think Got More Things
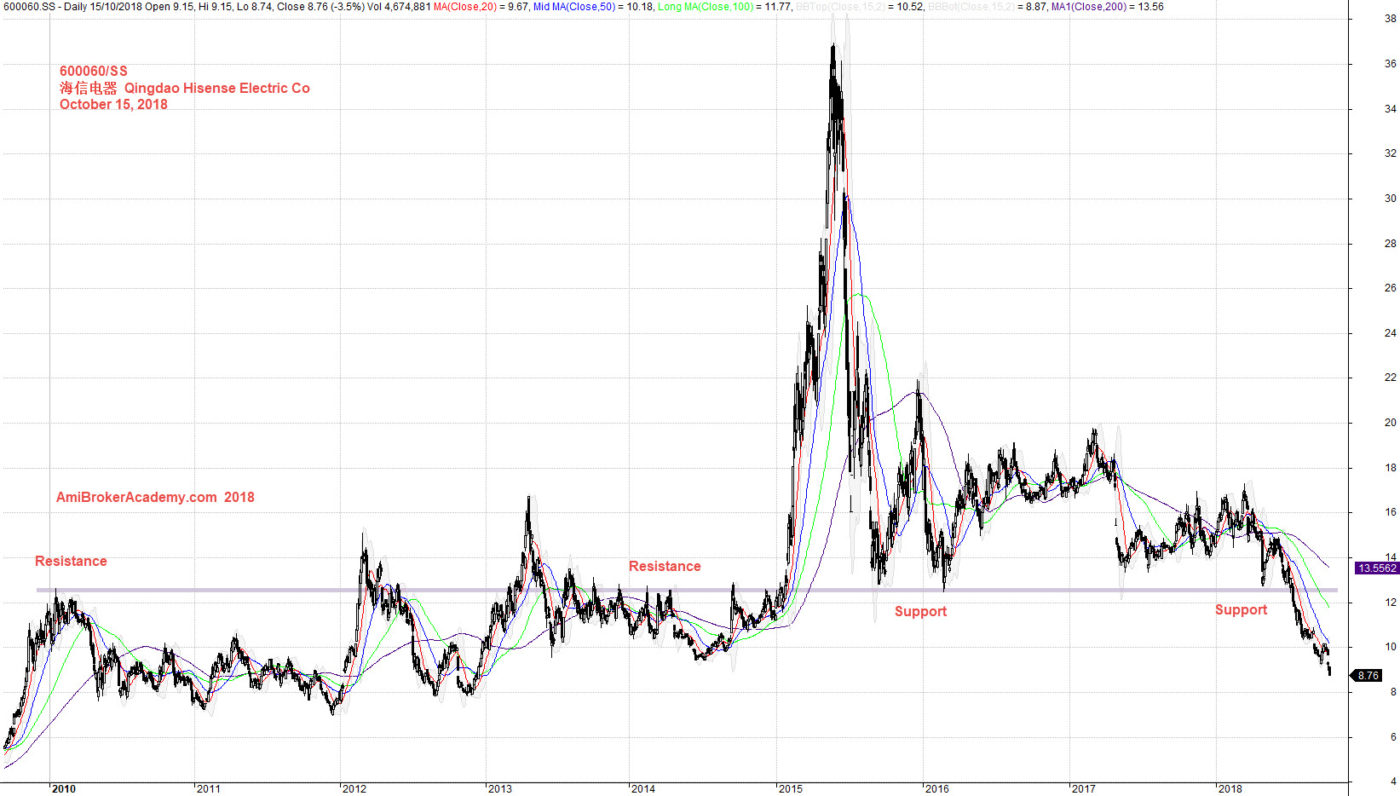
600060.SS 海信电器 Qingdao Hisense Electric Co Charting
We study 海信电器 Qingdao Hisense Electric Co stock chart. We see 海信电器 first on a sideways, then follow a sharp jump up in 2015. The same year, the price action return to the low again. If you can draw the support resistance level as we added on the chart. You actually can predict the place where the price will return. So, don’t play play.
Manage Your Risk!
October 15, 2018 海信电器 Qingdao Hisense Electric Co Buy Hold Strategy
If you can see the whole chart, “press Ctrl and -” to zoom out to see the entire chart.
Add MACD indicator, see the price action and MACD. Trade with your eyes open. Manage your risk.
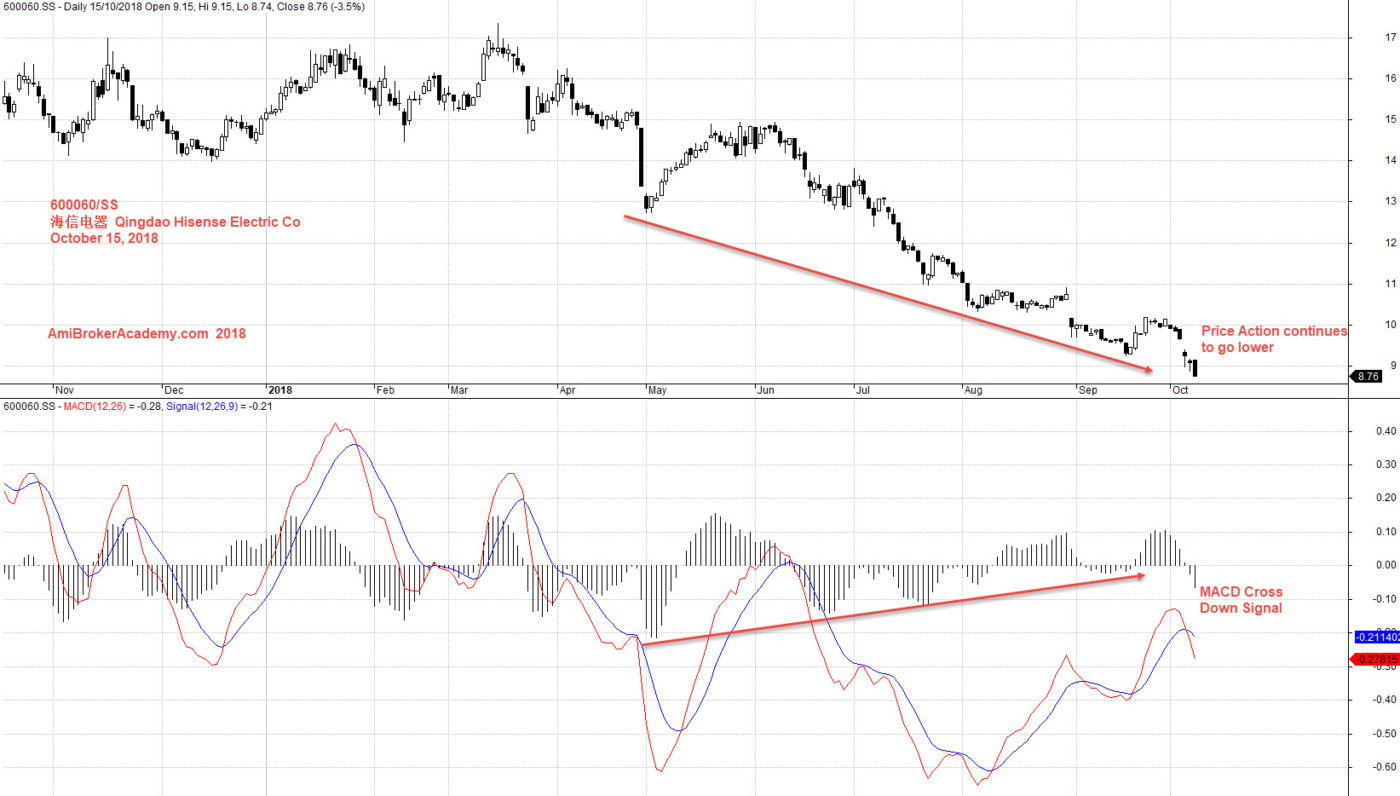
October 15, 2018 海信电器 Qingdao Hisense Electric Co and MACD
Moses
AmiBrokerAcademy.com
Disclaimer
The above result is for illustration purpose. It is not meant to be used for buy or sell decision. We do not recommend any particular stocks. If particular stocks of such are mentioned, they are meant as demonstration of Amibroker as a powerful charting software and MACD. Amibroker can program to scan the stocks for buy and sell signals.
These are script generated signals. Not all scan results are shown here. The MACD signal should use with price action. Users must understand what MACD and price action are all about before using them. If necessary you should attend a course to learn more on Technical Analysis (TA) and Moving Average Convergence Divergence, MACD.
Once again, the website does not guarantee any results or investment return based on the information and instruction you have read here. It should be used as learning aids only and if you decide to trade real money, all trading decision should be your own.