Welcome to AmiBroker Academy dot com, amibrokeracademy.com.
We will use 1) Ichimoku Cloud, 2) Support Resistance (using box), 3) River (moving average), 4) GMMA and Woodies CCI, 5) Bollinger Bands and Moving Averages, and 6) MACD to analyze price action. We also analyze crypto currency price action. See our posting for Bitcoin and other popular cryptocurries.
What we do is to translate price action chart into layman language for you to understand, ie Picture worth a thousand words. You can learn this too. All analysis read the price action chart differently. It is just like an essay, all reader will have different conclusion.
Trade well.
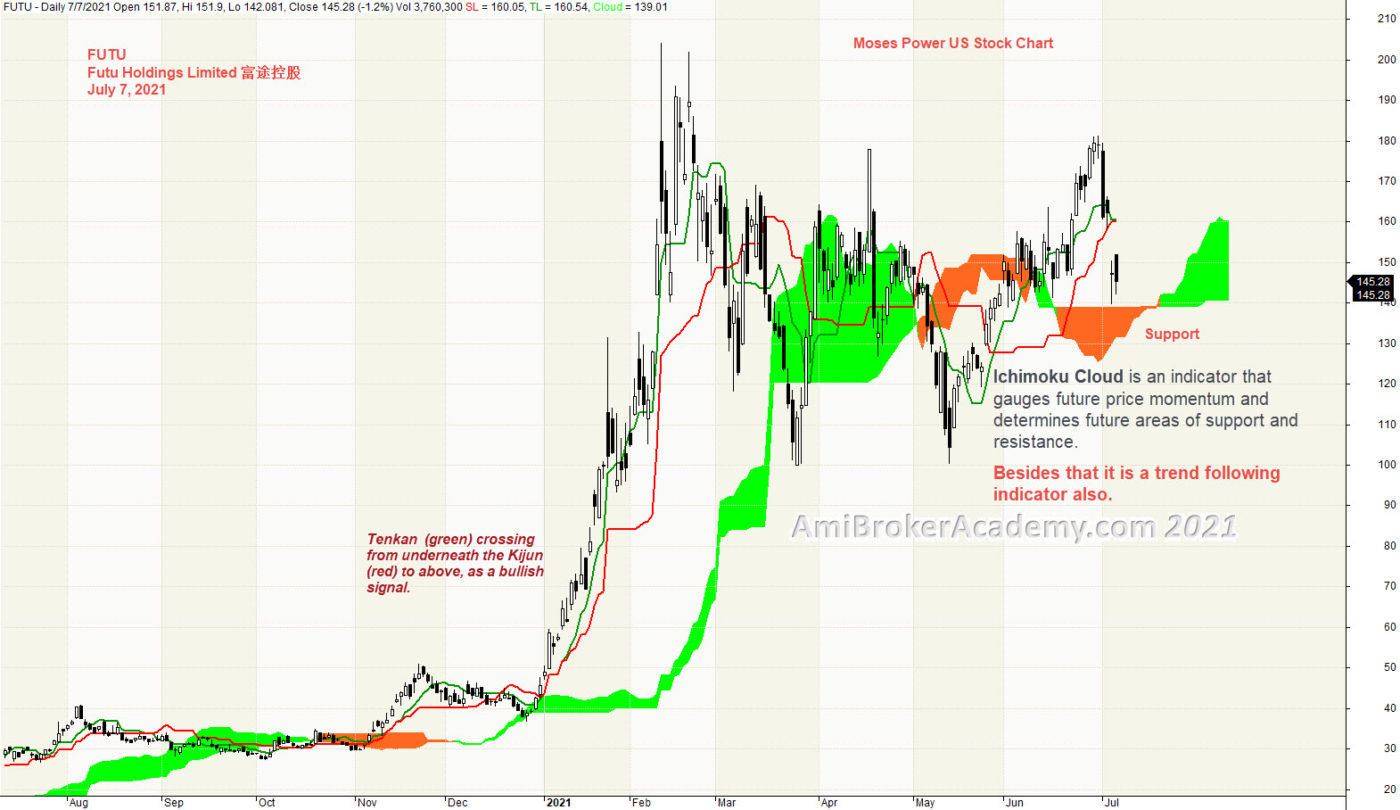
1) FUTU | Futu Holdings 富途控股 and Ichimoku Cloud
Ichimoku Cloud is a trend following strategy tool. We see Tenkan Sen trending up from last December till February this year. In between, Tenkan cross below Kijun and rebounce. Bull trend has ended in February this year. Tenkan Sen begin to zigzag Kijun a few times, price action is in the cloud. Price Action goes sideways.
Ichimoku Cloud is a multi-dimensional indicator designed to offer support and resistance levels, trending, and entry and exit points. Besides that, Ichimoku is an indicator that gauges future price momentum and determine futures areas of support and resistance. Price Action seems to get support from the cloud.
Trade what you see. See a potential support.
Manage risk is a key in trading.
FUTU power a popular trading platform on iPhone, moomoo.
Moses Free Charting
20210707 Futu Holdings 富途控股 and Ichimoku Cloud
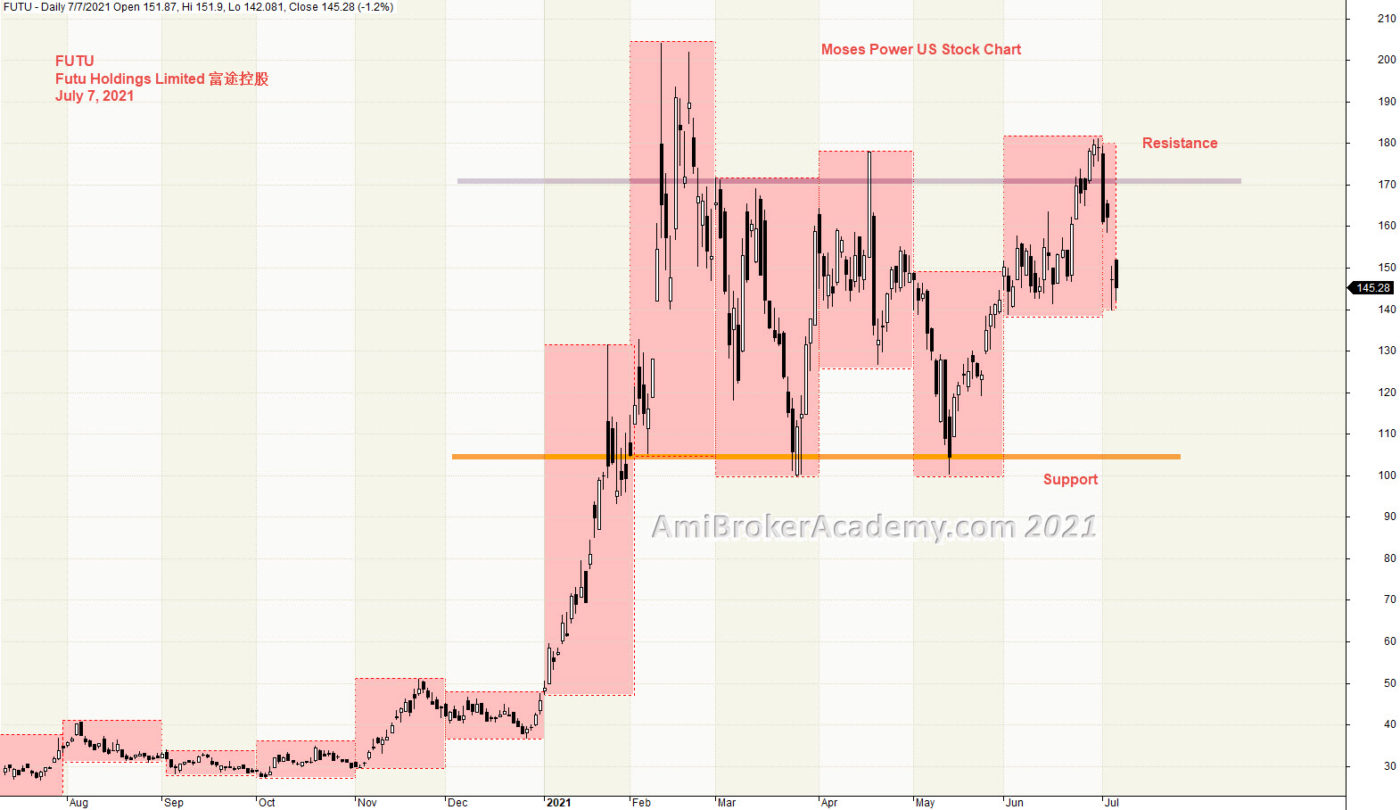
2) Futu Holdings 富途控股 and Support Resistance
Price Action goes from low to high. You can see price action goes from bottom in last December to top in February. Next the price action is moving in sideways. See chart.
We use box to box month high low to find a key level. See chart. We have plotted two strong levels. Resistance turns Support. Can the support hold the price action? Will see.
Trade what you see. Manage your risk.
20210707 Futu Holdings 富途控股 and Support Resistance
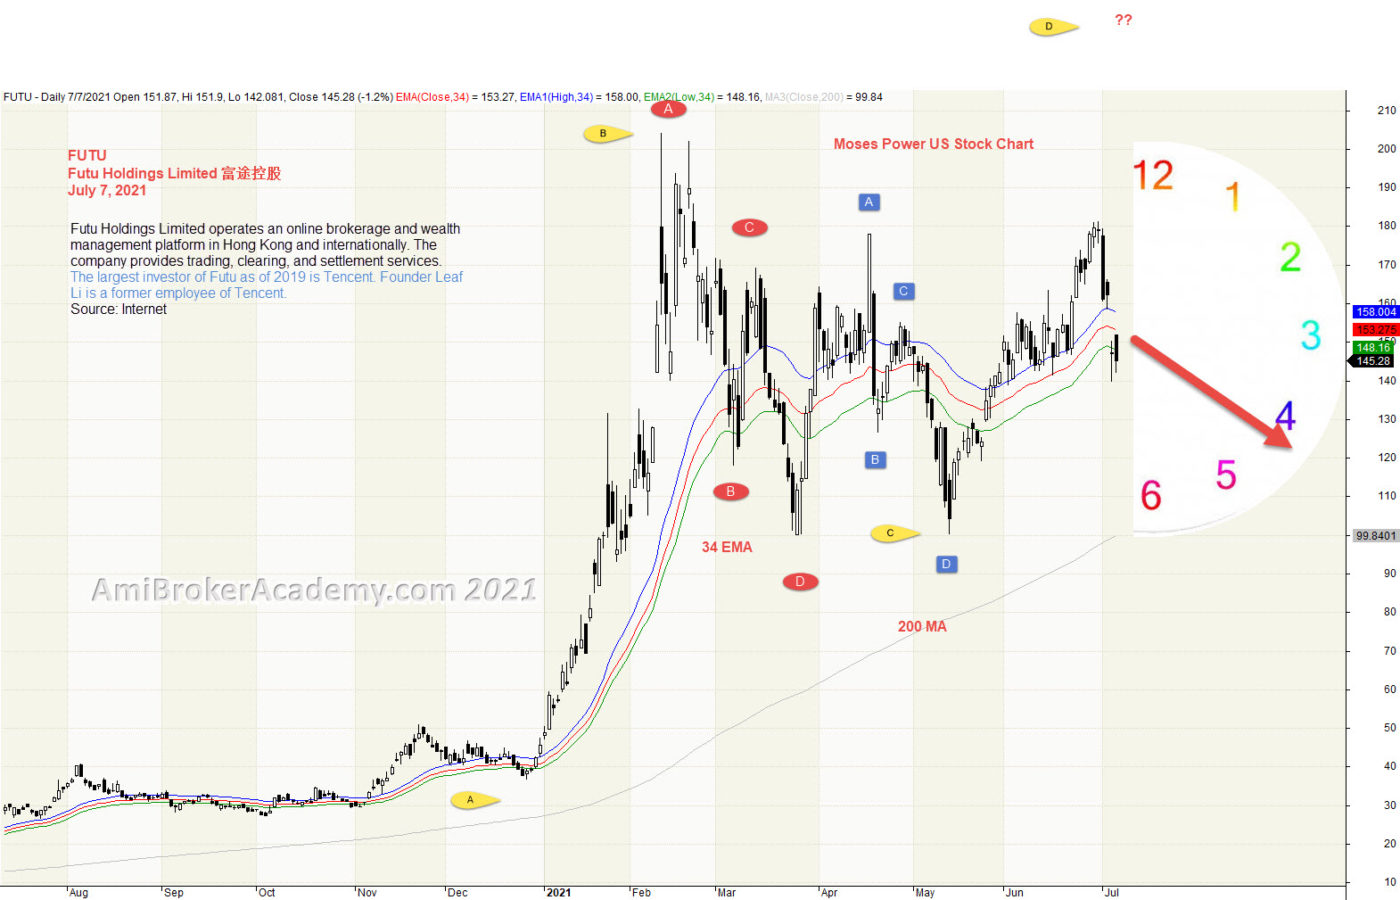
3) Futu Holdings 富途控股 and River
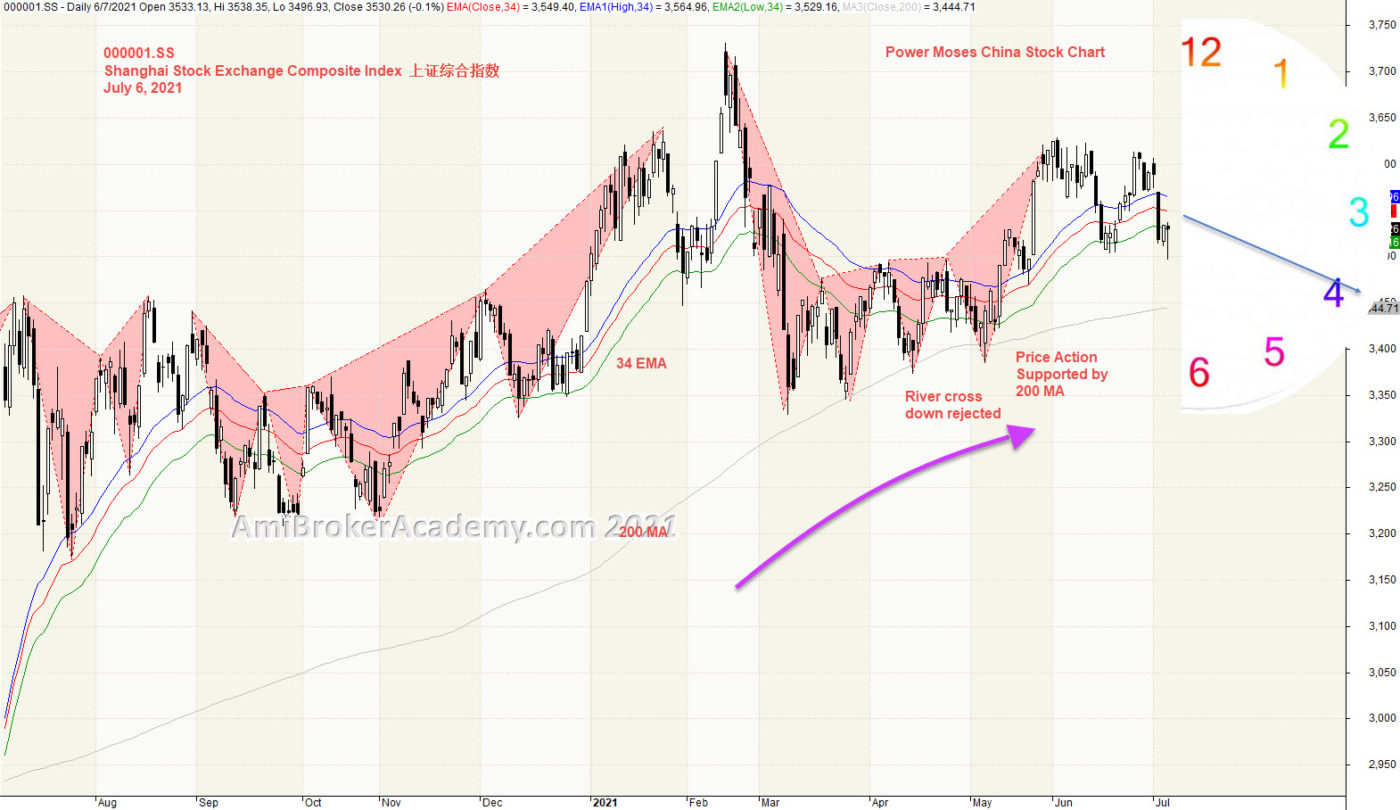
Moving Average is a great visual tool. Raghee uses high, low and close 34 EMA to form a band to determine the wave direction. Price action goes from below 34 EMA to above River, bull trend? Price Action finally zigzag along River, price action seems in sideways. Trade what you see.
Overall bull trend seems strong, price action above 200 MA and 200 MA slopping up.
Manage your risk.
20210707 Futu Holdings 富途控股 and River
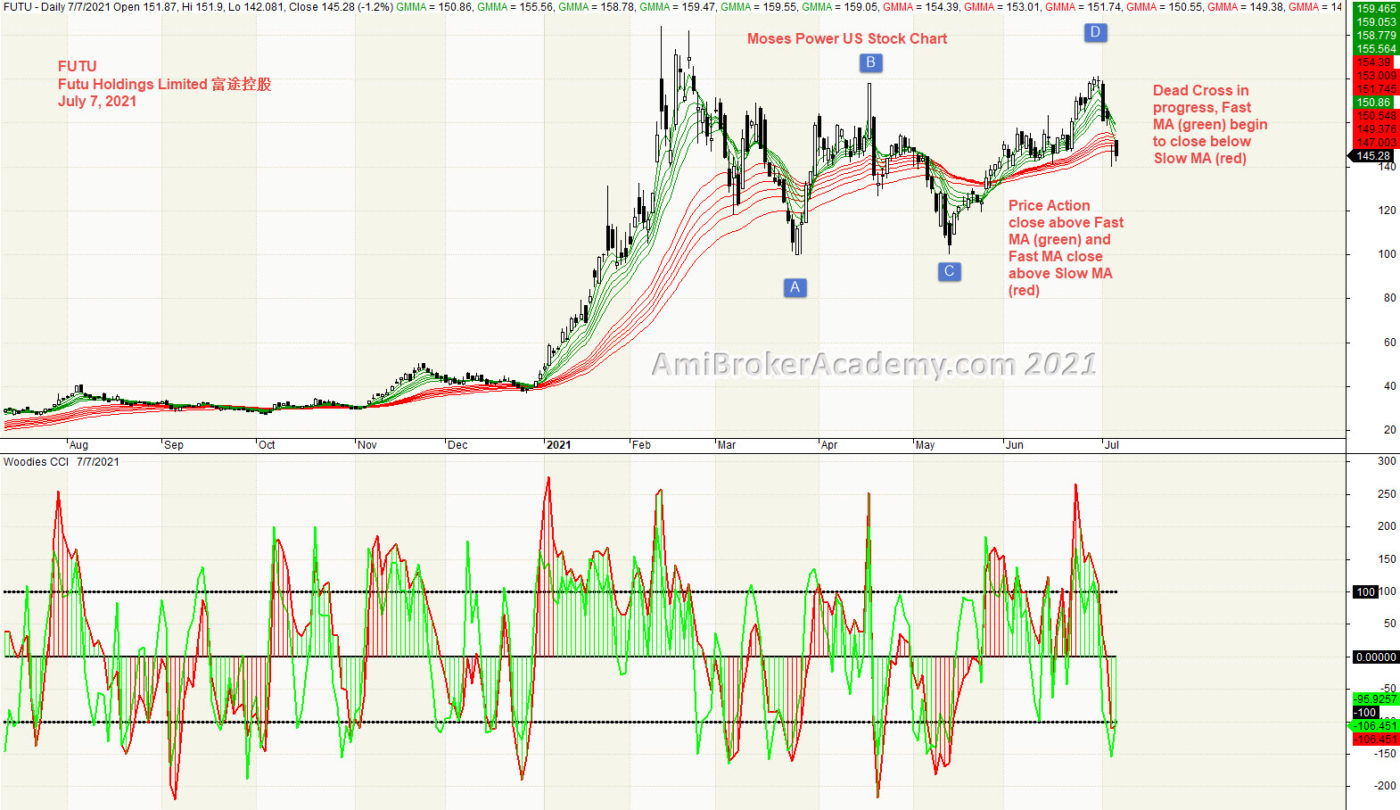
4) Futu Holdings 富途控股 and GMMA and Woodies CCI
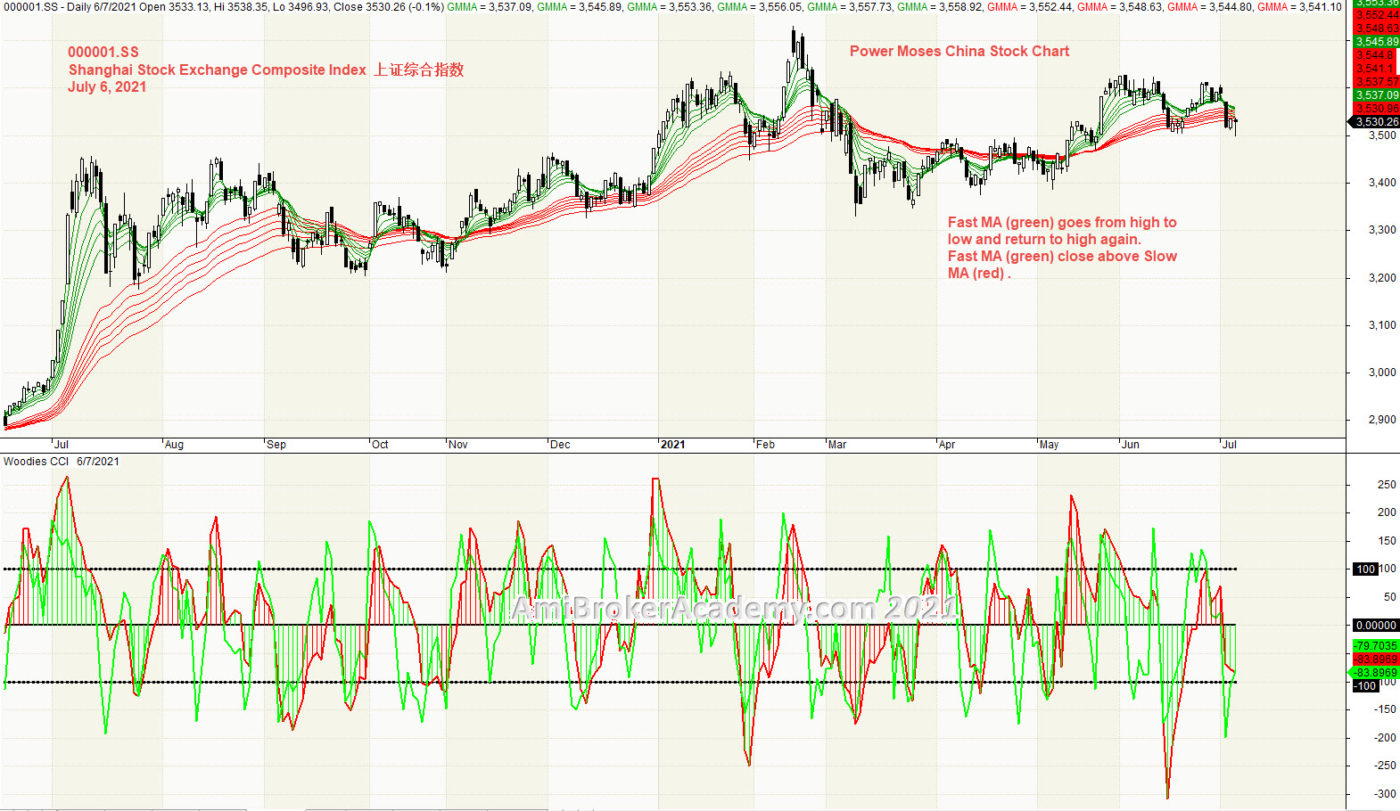
Price Action and Fast MA (green) goes from under Slow MA (red) to above. After February the price action and Fast MA (green) are zigzaging the Slow MA (red). Finally, Fast MA are like crossing Slow MA, Dead Cross. Dead Cross is in progress.
20210707 Futu Holdings 富途控股 and GMMA and Woodies CCI
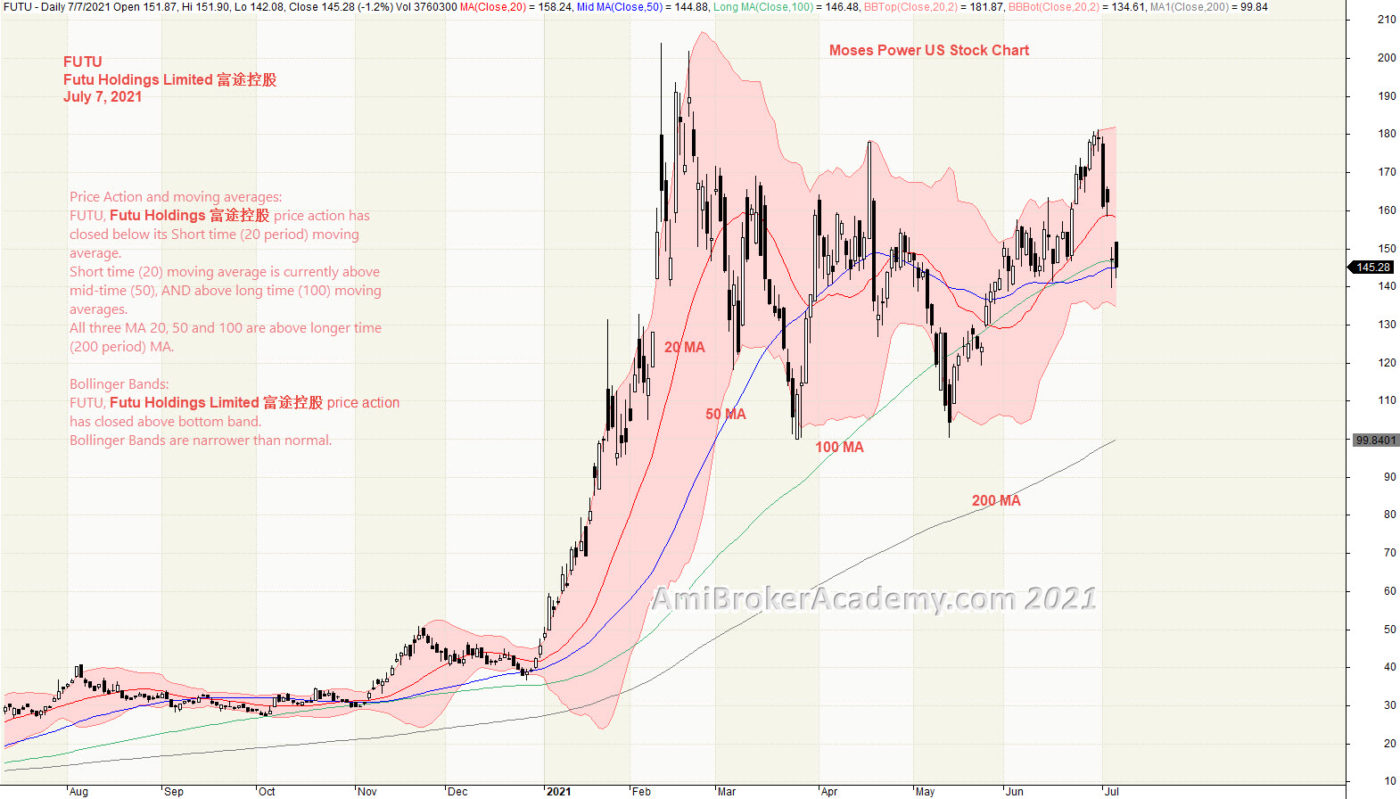
5) Futu Holdings 富途控股 and Bollinger Bands and Moving Averages
Price Action and moving averages: FUTU, Futu Holdings 富途控股 price action has closed below its Short time (20 period) moving average. Short time (20) moving average is currently above mid-time (50), AND above long time (100) moving averages. All three MA 20, 50 and 100 are above longer time (200 period) MA.
Bollinger Bands: FUTU, Futu Holdings Limited 富途控股 price action has closed above bottom band. Bollinger Bands are narrower than normal.
You may also sport a few ABCD patterns. See chart.
Manage your risk.
20210707 Futu Holdings 富途控股 and Bollinger Bands and Moving Averages
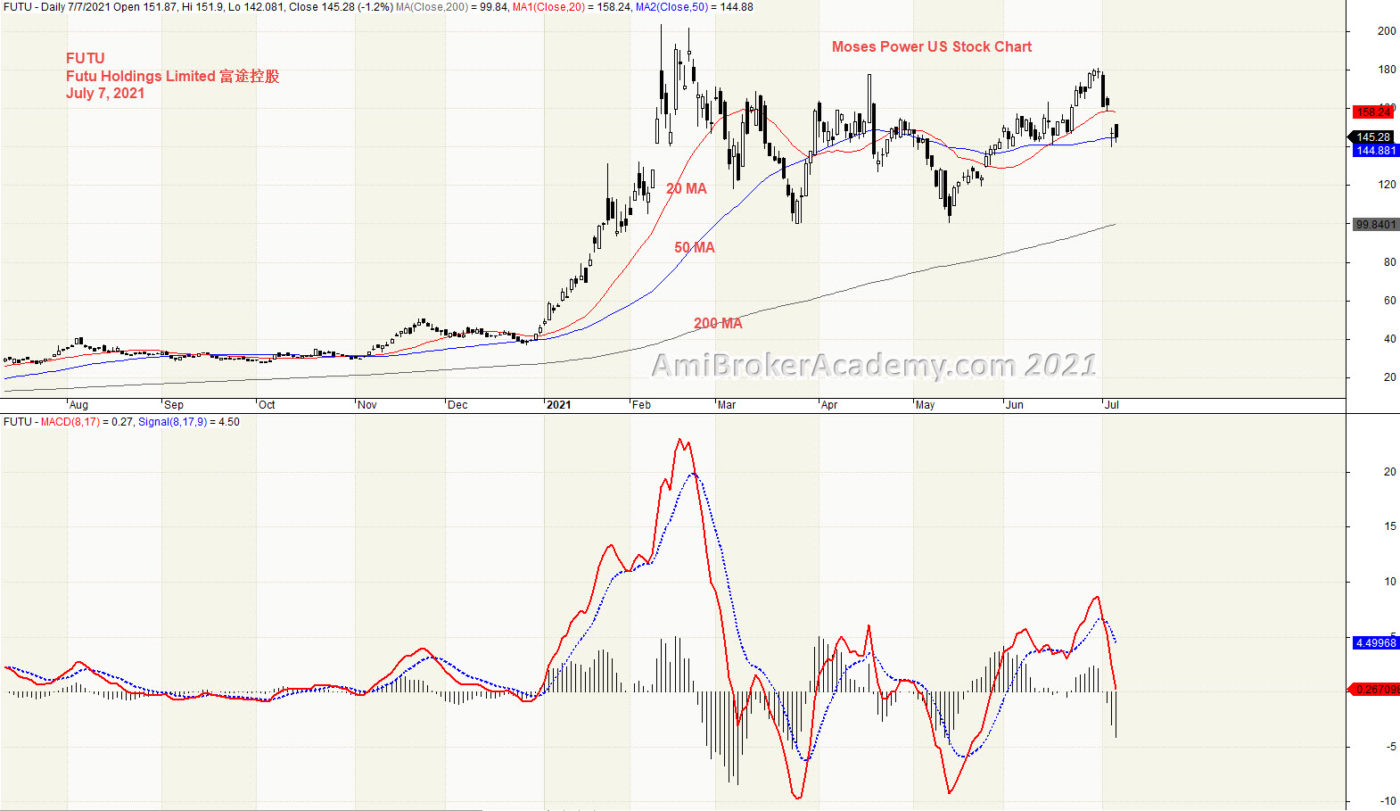
6) Futu Holdings 富途控股 and MACD
We see price action continues to go higher. 200 MA slopping up.
Don’t take MACD or MACD-H Divergence lightly. Don’t play play.
20210707 Futu Holdings 富途控股 and Dow Index Correlation
Moses Power Charting
Official AmiBrokerAcademy.com Charting
Disclaimer
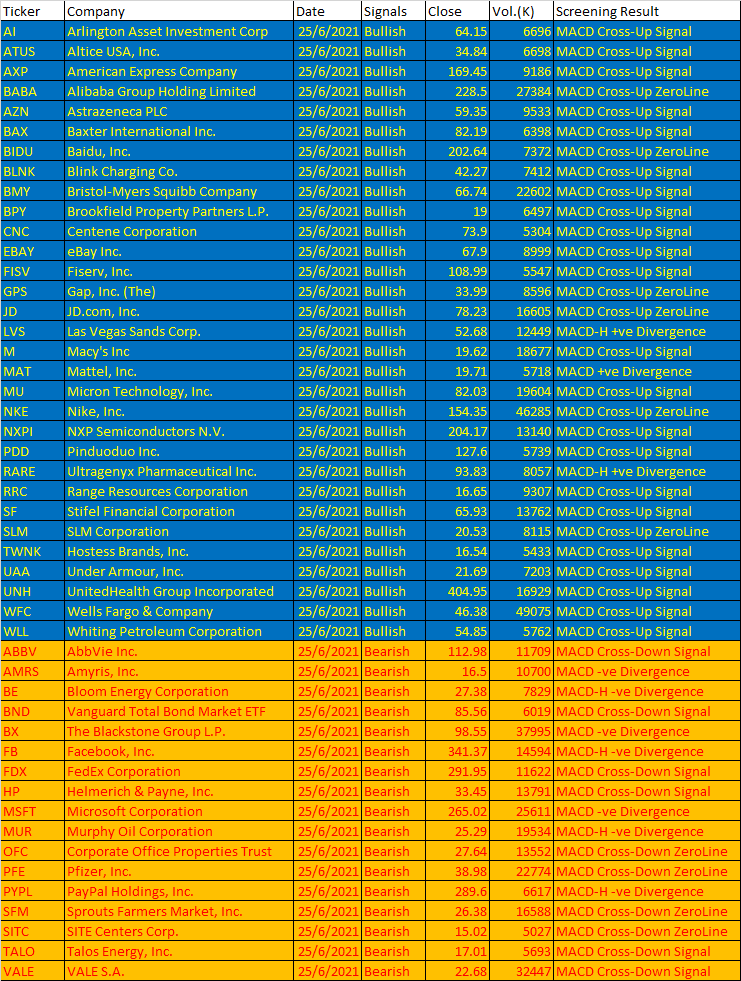
The above result is for illustration purpose. It is not meant to be used for buy or sell decision. We do not recommend any particular stocks. If particular stocks of such are mentioned, they are meant as demonstration of Amibroker as a powerful charting software and MACD. Amibroker can program to scan the stocks for buy and sell signals.
These are script generated signals. Not all scan results are shown here. The MACD signal should use with price action. Users must understand what MACD and price action are all about before using them. If necessary you should attend a course to learn more on Technical Analysis (TA) and Moving Average Convergence Divergence, MACD.
Once again, the website does not guarantee any results or investment return based on the information and instruction you have read here. It should be used as learning aids only and if you decide to trade real money, all trading decision should be your own.
We learn from many past and present great traders. Kudo to these master.
Welcome to AmiBroker Academy. Thanks for visiting the site.
Moving Average Convergence Divergence, MACD Screener
MACD was developed by Gerald Appel in the late seventies.
MACD stands for Moving Average Convergence Divergence, the MACD line (red line or called fast line) and MACD signal line (blue line, or called slow line).
MACD Bullish Signal Line Cross: MACD bullish signal when red line crosses above the blue line or MACD line crosses above zero line.
MACD Bearish Signal Line Cross: MACD bearish signal when blue line crosses below red line or MACD line crosses below zero line.
MACD Scan
These are stocks picked for today.
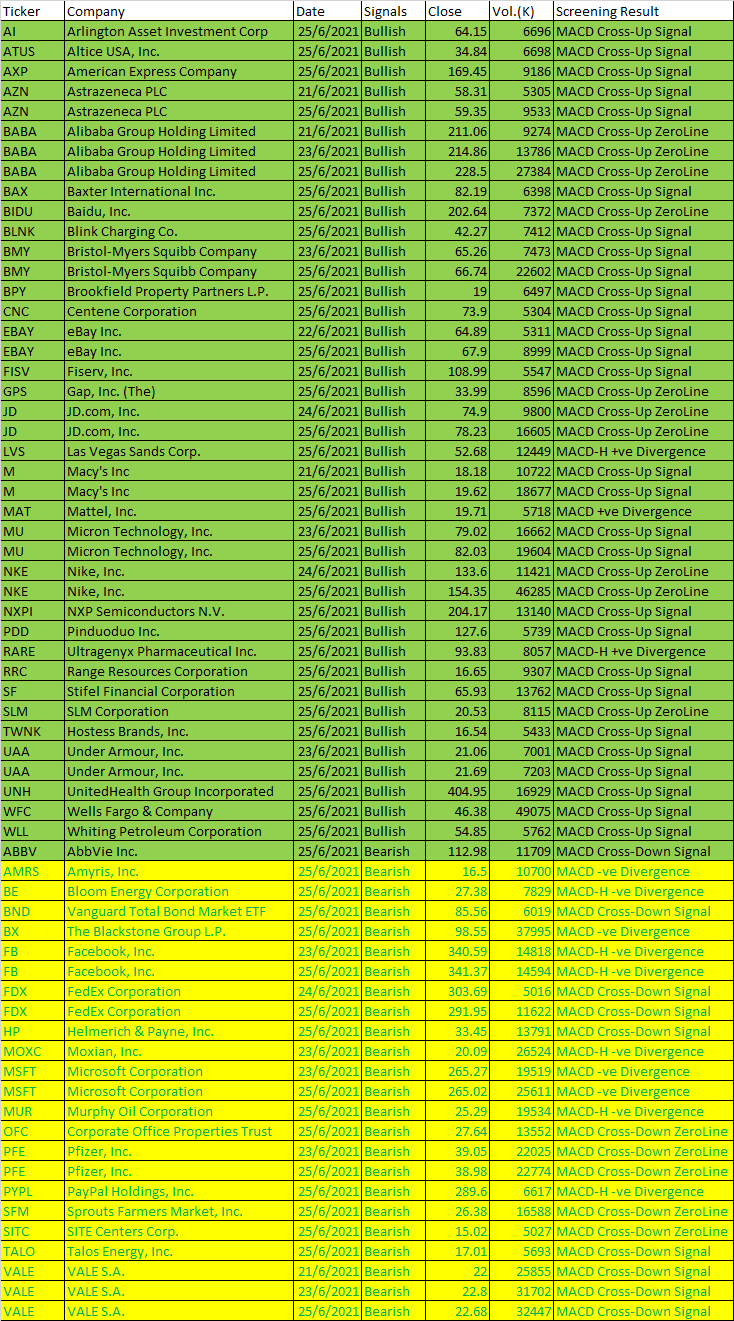
Some of 25 June, 2021 AmiBroker AFL Script Generated One-day US Stock MACD Signals
Ticker
Company
Date
Signals
Close
Vol.(K)
Screening Result
AI
Arlington Asset Investment Corp
25/6/2021
Bullish
64.15
6696
MACD Cross-Up Signal
ATUS
Altice USA, Inc.
25/6/2021
Bullish
34.84
6698
MACD Cross-Up Signal
AXP
American Express Company
25/6/2021
Bullish
169.45
9186
MACD Cross-Up Signal
BABA
Alibaba Group Holding Limited
25/6/2021
Bullish
228.5
27384
MACD Cross-Up ZeroLine
AZN
Astrazeneca PLC
25/6/2021
Bullish
59.35
9533
MACD Cross-Up Signal
BAX
Baxter International Inc.
25/6/2021
Bullish
82.19
6398
MACD Cross-Up Signal
BIDU
Baidu, Inc.
25/6/2021
Bullish
202.64
7372
MACD Cross-Up ZeroLine
BLNK
Blink Charging Co.
25/6/2021
Bullish
42.27
7412
MACD Cross-Up Signal
BMY
Bristol-Myers Squibb Company
25/6/2021
Bullish
66.74
22602
MACD Cross-Up Signal
BPY
Brookfield Property Partners L.P.
25/6/2021
Bullish
19
6497
MACD Cross-Up Signal
CNC
Centene Corporation
25/6/2021
Bullish
73.9
5304
MACD Cross-Up Signal
EBAY
eBay Inc.
25/6/2021
Bullish
67.9
8999
MACD Cross-Up Signal
FISV
Fiserv, Inc.
25/6/2021
Bullish
108.99
5547
MACD Cross-Up Signal
GPS
Gap, Inc. (The)
25/6/2021
Bullish
33.99
8596
MACD Cross-Up ZeroLine
JD
JD.com, Inc.
25/6/2021
Bullish
78.23
16605
MACD Cross-Up ZeroLine
LVS
Las Vegas Sands Corp.
25/6/2021
Bullish
52.68
12449
MACD-H +ve Divergence
M
Macy’s Inc
25/6/2021
Bullish
19.62
18677
MACD Cross-Up Signal
MAT
Mattel, Inc.
25/6/2021
Bullish
19.71
5718
MACD +ve Divergence
MU
Micron Technology, Inc.
25/6/2021
Bullish
82.03
19604
MACD Cross-Up Signal
NKE
Nike, Inc.
25/6/2021
Bullish
154.35
46285
MACD Cross-Up ZeroLine
NXPI
NXP Semiconductors N.V.
25/6/2021
Bullish
204.17
13140
MACD Cross-Up Signal
PDD
Pinduoduo Inc.
25/6/2021
Bullish
127.6
5739
MACD Cross-Up Signal
RARE
Ultragenyx Pharmaceutical Inc.
25/6/2021
Bullish
93.83
8057
MACD-H +ve Divergence
RRC
Range Resources Corporation
25/6/2021
Bullish
16.65
9307
MACD Cross-Up Signal
SF
Stifel Financial Corporation
25/6/2021
Bullish
65.93
13762
MACD Cross-Up Signal
SLM
SLM Corporation
25/6/2021
Bullish
20.53
8115
MACD Cross-Up ZeroLine
TWNK
Hostess Brands, Inc.
25/6/2021
Bullish
16.54
5433
MACD Cross-Up Signal
UAA
Under Armour, Inc.
25/6/2021
Bullish
21.69
7203
MACD Cross-Up Signal
UNH
UnitedHealth Group Incorporated
25/6/2021
Bullish
404.95
16929
MACD Cross-Up Signal
WFC
Wells Fargo & Company
25/6/2021
Bullish
46.38
49075
MACD Cross-Up Signal
WLL
Whiting Petroleum Corporation
25/6/2021
Bullish
54.85
5762
MACD Cross-Up Signal
ABBV
AbbVie Inc.
25/6/2021
Bearish
112.98
11709
MACD Cross-Down Signal
AMRS
Amyris, Inc.
25/6/2021
Bearish
16.5
10700
MACD -ve Divergence
BE
Bloom Energy Corporation
25/6/2021
Bearish
27.38
7829
MACD-H -ve Divergence
BND
Vanguard Total Bond Market ETF
25/6/2021
Bearish
85.56
6019
MACD Cross-Down Signal
BX
The Blackstone Group L.P.
25/6/2021
Bearish
98.55
37995
MACD -ve Divergence
FB
Facebook, Inc.
25/6/2021
Bearish
341.37
14594
MACD-H -ve Divergence
FDX
FedEx Corporation
25/6/2021
Bearish
291.95
11622
MACD Cross-Down Signal
HP
Helmerich & Payne, Inc.
25/6/2021
Bearish
33.45
13791
MACD Cross-Down Signal
MSFT
Microsoft Corporation
25/6/2021
Bearish
265.02
25611
MACD -ve Divergence
MUR
Murphy Oil Corporation
25/6/2021
Bearish
25.29
19534
MACD-H -ve Divergence
OFC
Corporate Office Properties Trust
25/6/2021
Bearish
27.64
13552
MACD Cross-Down ZeroLine
PFE
Pfizer, Inc.
25/6/2021
Bearish
38.98
22774
MACD Cross-Down ZeroLine
PYPL
PayPal Holdings, Inc.
25/6/2021
Bearish
289.6
6617
MACD-H -ve Divergence
SFM
Sprouts Farmers Market, Inc.
25/6/2021
Bearish
26.38
16588
MACD Cross-Down ZeroLine
SITC
SITE Centers Corp.
25/6/2021
Bearish
15.02
5027
MACD Cross-Down ZeroLine
TALO
Talos Energy, Inc.
25/6/2021
Bearish
17.01
5693
MACD Cross-Down Signal
VALE
VALE S.A.
25/6/2021
Bearish
22.68
32447
MACD Cross-Down Signal
20210625 US Stock One-day MACD Signals
Moses Stock Scan
Free Power US Stock MACD Scan Signals AmiBroker Academy.com
Disclaimer: The above result is for illustration purpose. It is not meant to be used for buy or sell decision. We do not recommend any particular stocks on our website. If particular stocks of such are mentioned, they are meant as illustration or demonstration of Amibroker as a powerful charting software or MACD scanner. Amibroker can program to scan the stocks that have MACD buy or sell signals.
These are script generated signals. Not all scan results are shown here. The MACD signal should use with price action and confirmation. Users must understand what MACD and price action are all about before using them. If necessary you should attend a course to learn more about Technical Analysis (TA) and Moving Average Convergence Divergence, MACD.
Once again, the website does not guarantee any results or investment return based on the information and instruction you have read here. It should be used as learning aids only and if you decide to trade real money, all trading decision should be your own, and you should take your own responsibility.
Welcome to AmiBroker Academy. Thanks for visiting the site.
Moving Average Convergence Divergence, MACD Screener
MACD was developed by Gerald Appel in the late seventies.
MACD stands for Moving Average Convergence Divergence, the MACD line (red line or called fast line) and MACD signal line (blue line, or called slow line).
MACD Bullish Signal Line Cross: MACD bullish signal when red line crosses above the blue line or MACD line crosses above zero line.
MACD Bearish Signal Line Cross: MACD bearish signal when blue line crosses below red line or MACD line crosses below zero line.
MACD Scan
These are stocks picked for today.
Some of 21 to 25 June, 2021 AmiBroker AFL Script Generated Five-day US Stock MACD Signals
Ticker
Company
Date
Signals
Close
Vol.(K)
Screening Result
AI
Arlington Asset Investment Corp
25/6/2021
Bullish
64.15
6696
MACD Cross-Up Signal
ATUS
Altice USA, Inc.
25/6/2021
Bullish
34.84
6698
MACD Cross-Up Signal
AXP
American Express Company
25/6/2021
Bullish
169.45
9186
MACD Cross-Up Signal
AZN
Astrazeneca PLC
21/6/2021
Bullish
58.31
5305
MACD Cross-Up Signal
AZN
Astrazeneca PLC
25/6/2021
Bullish
59.35
9533
MACD Cross-Up Signal
BABA
Alibaba Group Holding Limited
21/6/2021
Bullish
211.06
9274
MACD Cross-Up ZeroLine
BABA
Alibaba Group Holding Limited
23/6/2021
Bullish
214.86
13786
MACD Cross-Up ZeroLine
BABA
Alibaba Group Holding Limited
25/6/2021
Bullish
228.5
27384
MACD Cross-Up ZeroLine
BAX
Baxter International Inc.
25/6/2021
Bullish
82.19
6398
MACD Cross-Up Signal
BIDU
Baidu, Inc.
25/6/2021
Bullish
202.64
7372
MACD Cross-Up ZeroLine
BLNK
Blink Charging Co.
25/6/2021
Bullish
42.27
7412
MACD Cross-Up Signal
BMY
Bristol-Myers Squibb Company
23/6/2021
Bullish
65.26
7473
MACD Cross-Up Signal
BMY
Bristol-Myers Squibb Company
25/6/2021
Bullish
66.74
22602
MACD Cross-Up Signal
BPY
Brookfield Property Partners L.P.
25/6/2021
Bullish
19
6497
MACD Cross-Up Signal
CNC
Centene Corporation
25/6/2021
Bullish
73.9
5304
MACD Cross-Up Signal
EBAY
eBay Inc.
22/6/2021
Bullish
64.89
5311
MACD Cross-Up Signal
EBAY
eBay Inc.
25/6/2021
Bullish
67.9
8999
MACD Cross-Up Signal
FISV
Fiserv, Inc.
25/6/2021
Bullish
108.99
5547
MACD Cross-Up Signal
GPS
Gap, Inc. (The)
25/6/2021
Bullish
33.99
8596
MACD Cross-Up ZeroLine
JD
JD.com, Inc.
24/6/2021
Bullish
74.9
9800
MACD Cross-Up ZeroLine
JD
JD.com, Inc.
25/6/2021
Bullish
78.23
16605
MACD Cross-Up ZeroLine
LVS
Las Vegas Sands Corp.
25/6/2021
Bullish
52.68
12449
MACD-H +ve Divergence
M
Macy’s Inc
21/6/2021
Bullish
18.18
10722
MACD Cross-Up Signal
M
Macy’s Inc
25/6/2021
Bullish
19.62
18677
MACD Cross-Up Signal
MAT
Mattel, Inc.
25/6/2021
Bullish
19.71
5718
MACD +ve Divergence
MU
Micron Technology, Inc.
23/6/2021
Bullish
79.02
16662
MACD Cross-Up Signal
MU
Micron Technology, Inc.
25/6/2021
Bullish
82.03
19604
MACD Cross-Up Signal
NKE
Nike, Inc.
24/6/2021
Bullish
133.6
11421
MACD Cross-Up ZeroLine
NKE
Nike, Inc.
25/6/2021
Bullish
154.35
46285
MACD Cross-Up ZeroLine
NXPI
NXP Semiconductors N.V.
25/6/2021
Bullish
204.17
13140
MACD Cross-Up Signal
PDD
Pinduoduo Inc.
25/6/2021
Bullish
127.6
5739
MACD Cross-Up Signal
RARE
Ultragenyx Pharmaceutical Inc.
25/6/2021
Bullish
93.83
8057
MACD-H +ve Divergence
RRC
Range Resources Corporation
25/6/2021
Bullish
16.65
9307
MACD Cross-Up Signal
SF
Stifel Financial Corporation
25/6/2021
Bullish
65.93
13762
MACD Cross-Up Signal
SLM
SLM Corporation
25/6/2021
Bullish
20.53
8115
MACD Cross-Up ZeroLine
TWNK
Hostess Brands, Inc.
25/6/2021
Bullish
16.54
5433
MACD Cross-Up Signal
UAA
Under Armour, Inc.
23/6/2021
Bullish
21.06
7001
MACD Cross-Up Signal
UAA
Under Armour, Inc.
25/6/2021
Bullish
21.69
7203
MACD Cross-Up Signal
UNH
UnitedHealth Group Incorporated
25/6/2021
Bullish
404.95
16929
MACD Cross-Up Signal
WFC
Wells Fargo & Company
25/6/2021
Bullish
46.38
49075
MACD Cross-Up Signal
WLL
Whiting Petroleum Corporation
25/6/2021
Bullish
54.85
5762
MACD Cross-Up Signal
ABBV
AbbVie Inc.
25/6/2021
Bearish
112.98
11709
MACD Cross-Down Signal
AMRS
Amyris, Inc.
25/6/2021
Bearish
16.5
10700
MACD -ve Divergence
BE
Bloom Energy Corporation
25/6/2021
Bearish
27.38
7829
MACD-H -ve Divergence
BND
Vanguard Total Bond Market ETF
25/6/2021
Bearish
85.56
6019
MACD Cross-Down Signal
BX
The Blackstone Group L.P.
25/6/2021
Bearish
98.55
37995
MACD -ve Divergence
FB
Facebook, Inc.
23/6/2021
Bearish
340.59
14818
MACD-H -ve Divergence
FB
Facebook, Inc.
25/6/2021
Bearish
341.37
14594
MACD-H -ve Divergence
FDX
FedEx Corporation
24/6/2021
Bearish
303.69
5016
MACD Cross-Down Signal
FDX
FedEx Corporation
25/6/2021
Bearish
291.95
11622
MACD Cross-Down Signal
HP
Helmerich & Payne, Inc.
25/6/2021
Bearish
33.45
13791
MACD Cross-Down Signal
MOXC
Moxian, Inc.
23/6/2021
Bearish
20.09
26524
MACD-H -ve Divergence
MSFT
Microsoft Corporation
23/6/2021
Bearish
265.27
19519
MACD -ve Divergence
MSFT
Microsoft Corporation
25/6/2021
Bearish
265.02
25611
MACD -ve Divergence
MUR
Murphy Oil Corporation
25/6/2021
Bearish
25.29
19534
MACD-H -ve Divergence
OFC
Corporate Office Properties Trust
25/6/2021
Bearish
27.64
13552
MACD Cross-Down ZeroLine
PFE
Pfizer, Inc.
23/6/2021
Bearish
39.05
22025
MACD Cross-Down ZeroLine
PFE
Pfizer, Inc.
25/6/2021
Bearish
38.98
22774
MACD Cross-Down ZeroLine
PYPL
PayPal Holdings, Inc.
25/6/2021
Bearish
289.6
6617
MACD-H -ve Divergence
SFM
Sprouts Farmers Market, Inc.
25/6/2021
Bearish
26.38
16588
MACD Cross-Down ZeroLine
SITC
SITE Centers Corp.
25/6/2021
Bearish
15.02
5027
MACD Cross-Down ZeroLine
TALO
Talos Energy, Inc.
25/6/2021
Bearish
17.01
5693
MACD Cross-Down Signal
VALE
VALE S.A.
21/6/2021
Bearish
22
25855
MACD Cross-Down Signal
VALE
VALE S.A.
23/6/2021
Bearish
22.8
31702
MACD Cross-Down Signal
VALE
VALE S.A.
25/6/2021
Bearish
22.68
32447
MACD Cross-Down Signal
202106 21 to 25 US Stock Five-day MACD
Moses Stock Scan
Free Power US Stock MACD Scan Signals AmiBroker Academy.com
Disclaimer: The above result is for illustration purpose. It is not meant to be used for buy or sell decision. We do not recommend any particular stocks on our website. If particular stocks of such are mentioned, they are meant as illustration or demonstration of Amibroker as a powerful charting software or MACD scanner. Amibroker can program to scan the stocks that have MACD buy or sell signals.
These are script generated signals. Not all scan results are shown here. The MACD signal should use with price action and confirmation. Users must understand what MACD and price action are all about before using them. If necessary you should attend a course to learn more about Technical Analysis (TA) and Moving Average Convergence Divergence, MACD.
Once again, the website does not guarantee any results or investment return based on the information and instruction you have read here. It should be used as learning aids only and if you decide to trade real money, all trading decision should be your own, and you should take your own responsibility.
Welcome to AmiBroker Academy dot com, amibrokeracademy.com.
We sometime bench mark stock price action with index such as Dow Index. The following example, we benchmark Futu and Dow Jones Industrial Average Index. Futu is a trading platform that key investor is Tencent. We use other tools such as 1) Ichimoku Cloud, 2) Support Resistance (using box), 3) River (moving average), 4) GMMA and Woodies CCI, 5) Bollinger Bands and Moving Averages, and 6) MACD to analyze chart. See our simple reading of price action. We read Cryptocurrencies price action chart too.
We translate price action chart into layman language. This will help you in understand the financial instrument you are trading. We believe picture worth a thousand words. So, sometimes we use less words. You can learn the price action interpretation too. Give it a tray. You may not have the same view points as us. Remember all analysis read price action chart differently. It is just like reading an essay, we will have different conclusion.
Trade well.
Trade what you see. Manage your risk.
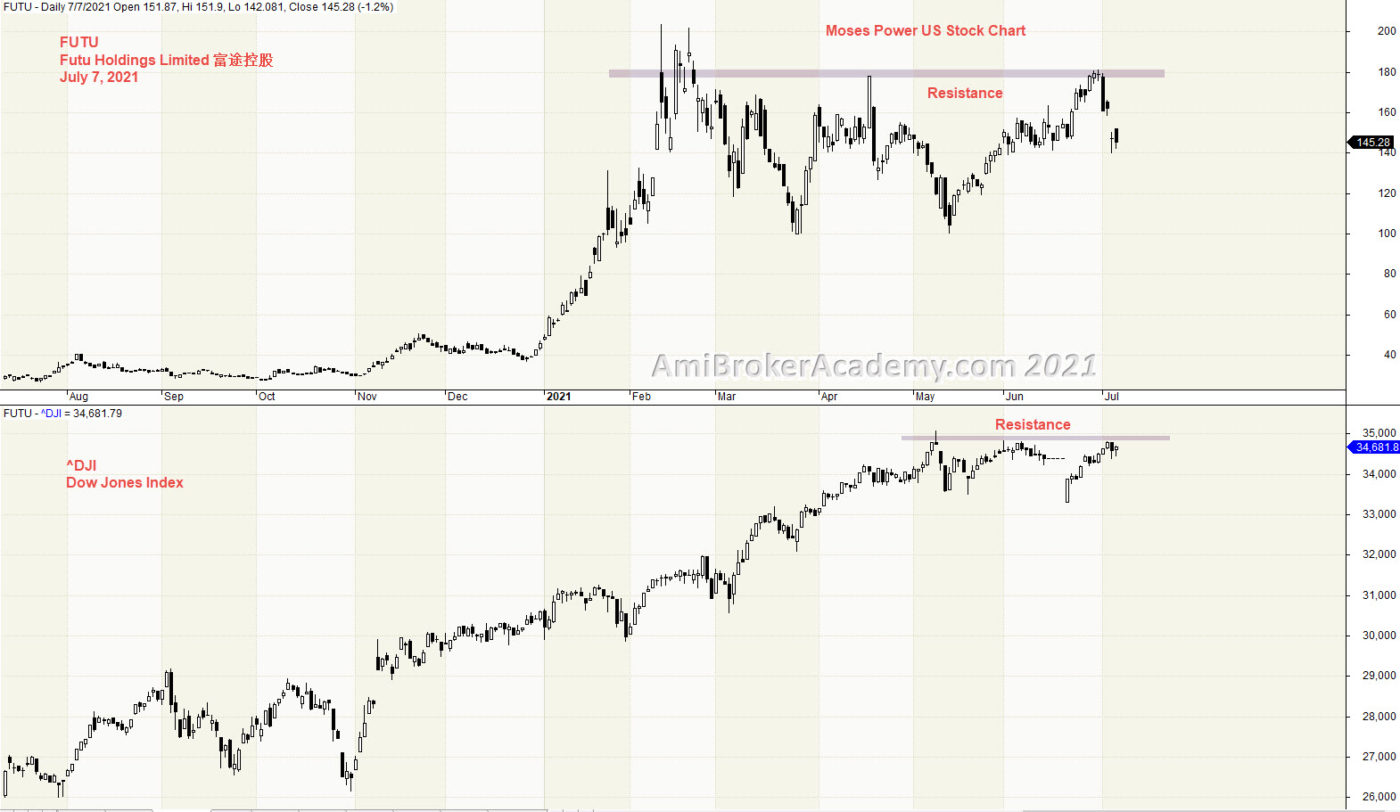
1) Futu Holdings 富途控股 and Dow Index Correlation
We study price action, we see Futu Holdings stock hitting the ceiling since February, but Dow Jones Index only test the ceiling from May.
Trade what you see.
Both Futu Holdings an Dow Jones Index price action can’t goes any higher. Price Action has hit the ceiling, and price action seems moving in sideways.
Remember, we just read what the chart said. Have fun!
20210707 Futu Holdings 富途控股 and Dow Index Correlation
Moses Power Charting
Official AmiBrokerAcademy.com Charting
Disclaimer
The above result is for illustration purpose. It is not meant to be used for buy or sell decision. We do not recommend any particular stocks. If particular stocks of such are mentioned, they are meant as demonstration of Amibroker as a powerful charting software and MACD. Amibroker can program to scan the stocks for buy and sell signals.
These are script generated signals. Not all scan results are shown here. The MACD signal should use with price action. Users must understand what MACD and price action are all about before using them. If necessary you should attend a course to learn more on Technical Analysis (TA) and Moving Average Convergence Divergence, MACD.
Once again, the website does not guarantee any results or investment return based on the information and instruction you have read here. It should be used as learning aids only and if you decide to trade real money, all trading decision should be your own.
We learn from many past and present great traders. Kudo to these master.
Welcome to AmiBroker Academy. Thanks for visiting the site.
Moving Average Convergence Divergence, MACD Screener
MACD was developed by Gerald Appel in the late seventies.
MACD stands for Moving Average Convergence Divergence, the MACD line (red line or called fast line) and MACD signal line (blue line, or called slow line).
MACD Bullish Signal Line Cross: MACD bullish signal when red line crosses above the blue line or MACD line crosses above zero line.
MACD Bearish Signal Line Cross: MACD bearish signal when blue line crosses below red line or MACD line crosses below zero line.
MACD Scan
These are stocks picked for today.
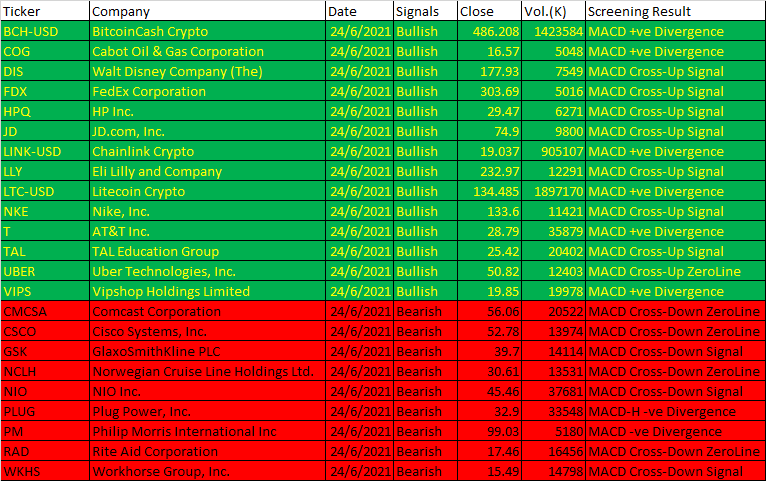
Some of 24 June, 2021 AmiBroker AFL Script Generated One-day US Stock MACD Signals
Ticker
Company
Date
Signals
Close
Vol.(K)
Screening Result
BCH-USD
BitcoinCash Crypto
24/6/2021
Bullish
486.208
1423584
MACD +ve Divergence
COG
Cabot Oil & Gas Corporation
24/6/2021
Bullish
16.57
5048
MACD +ve Divergence
DIS
Walt Disney Company (The)
24/6/2021
Bullish
177.93
7549
MACD Cross-Up Signal
FDX
FedEx Corporation
24/6/2021
Bullish
303.69
5016
MACD Cross-Up Signal
HPQ
HP Inc.
24/6/2021
Bullish
29.47
6271
MACD Cross-Up Signal
JD
JD.com, Inc.
24/6/2021
Bullish
74.9
9800
MACD Cross-Up Signal
LINK-USD
Chainlink Crypto
24/6/2021
Bullish
19.037
905107
MACD +ve Divergence
LLY
Eli Lilly and Company
24/6/2021
Bullish
232.97
12291
MACD Cross-Up Signal
LTC-USD
Litecoin Crypto
24/6/2021
Bullish
134.485
1897170
MACD +ve Divergence
NKE
Nike, Inc.
24/6/2021
Bullish
133.6
11421
MACD Cross-Up Signal
T
AT&T Inc.
24/6/2021
Bullish
28.79
35879
MACD +ve Divergence
TAL
TAL Education Group
24/6/2021
Bullish
25.42
20402
MACD Cross-Up Signal
UBER
Uber Technologies, Inc.
24/6/2021
Bullish
50.82
12403
MACD Cross-Up ZeroLine
VIPS
Vipshop Holdings Limited
24/6/2021
Bullish
19.85
19978
MACD +ve Divergence
CMCSA
Comcast Corporation
24/6/2021
Bearish
56.06
20522
MACD Cross-Down ZeroLine
CSCO
Cisco Systems, Inc.
24/6/2021
Bearish
52.78
13974
MACD Cross-Down ZeroLine
GSK
GlaxoSmithKline PLC
24/6/2021
Bearish
39.7
14114
MACD Cross-Down Signal
NCLH
Norwegian Cruise Line Holdings Ltd.
24/6/2021
Bearish
30.61
13531
MACD Cross-Down ZeroLine
NIO
NIO Inc.
24/6/2021
Bearish
45.46
37681
MACD Cross-Down Signal
PLUG
Plug Power, Inc.
24/6/2021
Bearish
32.9
33548
MACD-H -ve Divergence
PM
Philip Morris International Inc
24/6/2021
Bearish
99.03
5180
MACD -ve Divergence
RAD
Rite Aid Corporation
24/6/2021
Bearish
17.46
16456
MACD Cross-Down ZeroLine
WKHS
Workhorse Group, Inc.
24/6/2021
Bearish
15.49
14798
MACD Cross-Down Signal
20210624 US Stock MACD One-day MACD Signals
Moses Stock Scan
Free Power US Stock MACD Scan Signals AmiBroker Academy.com
Disclaimer: The above result is for illustration purpose. It is not meant to be used for buy or sell decision. We do not recommend any particular stocks on our website. If particular stocks of such are mentioned, they are meant as illustration or demonstration of Amibroker as a powerful charting software or MACD scanner. Amibroker can program to scan the stocks that have MACD buy or sell signals.
These are script generated signals. Not all scan results are shown here. The MACD signal should use with price action and confirmation. Users must understand what MACD and price action are all about before using them. If necessary you should attend a course to learn more about Technical Analysis (TA) and Moving Average Convergence Divergence, MACD.
Once again, the website does not guarantee any results or investment return based on the information and instruction you have read here. It should be used as learning aids only and if you decide to trade real money, all trading decision should be your own, and you should take your own responsibility.
Welcome to AmiBroker Academy. Thanks for visiting the site.
Moving Average Convergence Divergence, MACD Screener
MACD was developed by Gerald Appel in the late seventies.
MACD stands for Moving Average Convergence Divergence, the MACD line (red line or called fast line) and MACD signal line (blue line, or called slow line).
MACD Bullish Signal Line Cross: MACD bullish signal when red line crosses above the blue line or MACD line crosses above zero line.
MACD Bearish Signal Line Cross: MACD bearish signal when blue line crosses below red line or MACD line crosses below zero line.
MACD Scan
These are stocks picked for today.
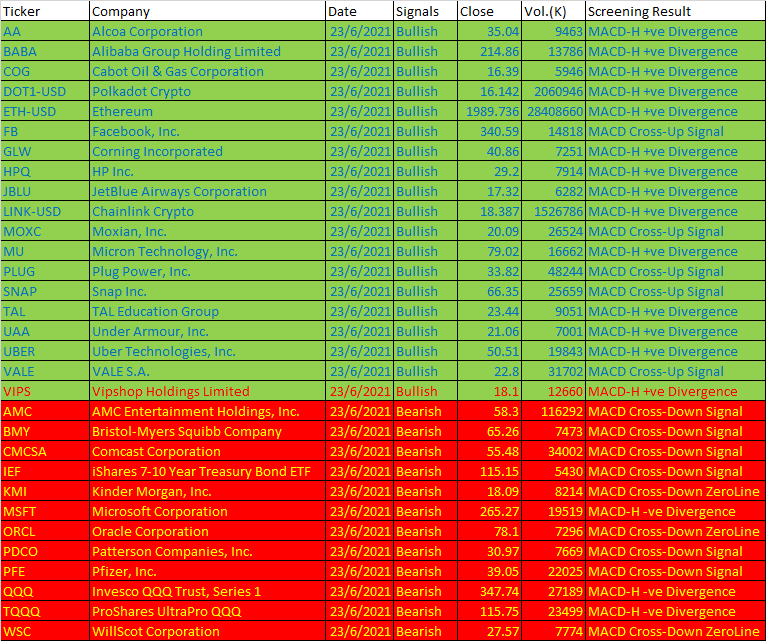
Some of 23 June, 2021 AmiBroker AFL Script Generated One-day US Stock MACD Signals
Ticker
Company
Date
Signals
Close
Vol.(K)
Screening Result
AA
Alcoa Corporation
23/6/2021
Bullish
35.04
9463
MACD-H +ve Divergence
BABA
Alibaba Group Holding Limited
23/6/2021
Bullish
214.86
13786
MACD-H +ve Divergence
COG
Cabot Oil & Gas Corporation
23/6/2021
Bullish
16.39
5946
MACD-H +ve Divergence
DOT1-USD
Polkadot Crypto
23/6/2021
Bullish
16.142
2060946
MACD-H +ve Divergence
ETH-USD
Ethereum
23/6/2021
Bullish
1989.736
28408660
MACD-H +ve Divergence
FB
Facebook, Inc.
23/6/2021
Bullish
340.59
14818
MACD Cross-Up Signal
GLW
Corning Incorporated
23/6/2021
Bullish
40.86
7251
MACD-H +ve Divergence
HPQ
HP Inc.
23/6/2021
Bullish
29.2
7914
MACD-H +ve Divergence
JBLU
JetBlue Airways Corporation
23/6/2021
Bullish
17.32
6282
MACD-H +ve Divergence
LINK-USD
Chainlink Crypto
23/6/2021
Bullish
18.387
1526786
MACD-H +ve Divergence
MOXC
Moxian, Inc.
23/6/2021
Bullish
20.09
26524
MACD Cross-Up Signal
MU
Micron Technology, Inc.
23/6/2021
Bullish
79.02
16662
MACD-H +ve Divergence
PLUG
Plug Power, Inc.
23/6/2021
Bullish
33.82
48244
MACD Cross-Up Signal
SNAP
Snap Inc.
23/6/2021
Bullish
66.35
25659
MACD Cross-Up Signal
TAL
TAL Education Group
23/6/2021
Bullish
23.44
9051
MACD-H +ve Divergence
UAA
Under Armour, Inc.
23/6/2021
Bullish
21.06
7001
MACD-H +ve Divergence
UBER
Uber Technologies, Inc.
23/6/2021
Bullish
50.51
19843
MACD-H +ve Divergence
VALE
VALE S.A.
23/6/2021
Bullish
22.8
31702
MACD Cross-Up Signal
VIPS
Vipshop Holdings Limited
23/6/2021
Bullish
18.1
12660
MACD-H +ve Divergence
AMC
AMC Entertainment Holdings, Inc.
23/6/2021
Bearish
58.3
116292
MACD Cross-Down Signal
BMY
Bristol-Myers Squibb Company
23/6/2021
Bearish
65.26
7473
MACD Cross-Down Signal
CMCSA
Comcast Corporation
23/6/2021
Bearish
55.48
34002
MACD Cross-Down Signal
IEF
iShares 7-10 Year Treasury Bond ETF
23/6/2021
Bearish
115.15
5430
MACD Cross-Down Signal
KMI
Kinder Morgan, Inc.
23/6/2021
Bearish
18.09
8214
MACD Cross-Down ZeroLine
MSFT
Microsoft Corporation
23/6/2021
Bearish
265.27
19519
MACD-H -ve Divergence
ORCL
Oracle Corporation
23/6/2021
Bearish
78.1
7296
MACD Cross-Down ZeroLine
PDCO
Patterson Companies, Inc.
23/6/2021
Bearish
30.97
7669
MACD Cross-Down Signal
PFE
Pfizer, Inc.
23/6/2021
Bearish
39.05
22025
MACD Cross-Down Signal
QQQ
Invesco QQQ Trust, Series 1
23/6/2021
Bearish
347.74
27189
MACD-H -ve Divergence
TQQQ
ProShares UltraPro QQQ
23/6/2021
Bearish
115.75
23499
MACD-H -ve Divergence
WSC
WillScot Corporation
23/6/2021
Bearish
27.57
7774
MACD Cross-Down ZeroLine
20210623 US Stock One-day MACD Signals
Moses Stock Scan
Free Power US Stock MACD Scan Signals AmiBroker Academy.com
Disclaimer: The above result is for illustration purpose. It is not meant to be used for buy or sell decision. We do not recommend any particular stocks on our website. If particular stocks of such are mentioned, they are meant as illustration or demonstration of Amibroker as a powerful charting software or MACD scanner. Amibroker can program to scan the stocks that have MACD buy or sell signals.
These are script generated signals. Not all scan results are shown here. The MACD signal should use with price action and confirmation. Users must understand what MACD and price action are all about before using them. If necessary you should attend a course to learn more about Technical Analysis (TA) and Moving Average Convergence Divergence, MACD.
Once again, the website does not guarantee any results or investment return based on the information and instruction you have read here. It should be used as learning aids only and if you decide to trade real money, all trading decision should be your own, and you should take your own responsibility.
Welcome to AmiBroker Academy. Thanks for visiting the site.
Moving Average Convergence Divergence, MACD Screener
MACD was developed by Gerald Appel in the late seventies.
MACD stands for Moving Average Convergence Divergence, the MACD line (red line or called fast line) and MACD signal line (blue line, or called slow line).
MACD Bullish Signal Line Cross: MACD bullish signal when red line crosses above the blue line or MACD line crosses above zero line.
MACD Bearish Signal Line Cross: MACD bearish signal when blue line crosses below red line or MACD line crosses below zero line.
MACD Scan
These are stocks picked for today.
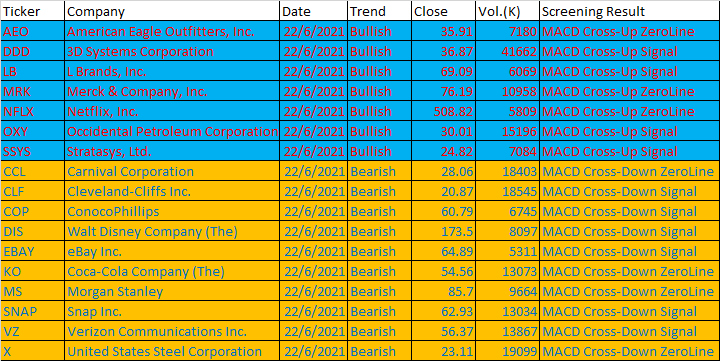
Some of 22 June, 2021 AmiBroker AFL Script Generated One-day US Stock MACD Signals
Ticker
Company
Date
Trend
Close
Vol.(K)
Screening Result
AEO
American Eagle Outfitters, Inc.
22/6/2021
Bullish
35.91
7180
MACD Cross-Up ZeroLine
DDD
3D Systems Corporation
22/6/2021
Bullish
36.87
41662
MACD Cross-Up Signal
LB
L Brands, Inc.
22/6/2021
Bullish
69.09
6069
MACD Cross-Up Signal
MRK
Merck & Company, Inc.
22/6/2021
Bullish
76.19
10958
MACD Cross-Up ZeroLine
NFLX
Netflix, Inc.
22/6/2021
Bullish
508.82
5809
MACD Cross-Up ZeroLine
OXY
Occidental Petroleum Corporation
22/6/2021
Bullish
30.01
15196
MACD Cross-Up Signal
SSYS
Stratasys, Ltd.
22/6/2021
Bullish
24.82
7084
MACD Cross-Up Signal
CCL
Carnival Corporation
22/6/2021
Bearish
28.06
18403
MACD Cross-Down ZeroLine
CLF
Cleveland-Cliffs Inc.
22/6/2021
Bearish
20.87
18545
MACD Cross-Down Signal
COP
ConocoPhillips
22/6/2021
Bearish
60.79
6745
MACD Cross-Down Signal
DIS
Walt Disney Company (The)
22/6/2021
Bearish
173.5
8097
MACD Cross-Down Signal
EBAY
eBay Inc.
22/6/2021
Bearish
64.89
5311
MACD Cross-Down Signal
KO
Coca-Cola Company (The)
22/6/2021
Bearish
54.56
13073
MACD Cross-Down ZeroLine
MS
Morgan Stanley
22/6/2021
Bearish
85.7
9664
MACD Cross-Down ZeroLine
SNAP
Snap Inc.
22/6/2021
Bearish
62.93
13034
MACD Cross-Down Signal
VZ
Verizon Communications Inc.
22/6/2021
Bearish
56.37
13867
MACD Cross-Down Signal
X
United States Steel Corporation
22/6/2021
Bearish
23.11
19099
MACD Cross-Down ZeroLine
20210622 US Stock One-day MACD Signals
Moses Stock Scan
Free Power US Stock MACD Scan Signals AmiBroker Academy.com
Disclaimer: The above result is for illustration purpose. It is not meant to be used for buy or sell decision. We do not recommend any particular stocks on our website. If particular stocks of such are mentioned, they are meant as illustration or demonstration of Amibroker as a powerful charting software or MACD scanner. Amibroker can program to scan the stocks that have MACD buy or sell signals.
These are script generated signals. Not all scan results are shown here. The MACD signal should use with price action and confirmation. Users must understand what MACD and price action are all about before using them. If necessary you should attend a course to learn more about Technical Analysis (TA) and Moving Average Convergence Divergence, MACD.
Once again, the website does not guarantee any results or investment return based on the information and instruction you have read here. It should be used as learning aids only and if you decide to trade real money, all trading decision should be your own, and you should take your own responsibility.
Welcome to AmiBroker Academy. Thanks for visiting the site.
Moving Average Convergence Divergence, MACD Screener
MACD was developed by Gerald Appel in the late seventies.
MACD stands for Moving Average Convergence Divergence, the MACD line (red line or called fast line) and MACD signal line (blue line, or called slow line).
MACD Bullish Signal Line Cross: MACD bullish signal when red line crosses above the blue line or MACD line crosses above zero line.
MACD Bearish Signal Line Cross: MACD bearish signal when blue line crosses below red line or MACD line crosses below zero line.
MACD Scan
These are stocks picked for today.
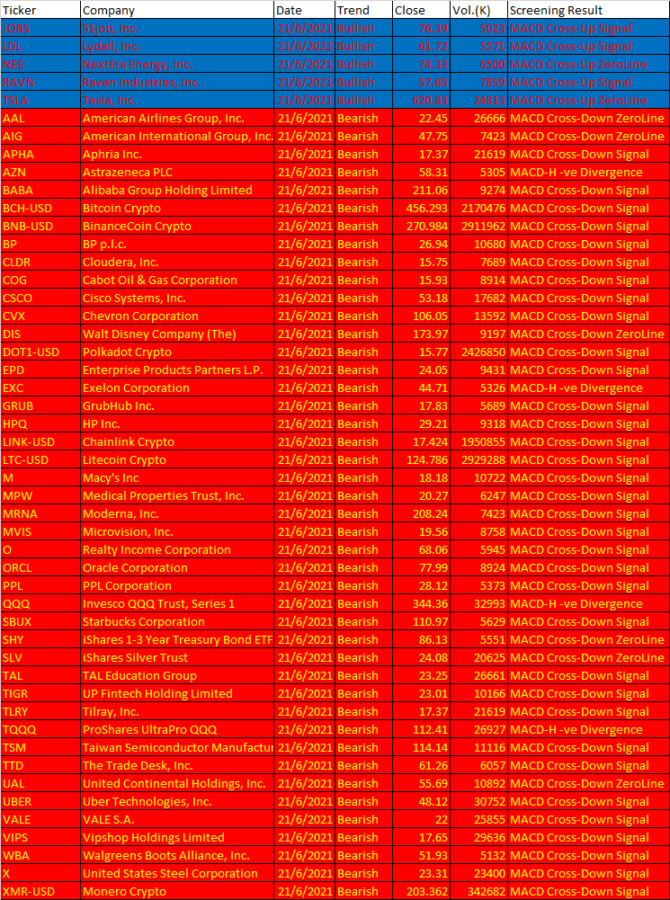
Some of 21 June, 2021 AmiBroker AFL Script Generated One-day US Stock MACD Signals
Ticker
Company
Date
Trend
Close
Vol.(K)
Screening Result
JOBS
51job, Inc.
21/6/2021
Bullish
76.39
5023
MACD Cross-Up Signal
LDL
Lydall, Inc.
21/6/2021
Bullish
61.72
5571
MACD Cross-Up Signal
NEE
NextEra Energy, Inc.
21/6/2021
Bullish
74.33
6500
MACD Cross-Up ZeroLine
RAVN
Raven Industries, Inc.
21/6/2021
Bullish
57.65
7859
MACD Cross-Up Signal
TSLA
Tesla, Inc.
21/6/2021
Bullish
620.83
24813
MACD Cross-Up ZeroLine
AAL
American Airlines Group, Inc.
21/6/2021
Bearish
22.45
26666
MACD Cross-Down ZeroLine
AIG
American International Group, Inc.
21/6/2021
Bearish
47.75
7423
MACD Cross-Down ZeroLine
APHA
Aphria Inc.
21/6/2021
Bearish
17.37
21619
MACD Cross-Down Signal
AZN
Astrazeneca PLC
21/6/2021
Bearish
58.31
5305
MACD-H -ve Divergence
BABA
Alibaba Group Holding Limited
21/6/2021
Bearish
211.06
9274
MACD Cross-Down Signal
BCH-USD
Bitcoin Crypto
21/6/2021
Bearish
456.293
2170476
MACD Cross-Down Signal
BNB-USD
BinanceCoin Crypto
21/6/2021
Bearish
270.984
2911962
MACD Cross-Down Signal
BP
BP p.l.c.
21/6/2021
Bearish
26.94
10680
MACD Cross-Down Signal
CLDR
Cloudera, Inc.
21/6/2021
Bearish
15.75
7689
MACD Cross-Down Signal
COG
Cabot Oil & Gas Corporation
21/6/2021
Bearish
15.93
8914
MACD Cross-Down Signal
CSCO
Cisco Systems, Inc.
21/6/2021
Bearish
53.18
17682
MACD Cross-Down Signal
CVX
Chevron Corporation
21/6/2021
Bearish
106.05
13592
MACD Cross-Down Signal
DIS
Walt Disney Company (The)
21/6/2021
Bearish
173.97
9197
MACD Cross-Down ZeroLine
DOT1-USD
Polkadot Crypto
21/6/2021
Bearish
15.77
2426850
MACD Cross-Down Signal
EPD
Enterprise Products Partners L.P.
21/6/2021
Bearish
24.05
9431
MACD Cross-Down Signal
EXC
Exelon Corporation
21/6/2021
Bearish
44.71
5326
MACD-H -ve Divergence
GRUB
GrubHub Inc.
21/6/2021
Bearish
17.83
5689
MACD Cross-Down Signal
HPQ
HP Inc.
21/6/2021
Bearish
29.21
9318
MACD Cross-Down Signal
LINK-USD
Chainlink Crypto
21/6/2021
Bearish
17.424
1950855
MACD Cross-Down Signal
LTC-USD
Litecoin Crypto
21/6/2021
Bearish
124.786
2929288
MACD Cross-Down Signal
M
Macy’s Inc
21/6/2021
Bearish
18.18
10722
MACD Cross-Down Signal
MPW
Medical Properties Trust, Inc.
21/6/2021
Bearish
20.27
6247
MACD Cross-Down Signal
MRNA
Moderna, Inc.
21/6/2021
Bearish
208.24
7423
MACD Cross-Down Signal
MVIS
Microvision, Inc.
21/6/2021
Bearish
19.56
8758
MACD Cross-Down Signal
O
Realty Income Corporation
21/6/2021
Bearish
68.06
5945
MACD Cross-Down Signal
ORCL
Oracle Corporation
21/6/2021
Bearish
77.99
8924
MACD Cross-Down Signal
PPL
PPL Corporation
21/6/2021
Bearish
28.12
5373
MACD Cross-Down Signal
QQQ
Invesco QQQ Trust, Series 1
21/6/2021
Bearish
344.36
32993
MACD-H -ve Divergence
SBUX
Starbucks Corporation
21/6/2021
Bearish
110.97
5629
MACD Cross-Down Signal
SHY
iShares 1-3 Year Treasury Bond ETF
21/6/2021
Bearish
86.13
5551
MACD Cross-Down ZeroLine
SLV
iShares Silver Trust
21/6/2021
Bearish
24.08
20625
MACD Cross-Down ZeroLine
TAL
TAL Education Group
21/6/2021
Bearish
23.25
26661
MACD Cross-Down Signal
TIGR
UP Fintech Holding Limited
21/6/2021
Bearish
23.01
10166
MACD Cross-Down Signal
TLRY
Tilray, Inc.
21/6/2021
Bearish
17.37
21619
MACD Cross-Down Signal
TQQQ
ProShares UltraPro QQQ
21/6/2021
Bearish
112.41
26927
MACD-H -ve Divergence
TSM
Taiwan Semiconductor Manufacturing Company Ltd.
21/6/2021
Bearish
114.14
11116
MACD Cross-Down Signal
TTD
The Trade Desk, Inc.
21/6/2021
Bearish
61.26
6057
MACD Cross-Down Signal
UAL
United Continental Holdings, Inc.
21/6/2021
Bearish
55.69
10892
MACD Cross-Down ZeroLine
UBER
Uber Technologies, Inc.
21/6/2021
Bearish
48.12
30752
MACD Cross-Down Signal
VALE
VALE S.A.
21/6/2021
Bearish
22
25855
MACD Cross-Down Signal
VIPS
Vipshop Holdings Limited
21/6/2021
Bearish
17.65
29636
MACD Cross-Down Signal
WBA
Walgreens Boots Alliance, Inc.
21/6/2021
Bearish
51.93
5132
MACD Cross-Down Signal
X
United States Steel Corporation
21/6/2021
Bearish
23.31
23400
MACD Cross-Down Signal
XMR-USD
Monero Crypto
21/6/2021
Bearish
203.362
342682
MACD Cross-Down Signal
20210621 US Stock One-day MACD Signals
Moses Stock Scan
Free Power US Stock MACD Scan Signals AmiBroker Academy.com
Disclaimer: The above result is for illustration purpose. It is not meant to be used for buy or sell decision. We do not recommend any particular stocks on our website. If particular stocks of such are mentioned, they are meant as illustration or demonstration of Amibroker as a powerful charting software or MACD scanner. Amibroker can program to scan the stocks that have MACD buy or sell signals.
These are script generated signals. Not all scan results are shown here. The MACD signal should use with price action and confirmation. Users must understand what MACD and price action are all about before using them. If necessary you should attend a course to learn more about Technical Analysis (TA) and Moving Average Convergence Divergence, MACD.
Once again, the website does not guarantee any results or investment return based on the information and instruction you have read here. It should be used as learning aids only and if you decide to trade real money, all trading decision should be your own, and you should take your own responsibility.
Welcome to AmiBroker Academy. Thanks for visiting the site.
Moving Average Convergence Divergence, MACD Screener
MACD was developed by Gerald Appel in the late seventies.
MACD stands for Moving Average Convergence Divergence, the MACD line (red line or called fast line) and MACD signal line (blue line, or called slow line).
MACD Bullish Signal Line Cross: MACD bullish signal when red line crosses above the blue line or MACD line crosses above zero line.
MACD Bearish Signal Line Cross: MACD bearish signal when blue line crosses below red line or MACD line crosses below zero line.
MACD Scan
These are stocks picked for today.
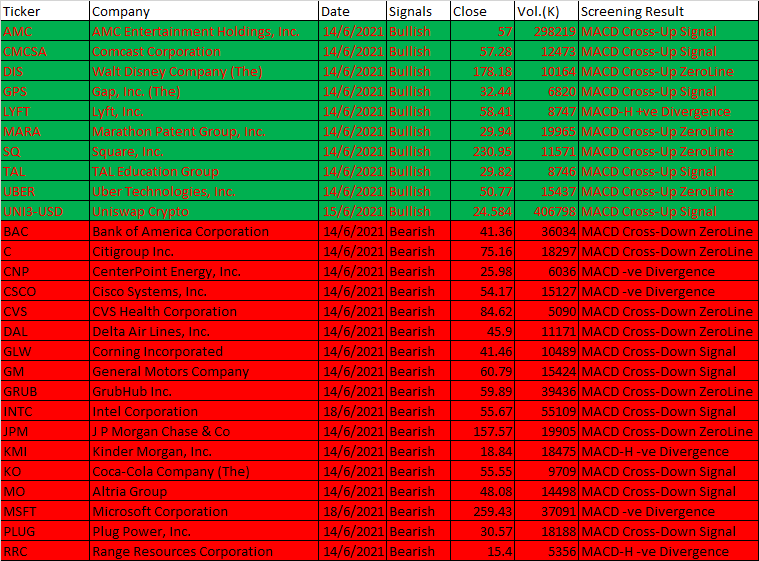
Some of 14 to 18 June, 2021 AmiBroker AFL Script Generated Five-day US Stock MACD Signals
Ticker
Company
Date
Signals
Close
Vol.(K)
Screening Result
AMC
AMC Entertainment Holdings, Inc.
14/6/2021
Bullish
57
298219
MACD Cross-Up Signal
CMCSA
Comcast Corporation
14/6/2021
Bullish
57.28
12473
MACD Cross-Up Signal
DIS
Walt Disney Company (The)
14/6/2021
Bullish
178.18
10164
MACD Cross-Up ZeroLine
GPS
Gap, Inc. (The)
14/6/2021
Bullish
32.44
6820
MACD Cross-Up Signal
LYFT
Lyft, Inc.
14/6/2021
Bullish
58.41
8747
MACD-H +ve Divergence
MARA
Marathon Patent Group, Inc.
14/6/2021
Bullish
29.94
19965
MACD Cross-Up ZeroLine
SQ
Square, Inc.
14/6/2021
Bullish
230.95
11571
MACD Cross-Up ZeroLine
TAL
TAL Education Group
14/6/2021
Bullish
29.82
8746
MACD Cross-Up Signal
UBER
Uber Technologies, Inc.
14/6/2021
Bullish
50.77
15437
MACD Cross-Up ZeroLine
UNI3-USD
Uniswap Crypto
15/6/2021
Bullish
24.584
406798
MACD Cross-Up Signal
BAC
Bank of America Corporation
14/6/2021
Bearish
41.36
36034
MACD Cross-Down ZeroLine
C
Citigroup Inc.
14/6/2021
Bearish
75.16
18297
MACD Cross-Down ZeroLine
CNP
CenterPoint Energy, Inc.
14/6/2021
Bearish
25.98
6036
MACD -ve Divergence
CSCO
Cisco Systems, Inc.
14/6/2021
Bearish
54.17
15127
MACD -ve Divergence
CVS
CVS Health Corporation
14/6/2021
Bearish
84.62
5090
MACD Cross-Down ZeroLine
DAL
Delta Air Lines, Inc.
14/6/2021
Bearish
45.9
11171
MACD Cross-Down ZeroLine
GLW
Corning Incorporated
14/6/2021
Bearish
41.46
10489
MACD Cross-Down Signal
GM
General Motors Company
14/6/2021
Bearish
60.79
15424
MACD Cross-Down Signal
GRUB
GrubHub Inc.
14/6/2021
Bearish
59.89
39436
MACD Cross-Down ZeroLine
INTC
Intel Corporation
18/6/2021
Bearish
55.67
55109
MACD Cross-Down Signal
JPM
J P Morgan Chase & Co
14/6/2021
Bearish
157.57
19905
MACD Cross-Down ZeroLine
KMI
Kinder Morgan, Inc.
14/6/2021
Bearish
18.84
18475
MACD-H -ve Divergence
KO
Coca-Cola Company (The)
14/6/2021
Bearish
55.55
9709
MACD Cross-Down Signal
MO
Altria Group
14/6/2021
Bearish
48.08
14498
MACD Cross-Down Signal
MSFT
Microsoft Corporation
18/6/2021
Bearish
259.43
37091
MACD -ve Divergence
PLUG
Plug Power, Inc.
14/6/2021
Bearish
30.57
18188
MACD Cross-Down Signal
RRC
Range Resources Corporation
14/6/2021
Bearish
15.4
5356
MACD-H -ve Divergence
202106 14 to 18 US Stock Five-day MACD Signals
Moses Stock Scan
Free Power US Stock MACD Scan Signals AmiBroker Academy.com
Disclaimer: The above result is for illustration purpose. It is not meant to be used for buy or sell decision. We do not recommend any particular stocks on our website. If particular stocks of such are mentioned, they are meant as illustration or demonstration of Amibroker as a powerful charting software or MACD scanner. Amibroker can program to scan the stocks that have MACD buy or sell signals.
These are script generated signals. Not all scan results are shown here. The MACD signal should use with price action and confirmation. Users must understand what MACD and price action are all about before using them. If necessary you should attend a course to learn more about Technical Analysis (TA) and Moving Average Convergence Divergence, MACD.
Once again, the website does not guarantee any results or investment return based on the information and instruction you have read here. It should be used as learning aids only and if you decide to trade real money, all trading decision should be your own, and you should take your own responsibility.
Welcome to AmiBroker Academy dot com, amibrokeracademy.com.
We will use 1) Ichimoku Cloud, 2) Support Resistance (using box), 3) River (moving average), 4) GMMA and Woodies CCI, 5) Bollinger Bands and Moving Averages, and 6) MACD to analyze price action. We also analyze crypto currency price action. See our posting for Bitcoin and other popular cryptocurries.
What we do is to translate price action chart into layman language for you to understand, ie Picture worth a thousand words. You can learn this too. All analysis read the price action chart differently. It is just like an essay, all reader will have different conclusion.
Trade well.
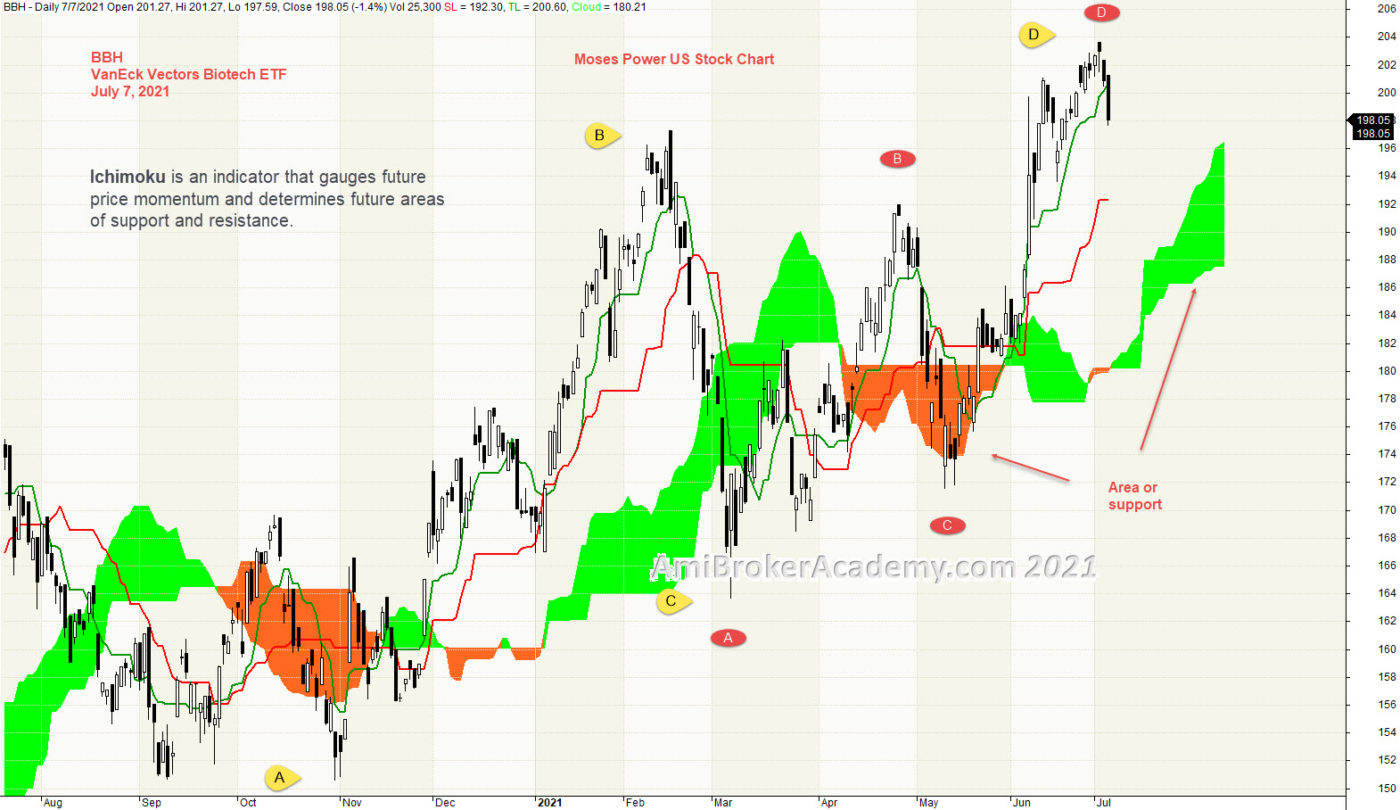
1) BBH | VanEck Vectors Biotech ETF and Ichimoku Cloud
Ichimoku Cloud is a trend following strategy tool. We see Tenkan Sen trending up from last November till February this year. In between, Tenkan cross below Kijun fail. Bull trend has ended in February this year. Tenkan Sen begin to trend again in March till present.
Ichimoku Cloud is a multi-dimensional indicator designed to offer support and resistance levels, trending, and entry and exit points. Besides that, Ichimoku is an indicator that gauges future price momentum and determine futures areas of support and resistance.
Trade what you see. See a potential support.
Manage risk is a key in trading.
Moses Free Charting
20210707 VanEck Vectors Biotech ETF and Ichimoku Cloud
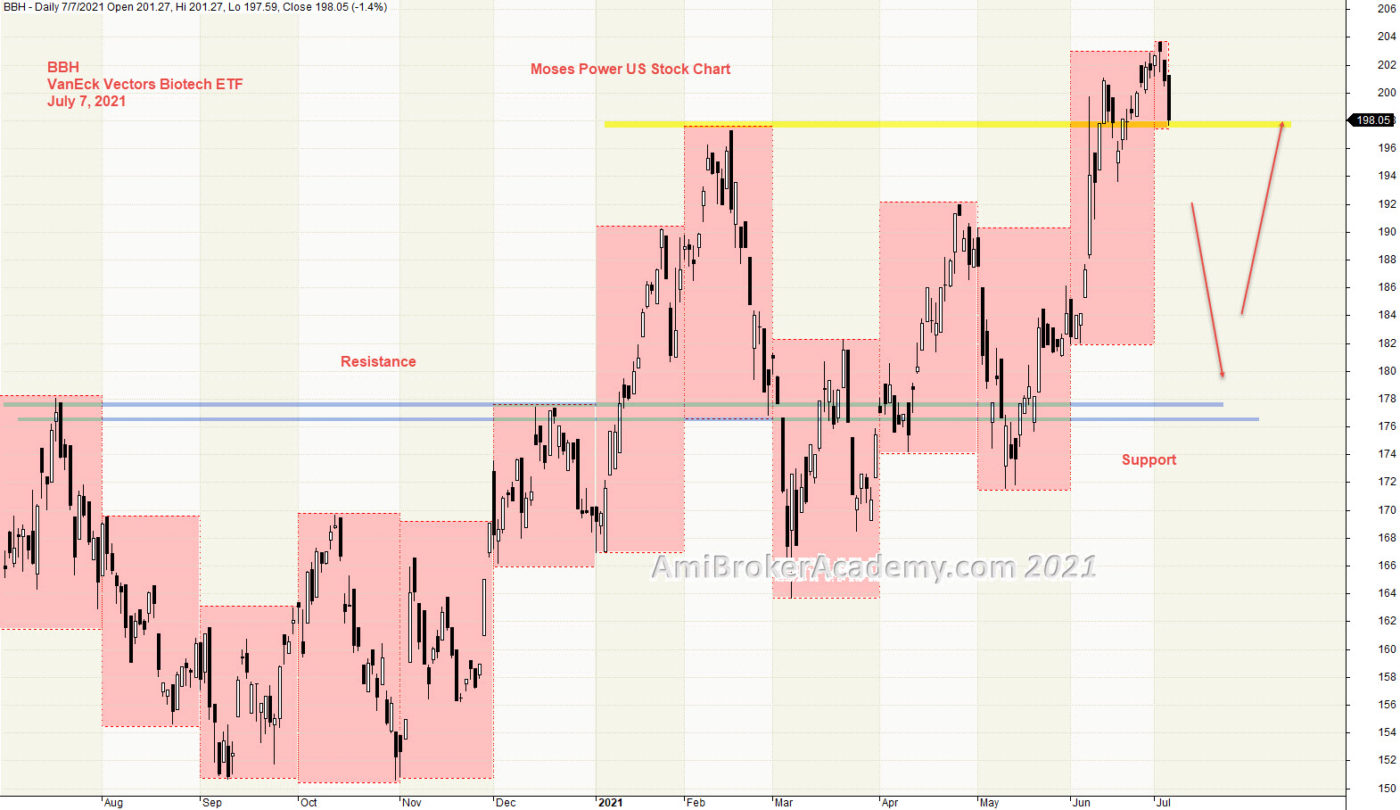
2) VanEck Vectors Biotech ETF and Support Resistance
Price Action goes from low to high. You can see price action goes from bottom left in last November to top right in June . Next the price action may pullback. The price action may test the floor, support. See chart.
We use box to box month high low to find a key level. See chart. We have plotted a strong levels. Resistance turns Support. Can the support hold the price action? Will see.
Trade what you see. Manage your risk.
20210707 VanEck Vectors Biotech ETF and Support Resistance
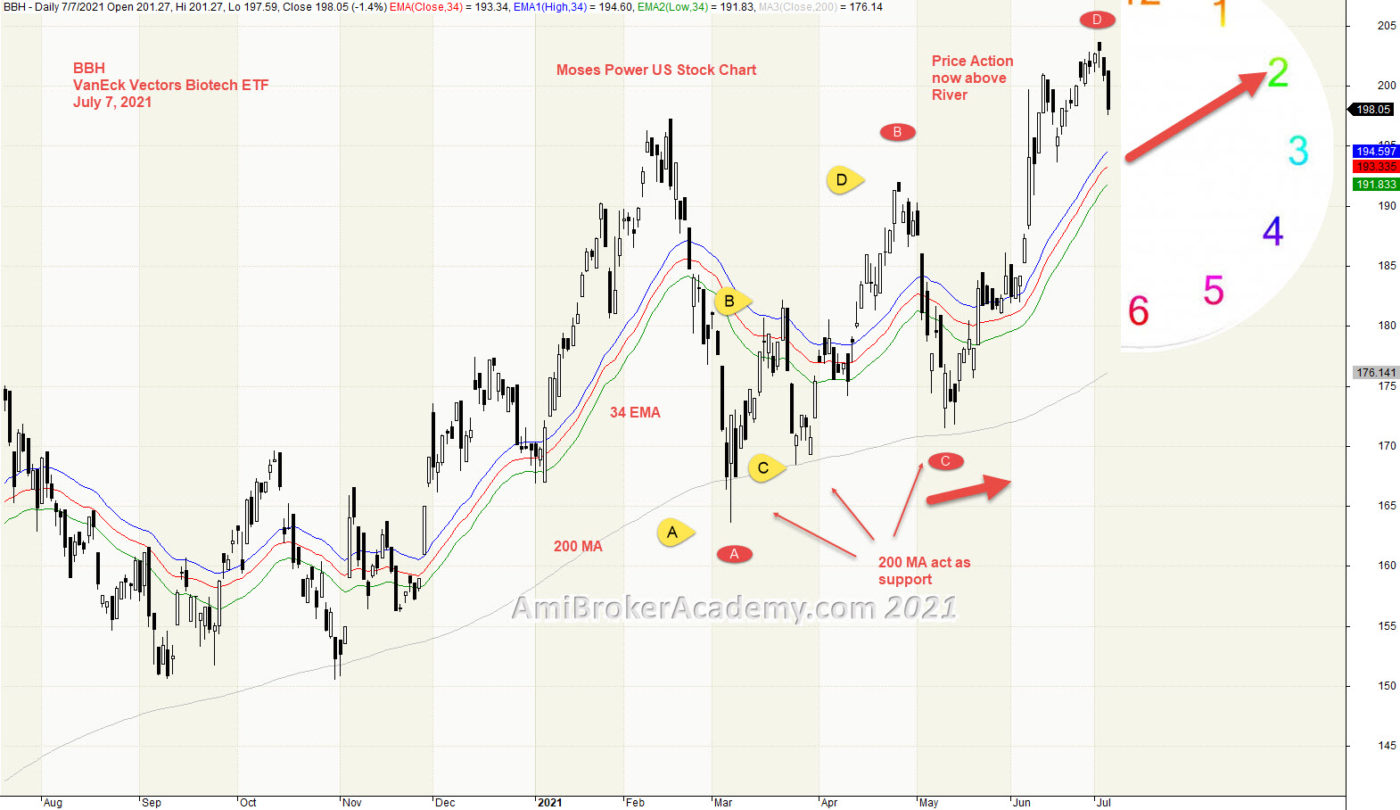
3) VanEck Vectors Biotech ETF and River
Moving Average is a great visual tool. Raghee uses high, low and close 34 EMA to form a band to determine the wave direction. Price action is currently goes from below 34 EMA to above River, bull trend? Trade what you see.
Bull trend seems strong, price action above 200 MA and supported by 200 MA.
Manage your risk.
20210707 VanEck Vectors Biotech ETF and River
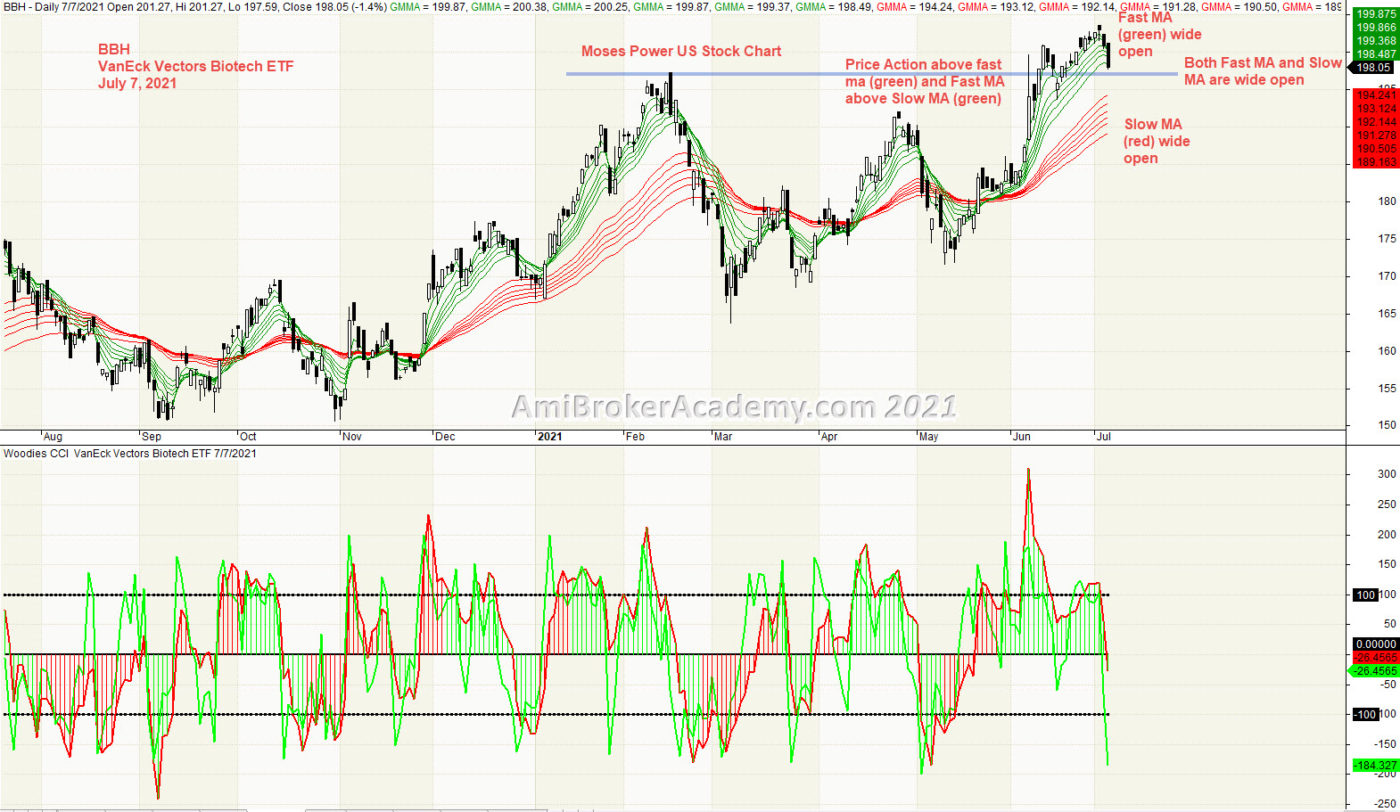
4) VanEck Vectors Biotech ETF and GMMA and Woodies CCIanEck Vectors Biotech ETF and GMMA and Woodies CCI
Price Action and Fast MA (green) goes from under Slow MA (red) to above. Fast MA and Slow MA are wide open, both Fast MA and Slow MA are stay wide apart.
From the MAs suggest that the trend my remain and continue.
20210707 VanEck Vectors Biotech ETF and GMMA and Woodies CCI
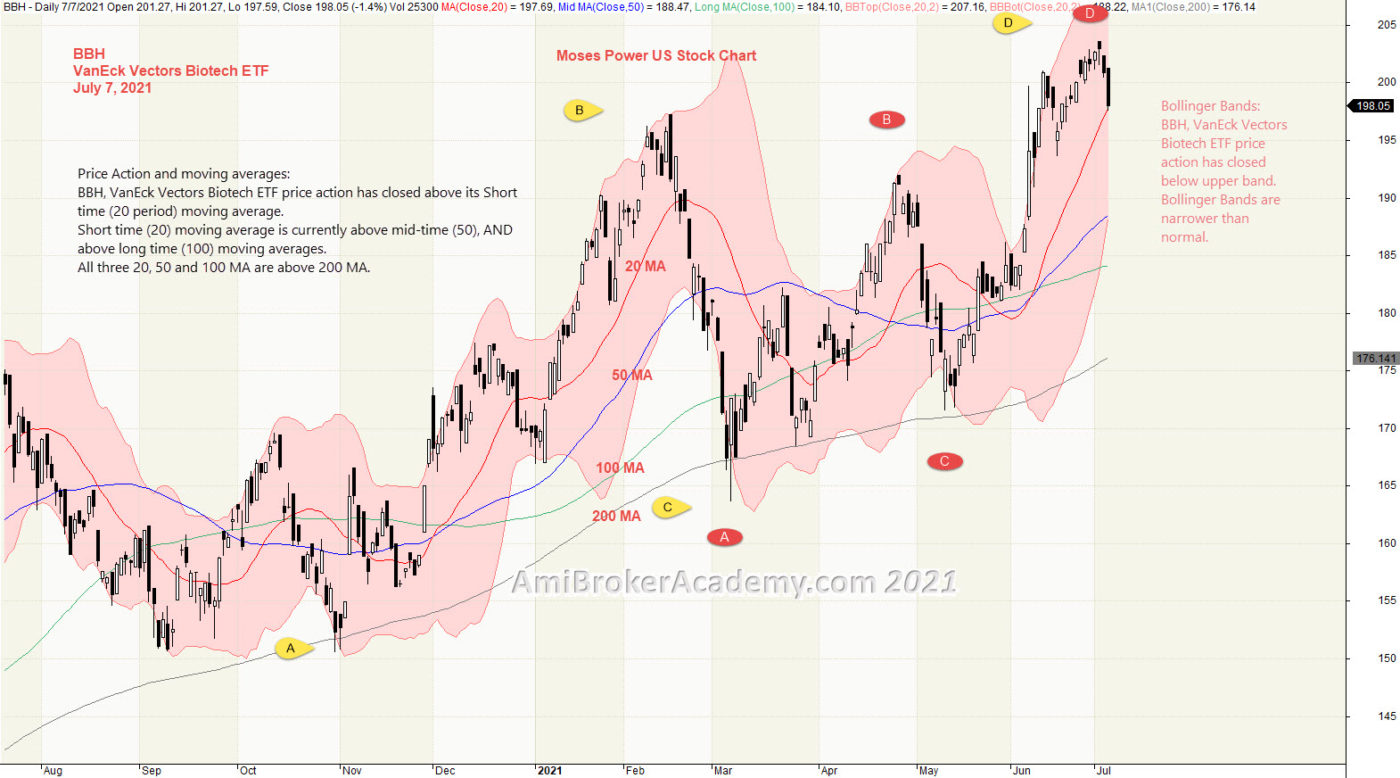
5) VanEck Vectors Biotech ETF and Bollinger Bands and Moving Averages
Price Action and moving averages: BBH, VanEck Vectors Biotech ETF price action has closed above its Short time (20 period) moving average. Short time (20) moving average is currently above mid-time (50), AND above long time (100) moving averages. All three 20, 50 and 100 MA are above 200 MA.
Bollinger Bands: BBH, VanEck Vectors Biotech ETF price action has closed below upper band. Bollinger Bands are narrower than normal.
You may also sport a few ABCD patterns. See chart.
Manage your risk.
20210707 VanEck Vectors Biotech ETF and Bollinger Bands and Moving Averages
20210707 VanEck Vectors Biotech ETF and Dow Jones Index Correlation
Moses Power Charting
Official AmiBrokerAcademy.com Charting
Disclaimer
The above result is for illustration purpose. It is not meant to be used for buy or sell decision. We do not recommend any particular stocks. If particular stocks of such are mentioned, they are meant as demonstration of Amibroker as a powerful charting software and MACD. Amibroker can program to scan the stocks for buy and sell signals.
These are script generated signals. Not all scan results are shown here. The MACD signal should use with price action. Users must understand what MACD and price action are all about before using them. If necessary you should attend a course to learn more on Technical Analysis (TA) and Moving Average Convergence Divergence, MACD.
Once again, the website does not guarantee any results or investment return based on the information and instruction you have read here. It should be used as learning aids only and if you decide to trade real money, all trading decision should be your own.
We learn from many past and present great traders. Kudo to these master.
Welcome to AmiBroker Academy dot com, amibrokeracademy.com.
We sometime bench mark stock price action with index such as Dow Index. The following example, we benchmark VanEck Vectors Biotech ETF and Dow Jones Industrial Average Index. We use other tools such as 1) Ichimoku Cloud, 2) Support Resistance (using box), 3) River (moving average), 4) GMMA and Woodies CCI, 5) Bollinger Bands and Moving Averages, and 6) MACD to analyze chart. See our simple reading of price action. We read Cryptocurrencies price action chart too.
We translate price action chart into layman language. This will help you in understand the financial instrument you are trading. We believe picture worth a thousand words. So, sometimes we use less words. You can learn the price action interpretation too. Give it a tray. You may not have the same view points as us. Remember all analysis read price action chart differently. It is just like reading an essay, we will have different conclusion.
Trade well.
Trade what you see. Manage your risk.
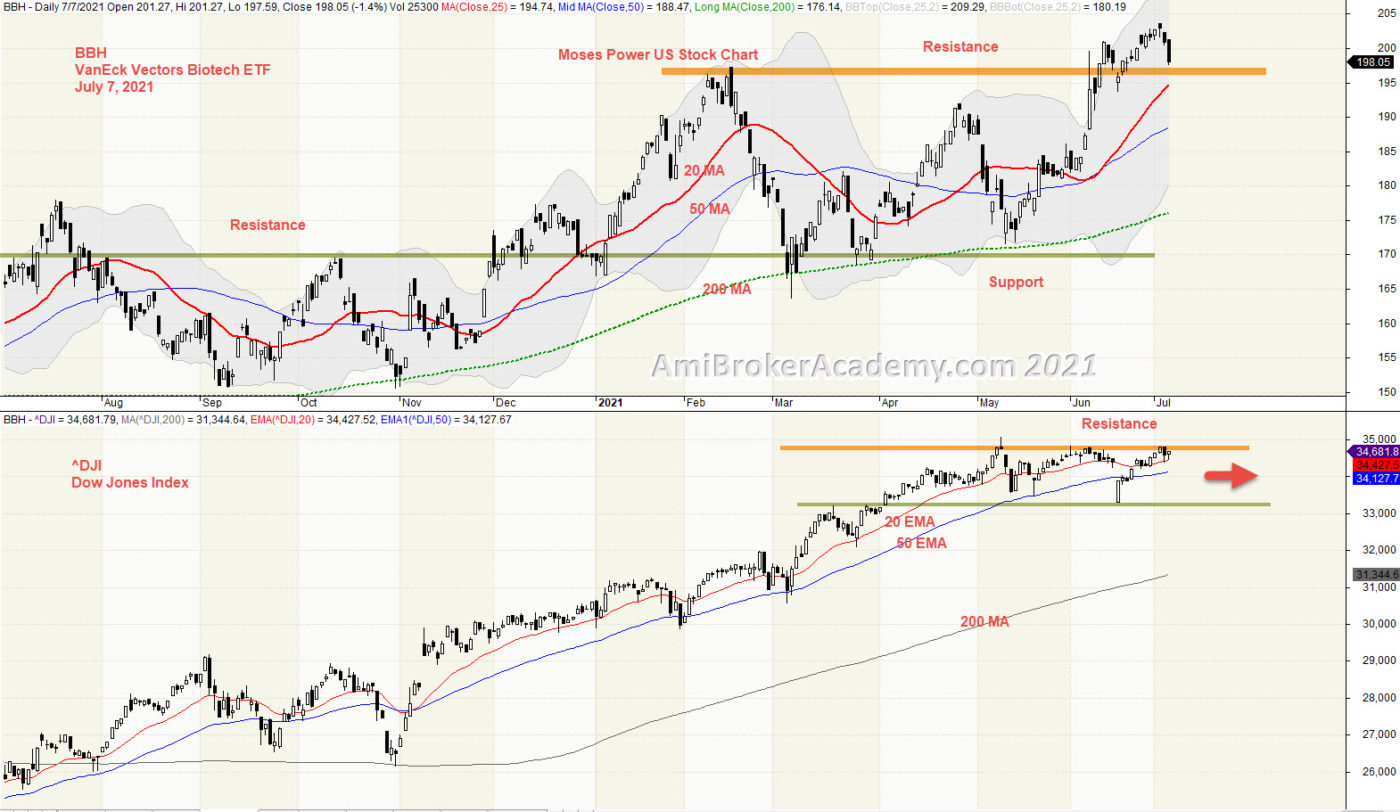
1) VanEck Vectors Biotech ETF and Dow Jones Index Correlation
We use bollinger bands to envelop VanEck Vectors Biotech ETF. VanEck Vectors Biotech ETF has move from low to high from last September. Thereafter, VanEck Vectors Biotech ETF price action fail to move higher, price action pullback to test the 200 MA. 200 MA continues to slop up. Price Action continues to test 200 MA floor. After get support from 200 MA, the price action breakout higher in June. Remember, we all highlight to buy support and sell resistance. If you have enter from support in May, and take profit in June, you will be quite okay.
Trade what you see.
Dow Jones Index price action goes from low to high. Price Action has hit the ceiling, and price action seems moving in sideways.
Remember, we just read what the chart said. Have fun!
20210707 VanEck Vectors Biotech ETF and Dow Jones Index Correlation
Moses Power Charting
Official AmiBrokerAcademy.com Charting
Disclaimer
The above result is for illustration purpose. It is not meant to be used for buy or sell decision. We do not recommend any particular stocks. If particular stocks of such are mentioned, they are meant as demonstration of Amibroker as a powerful charting software and MACD. Amibroker can program to scan the stocks for buy and sell signals.
These are script generated signals. Not all scan results are shown here. The MACD signal should use with price action. Users must understand what MACD and price action are all about before using them. If necessary you should attend a course to learn more on Technical Analysis (TA) and Moving Average Convergence Divergence, MACD.
Once again, the website does not guarantee any results or investment return based on the information and instruction you have read here. It should be used as learning aids only and if you decide to trade real money, all trading decision should be your own.
We learn from many past and present great traders. Kudo to these master.
Welcome to AmiBroker Academy dot com, amibrokeracademy.com.
We sometime bench mark stock price action with index such as Dow Index. The following example, we benchmark two US stock, Apple Inc stock and Tesla Inc stock. We use other tools such as 1) Ichimoku Cloud, 2) Support Resistance (using box), 3) River (moving average), 4) GMMA and Woodies CCI, 5) Bollinger Bands and Moving Averages, and 6) MACD to analyze chart. See our simple reading of price action. We read Cryptocurrencies price action chart too.
We translate price action chart into layman language. This will help you in understand the financial instrument you are trading. We believe picture worth a thousand words. So, sometimes we use less words. You can learn the price action interpretation too. Give it a tray. You may not have the same view points as us. Remember all analysis read price action chart differently. It is just like reading an essay, we will have different conclusion.
Trade well.
Trade what you see. Manage your risk.
True or True
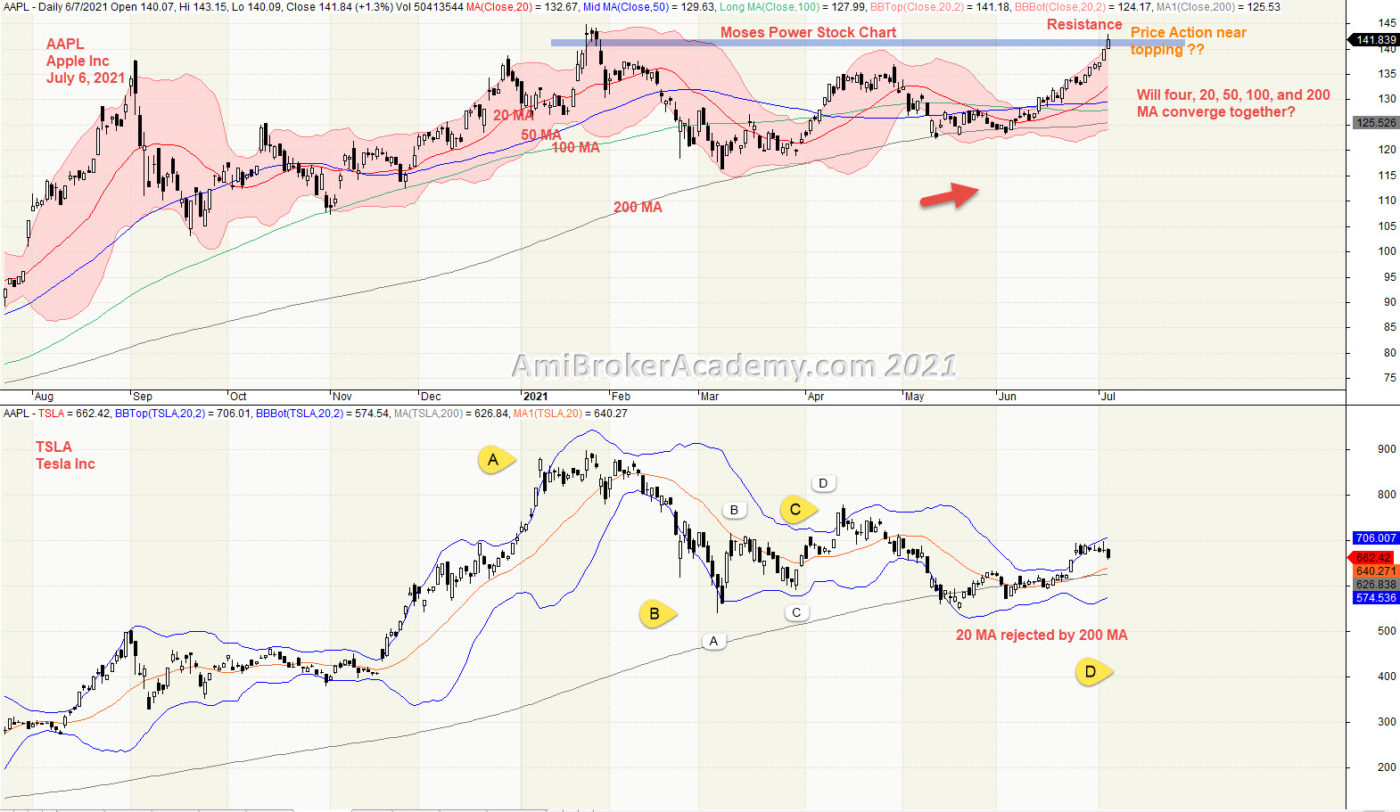
It is no secret, Apple Inc working to launch a car. Of course, the car should be a electric car. In 2014, Apple began working on “Project Titan, so eventually Apple Inc and Tesla Inc will be compete in the same market segment. Making benchmarking of both are becoming more and more valuable.
1) Apple Inc and Tesla Inc Correlation
We use bollinger bands to envelop Apple Inc and Tesla Inc. Apple Inc has move from low to high in last August. Thereafter, Apple Inc stock price action fail to move higher, price action pullback to test the 100 MA. 100 MA slopping up and continue to provide support to the price action. Next, price action test the high as last September. Very quickly, the price action breakout higher than the high last December. Price Action again retrace down, this time price action gt the support from 200 MA. Price Action get supported by 200 MA twice. Now, price action retest the high in January.
Will the price action like the last few high, first pullback before it can reach out higher. Trade what you see.
Tesla Inc price action goes from low to high in January and pullback. Price Action now get supported by 200 MA. Price Action is near Bollinger Band upper band.
We just read what the chart said. Have fun!
We all read the same chart, but we may have different conclusion.
20210706 Apple Inc and Tesla Inc Correlation
Moses Power Charting
Official AmiBrokerAcademy.com Charting
Disclaimer
The above result is for illustration purpose. It is not meant to be used for buy or sell decision. We do not recommend any particular stocks. If particular stocks of such are mentioned, they are meant as demonstration of Amibroker as a powerful charting software and MACD. Amibroker can program to scan the stocks for buy and sell signals.
These are script generated signals. Not all scan results are shown here. The MACD signal should use with price action. Users must understand what MACD and price action are all about before using them. If necessary you should attend a course to learn more on Technical Analysis (TA) and Moving Average Convergence Divergence, MACD.
Once again, the website does not guarantee any results or investment return based on the information and instruction you have read here. It should be used as learning aids only and if you decide to trade real money, all trading decision should be your own.
We learn from many past and present great traders. Kudo to these master.
Welcome to AmiBroker Academy dot com, amibrokeracademy.com.
We sometime bench mark stock price action with index such as Dow Index, and also we use other tools such as 1) Ichimoku Cloud, 2) Support Resistance (using box), 3) River (moving average), 4) GMMA and Woodies CCI, 5) Bollinger Bands and Moving Averages, and 6) MACD to analyze chart. See our simple reading of price action. We read Cryptocurrencies price action chart too.
The following we use correlation to benchmark Dow Jones Index with stock chart like Apple Inc. See chart for more.
We translate price action chart into layman language. This will help you in understand the financial instrument you are trading. We believe picture worth a thousand words. So, sometimes we use less words. You can learn the price action interpretation too. Give it a tray. You may not have the same view points as us. Remember all analysis read price action chart differently. It is just like reading an essay, we will have different conclusion.
Trade well.
Trade what you see. Manage your risk.
1) Hang Seng Index 恒生指数 and Bitcoin Crypto Correlation
We use bollinger bands to enclosed Hang Seng Index and Bitcoin cryptocurrency. Hang Seng Index is moving from low to high from last September to February. Price Action pullback and test the 100 MA, finally price action breakout below and test the 200 MA. If you study the bollinger bands also get narrow.
Bitcoin crypto also has a similar trend, price action goes from low to high and pullback. Price Action is now supported by the 200 MA.
We just read what the chart said. Have fun!
We all read the same chart, but we may have different conclusion.
20210708 Hang Seng Index 恒生指数 and Bitcoin Crypto Correlation
Moses Power Charting
Official AmiBrokerAcademy.com Charting
Disclaimer
The above result is for illustration purpose. It is not meant to be used for buy or sell decision. We do not recommend any particular stocks. If particular stocks of such are mentioned, they are meant as demonstration of Amibroker as a powerful charting software and MACD. Amibroker can program to scan the stocks for buy and sell signals.
These are script generated signals. Not all scan results are shown here. The MACD signal should use with price action. Users must understand what MACD and price action are all about before using them. If necessary you should attend a course to learn more on Technical Analysis (TA) and Moving Average Convergence Divergence, MACD.
Once again, the website does not guarantee any results or investment return based on the information and instruction you have read here. It should be used as learning aids only and if you decide to trade real money, all trading decision should be your own.
We learn from many past and present great traders. Kudo to these master.
Welcome to AmiBroker Academy dot com, amibrokeracademy.com.
We will use 1) Ichimoku Cloud, 2) Support Resistance (using box), 3) River (moving average), 4) GMMA and Woodies CCI, 5) Bollinger Bands and Moving Averages, and 6) MACD to analyze price action. We also analyze crypto currency price action. See our posting for Bitcoin and other popular cryptocurries.
What we do is to translate price action chart into layman language for you to understand, ie Picture worth a thousand words. You can learn this too. All analysis read the price action chart differently. It is just like an essay, all reader will have different conclusion.
Trade well.
1) 000001.SS | Shanghai Stock Exchange Composite Index and Ichimoku Cloud
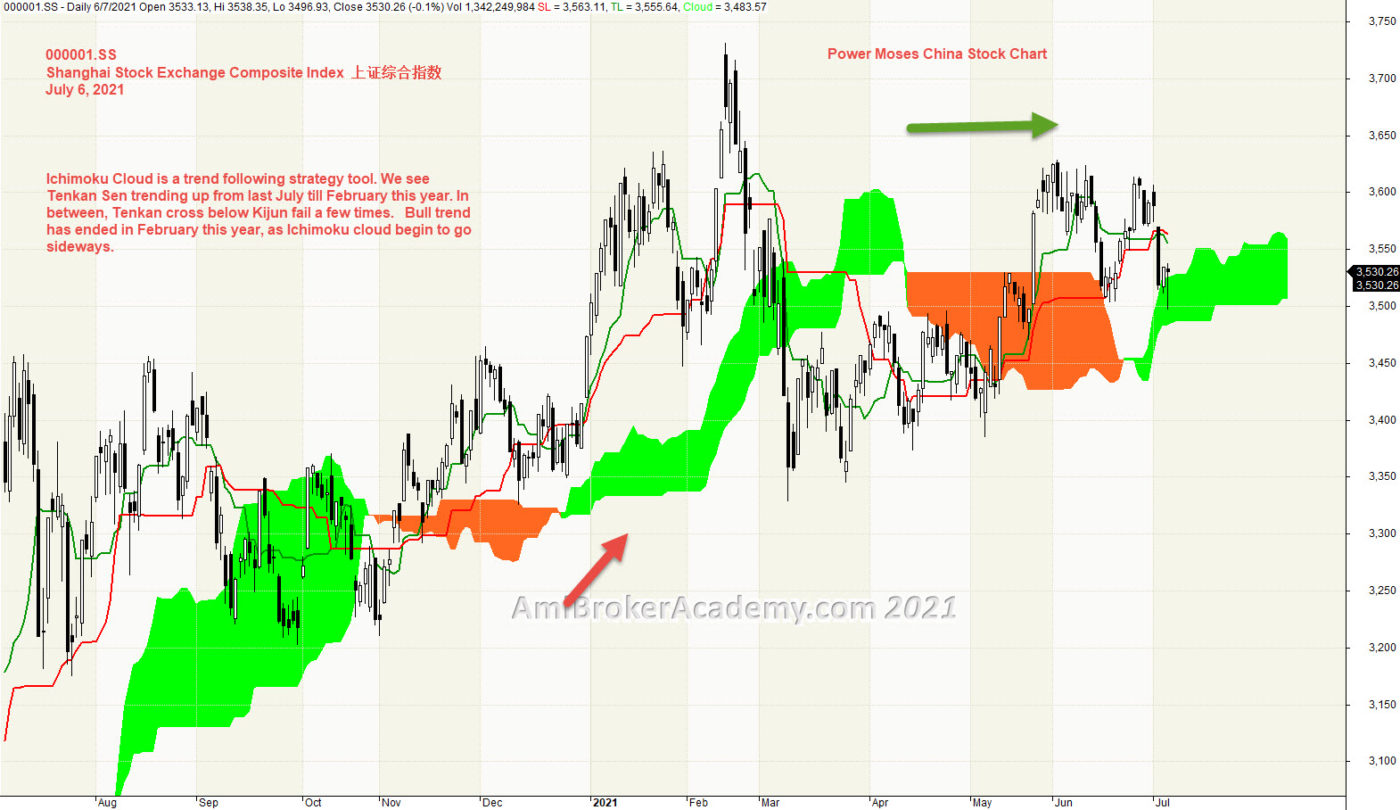
Ichimoku Cloud is a trend following strategy tool. We see Tenkan Sen trending up from last July till February this year. In between, Tenkan cross below Kijun fail a few times. Bull trend has ended in February this year, as Ichimoku cloud begin to go sideways.
Ichimoku Cloud is a multi-dimensional indicator designed to offer support and resistance levels, trending, and entry and exit points. Price Action after test the high and pullback and close below cloud. Price Action now stay inside cloud, ie sideways.
Trade what you see.
Manage risk is a key in trading.
Moses Free Charting
20210706 Shanghai Stock Exchange Composite Index and Ichimoku Cloud
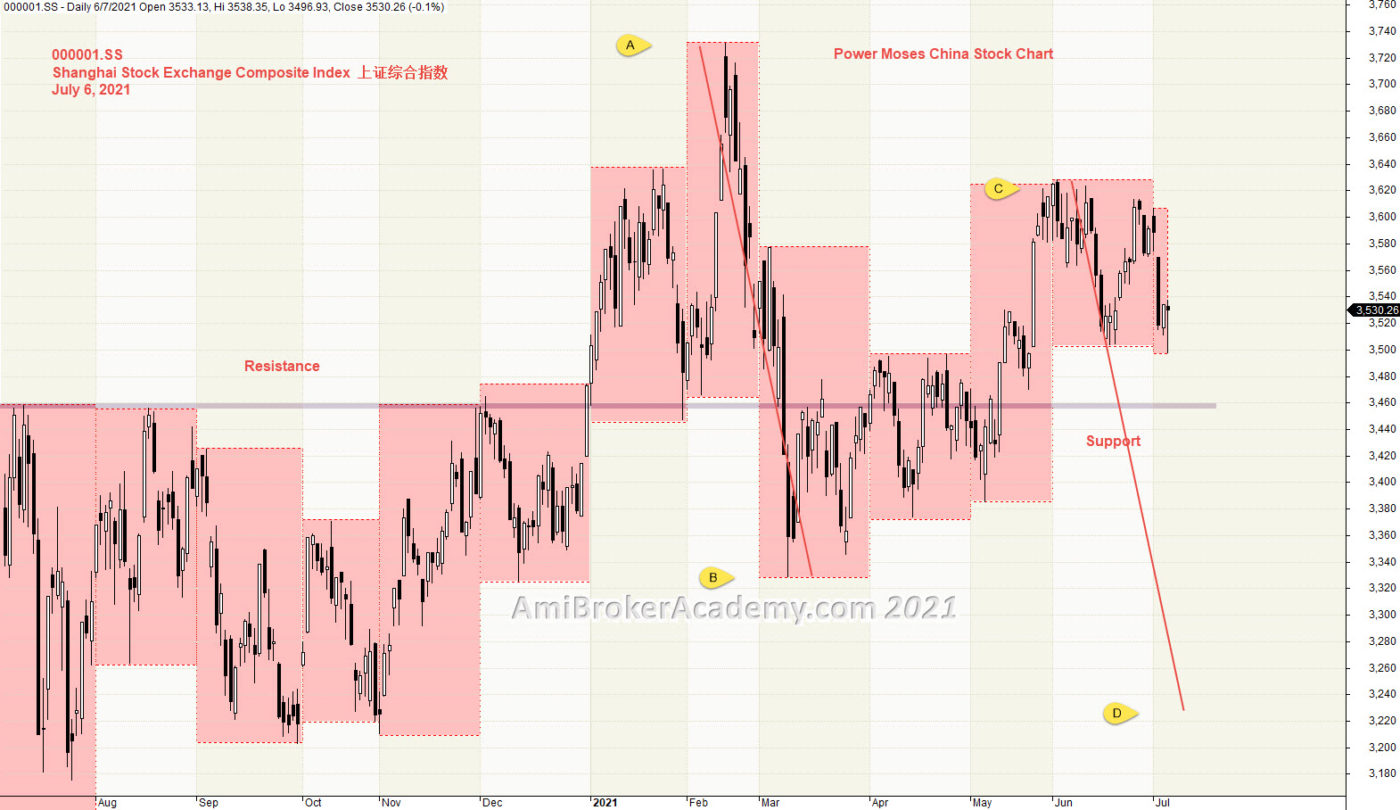
2) Shanghai Stock Exchange Composite Index Support Resistance
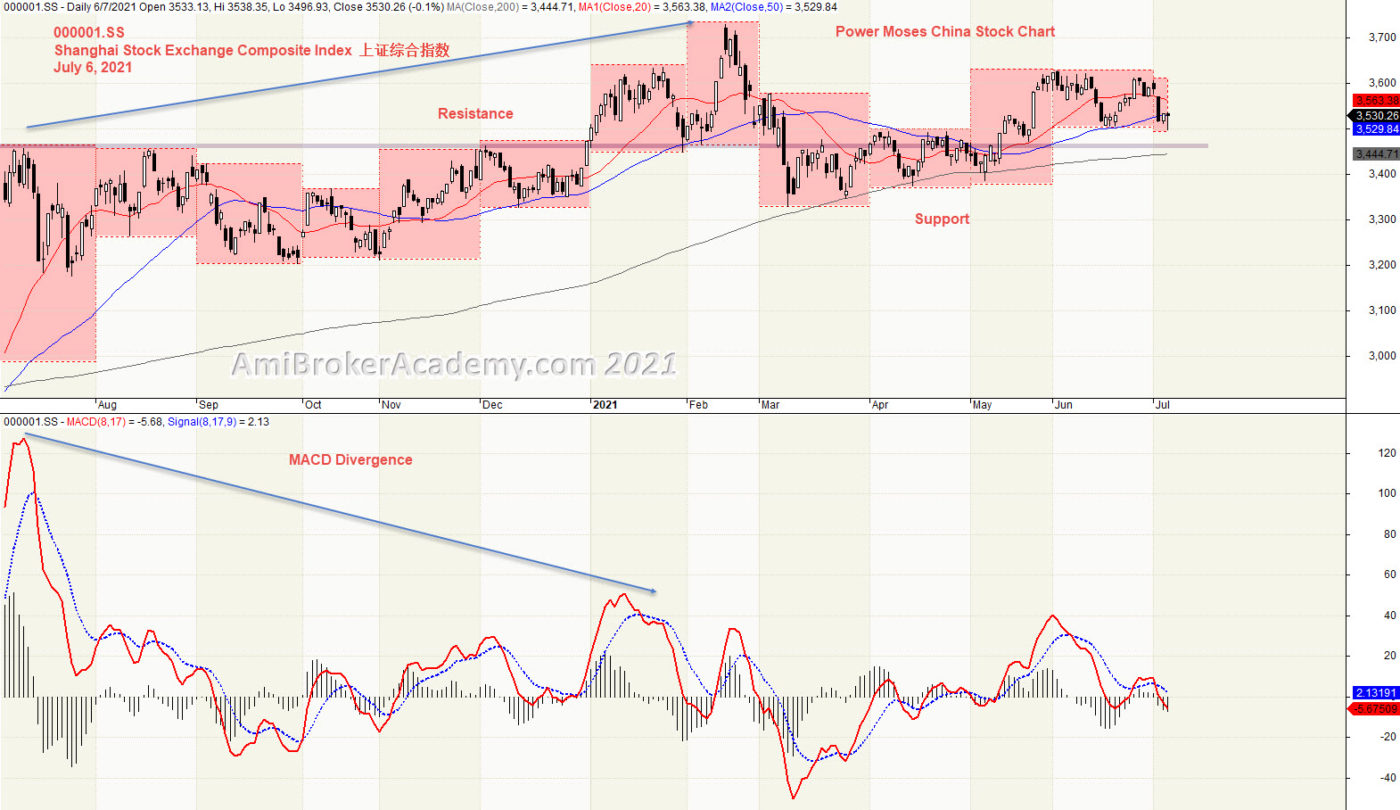
Price Action goes from low to high, pullback and reverse. You can see price action goes from bottom left in last August to top in February and pullback. Next the price action rebounce up again. However, the price action and fail again. Spot the possible ABCD wave pattern. We expect CD leg is in progress.
We use box to box month high low to find a key level. See chart. We have plotted a strong levels. Resistance turns Support. Can the support hold the price action? Will see.
Trade what you see. Manage your risk.
20210706 Shanghai Stock Exchange Composite Index Support Resistance
3) Shanghai Stock Exchange Composite Index and River
Moving Average is a great visual tool. Raghee uses high, low and close 34 EMA to form a band to determine the wave direction. Price action is currently goes from below 34 EMA to above River, full trend? Trade what you see.
20210706 Shanghai Stock Exchange Composite Index and River
4) Shanghai Stock Exchange Composite Index and GMMA and Woodies CCI
Price Action and Fast MA (green) goes from above to down under Slow MA (red), Fast MA (green) and Price Action both stay below Slow MA (red) for two months before return to above Slow MA again.
Slow MA (red) from open to squeeze. Means what?
20210706 Shanghai Stock Exchange Composite Index and GMMA and Woodies CCI
5) Shanghai Stock Exchange Composite Index and Bollinger Bands and Moving Averages
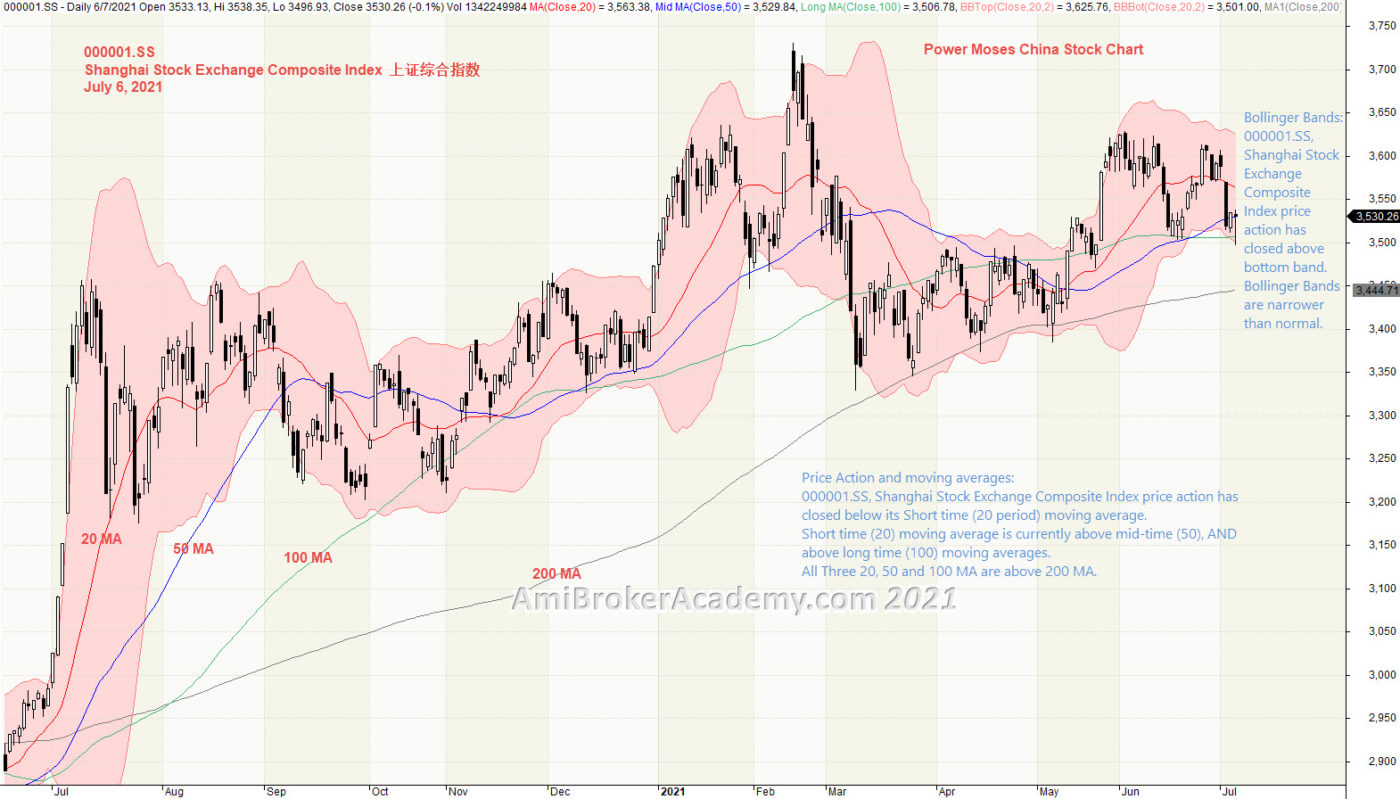
Price Action and moving averages: 000001.SS, Shanghai Stock Exchange Composite Index price action has closed below its Short time (20 period) moving average. Short time (20) moving average is currently above mid-time (50), AND above long time (100) moving averages. All Three 20, 50 and 100 MA are above 200 MA.
Bollinger Bands: 000001.SS, Shanghai Stock Exchange Composite Index price action has closed above bottom band. Bollinger Bands are narrower than normal.
Manage your risk.
20210706 Shanghai Stock Exchange Composite Index and Bollinger Bands and Moving Averages
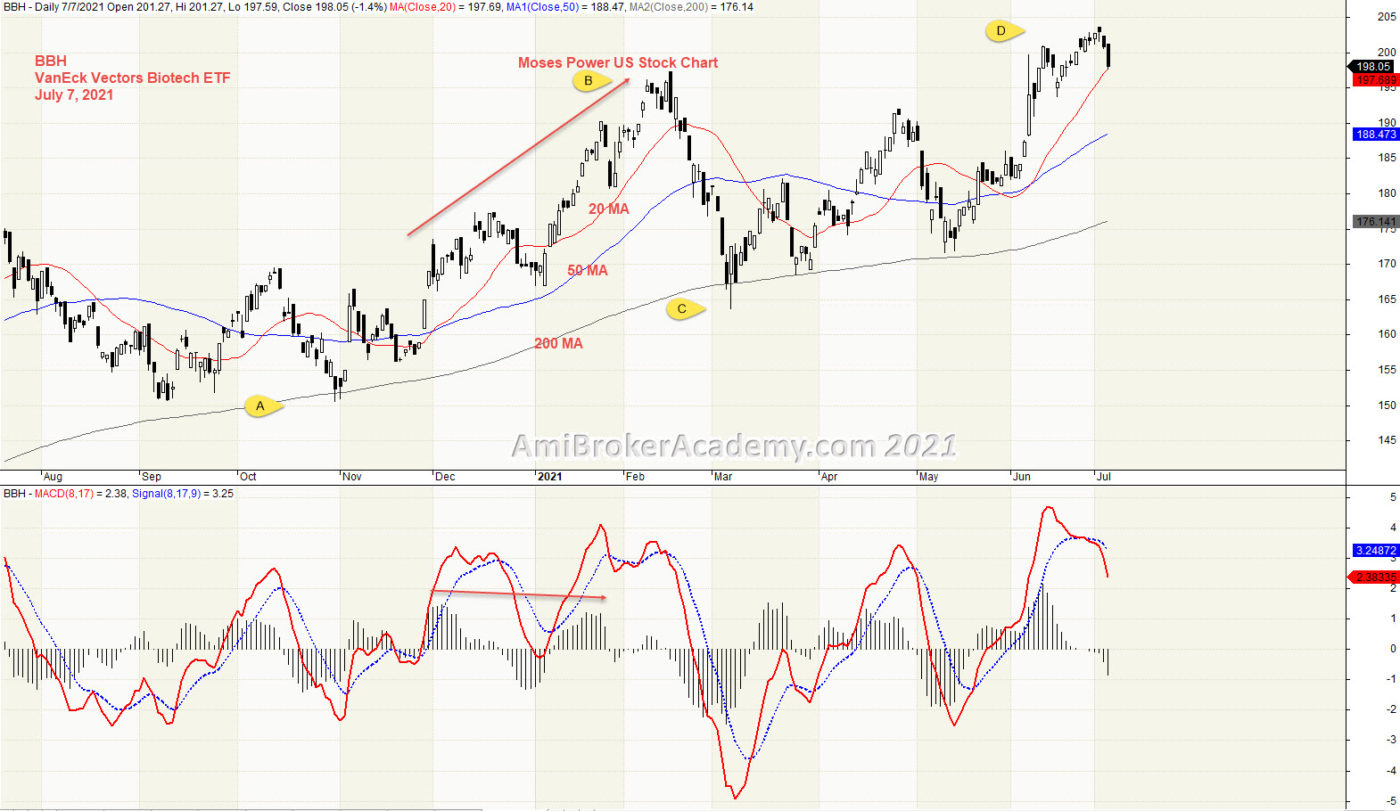
6) Shanghai Stock Exchange Composite Index and MACD
We see price action continues to go higher and pullback. Remember all these can not come without any signals.
Don’t take MACD Divergence lightly.
20210706 Shanghai Stock Exchange Composite Index and MACD
20210706 Shanghai Stock Exchange Composite Index and Dow Jones Index and Correlation
Moses Power Charting
Official AmiBrokerAcademy.com Charting
Disclaimer
The above result is for illustration purpose. It is not meant to be used for buy or sell decision. We do not recommend any particular stocks. If particular stocks of such are mentioned, they are meant as demonstration of Amibroker as a powerful charting software and MACD. Amibroker can program to scan the stocks for buy and sell signals.
These are script generated signals. Not all scan results are shown here. The MACD signal should use with price action. Users must understand what MACD and price action are all about before using them. If necessary you should attend a course to learn more on Technical Analysis (TA) and Moving Average Convergence Divergence, MACD.
Once again, the website does not guarantee any results or investment return based on the information and instruction you have read here. It should be used as learning aids only and if you decide to trade real money, all trading decision should be your own.
We learn from many past and present great traders. Kudo to these master.
Welcome to AmiBroker Academy dot com, amibrokeracademy.com.
We sometime bench mark stock price action with index such as Dow Index, and also we use other tools such as 1) Ichimoku Cloud, 2) Support Resistance (using box), 3) River (moving average), 4) GMMA and Woodies CCI, 5) Bollinger Bands and Moving Averages, and 6) MACD to analyze chart. See our simple reading of price action. We read Cryptocurrencies price action chart too.
The following we use correlation to benchmark Dow Jones Index with stock chart like Apple Inc. See chart for more.
We translate price action chart into layman language. This will help you in understand the financial instrument you are trading. We believe picture worth a thousand words. So, sometimes we use less words. You can learn the price action interpretation too. Give it a tray. You may not have the same view points as us. Remember all analysis read price action chart differently. It is just like reading an essay, we will have different conclusion.
Trade well.
Trade what you see. Manage your risk.
1) Apple Inc and Dow Jones Index Correlation
We use box to box month high low to analyze Apple Inc and Dow Jones Industrial Average Index. Apple Inc is moving along the support level. This happen from last December. Apple Inc stock is on the floor. But this is not true for US Stock Market, when you reference to Dow Jones Index, see chart. Dow Index only test the resistance in last three months.
We just read what the chart said. Have fun!
We all read the same chart, but we may have different conclusion.
20210706 Apple Inc and Dow Jones Index Correlation
Moses Power Charting
Official AmiBrokerAcademy.com Charting
Disclaimer
The above result is for illustration purpose. It is not meant to be used for buy or sell decision. We do not recommend any particular stocks. If particular stocks of such are mentioned, they are meant as demonstration of Amibroker as a powerful charting software and MACD. Amibroker can program to scan the stocks for buy and sell signals.
These are script generated signals. Not all scan results are shown here. The MACD signal should use with price action. Users must understand what MACD and price action are all about before using them. If necessary you should attend a course to learn more on Technical Analysis (TA) and Moving Average Convergence Divergence, MACD.
Once again, the website does not guarantee any results or investment return based on the information and instruction you have read here. It should be used as learning aids only and if you decide to trade real money, all trading decision should be your own.
We learn from many past and present great traders. Kudo to these master.
Welcome to AmiBroker Academy dot com, amibrokeracademy.com.
We will use 1) Ichimoku Cloud, 2) Support Resistance (using box), 3) River (moving average), 4) GMMA and Woodies CCI, 5) Bollinger Bands and Moving Averages, and 6) MACD to analyze chart. See our simple reading of price action. We also reading Cryptocurrencies price action chart.
We also use correlation to benchmark Dow Jones Index with stock chart like Shanghai Stock Exchange Composite Index 上证综合指数. See chart for more.
We translate price action chart into layman language. This will help you in understand the financial instrument you are trading. We believe picture worth a thousand words. So, sometimes we use less words. You can learn the price action interpretation too. Give it a tray. You may not have the same view points as us. Remember all analysis read price action chart differently. It is just like reading an essay, we will have different conclusion.
Trade well.
Trade what you see. Manage your risk.
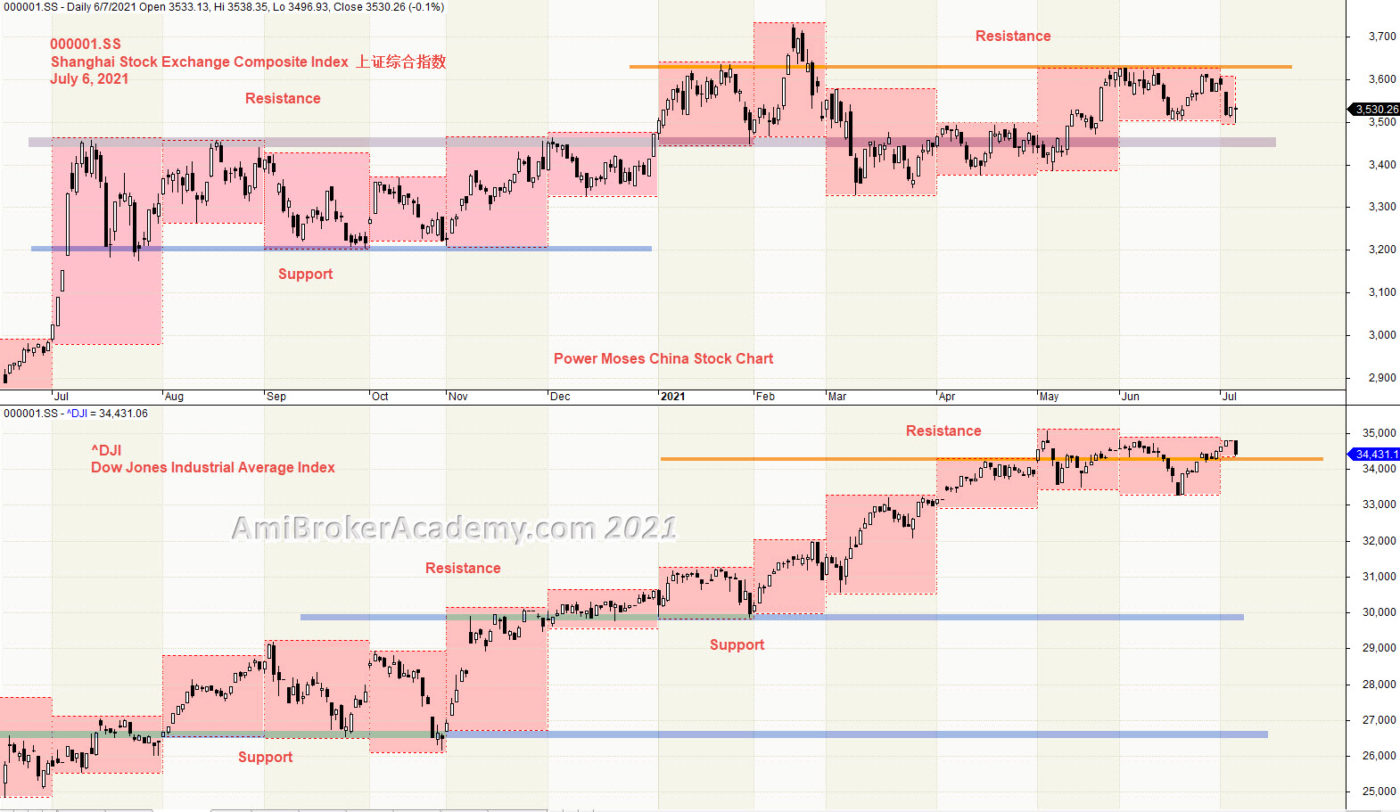
1) Shanghai Stock Exchange Composite Index 上证综合指数 and Dow Jones Index and Correlation
Shanghai Stock Exchange Composite Index is moving along the resistance region. This happen way back in the start of 2021. China Stock Index has hit the ceiling. But this is not true for US Stock Market, when you reference Dow Jones Index, see chart. Dow Index only test the resistance in last three months.
We just read what the chart said. Have fun!
We all read the same chart, but we may read some other do not pick up.
20210706 Shanghai Stock Exchange Composite Index 上证综合指数 and Dow Jones Index and Correlation
Moses Power Charting
Official AmiBrokerAcademy.com Charting
Disclaimer
The above result is for illustration purpose. It is not meant to be used for buy or sell decision. We do not recommend any particular stocks. If particular stocks of such are mentioned, they are meant as demonstration of Amibroker as a powerful charting software and MACD. Amibroker can program to scan the stocks for buy and sell signals.
These are script generated signals. Not all scan results are shown here. The MACD signal should use with price action. Users must understand what MACD and price action are all about before using them. If necessary you should attend a course to learn more on Technical Analysis (TA) and Moving Average Convergence Divergence, MACD.
Once again, the website does not guarantee any results or investment return based on the information and instruction you have read here. It should be used as learning aids only and if you decide to trade real money, all trading decision should be your own.
We learn from many past and present great traders. Kudo to these master.
Welcome to AmiBroker Academy dot com, amibrokeracademy.com.
We will use 1) Ichimoku Cloud, 2) Support Resistance (using box), 3) River (moving average), 4) GMMA and Woodies CCI, 5) Bollinger Bands and Moving Averages, and 6) MACD to analyze price action. We also analyze crypto currency price action. See our posting for Bitcoin and other popular cryptocurries.
What we do is to translate price action chart into layman language for you to understand, ie Picture worth a thousand words. You can learn this too. All analysis read the price action chart differently. It is just like an essay, all reader will have different conclusion.
Trade well.
Olympics
Japanese stock investors talk up benefits of shelving Olympics. There are two sides of the coin, win or loss. Some say yes, but other say no. Same, for stock, if price action does not goes up, the price action will come down. Trade what you see.
Don’t follow the wrong guy. Others run Olympics your also wanting to run. Others benefit from it, and you get into unnecessary investment. Don’t play play and like a fool.
1) ^N225 | Nikkei 225 Index and Ichimoku Cloud
Ichimoku Cloud is a trend following strategy tool. We see Tenkan Sen trending up from last November till February this year. In between, Tenkan cross below Kijun fail a few times. Bull trend has ended in February this year, as Ichimoku cloud begin to go sideways.
Ichimoku Cloud is a multi-dimensional indicator designed to offer support and resistance levels, trending, and entry and exit points. Price Action after test the high and pullback and close below cloud. Price Action now stay inside cloud, ie sideways.
Trade what you see.
Manage risk is a key in trading.
Moses Free Charting
20210702 Nikkei 225 Index and Ichimoku Cloud
2) Nikkei 225 Index and Support Resistance
Price Action goes from low to high and pullback. You can see price action goes from bottom left in last December to top in February and pullback. However, the price action fail to go higher in February. From the box, the month high low last December is the most volatile month.
We use box to box month high low to find a key level. See chart. We have plotted two strong levels. Can the support hold the price action? Will see.
Trade what you see. Manage your risk.
20210702 Nikkei 225 Index and Support Resistance
3) Nikkei 225 Index and River
Moving Average is a great visual tool. Raghee uses high, low and close 34 EMA to form a band to determine the wave direction. Price action is currently close below 34 EMA and 34 EMA slopping down, bear trend? Trade what you see.
Down trend seems strong, price action close below River. River cross draw near 200 MA, but still far from dead cross. Price Action trapped between Fast (34 EMA) and Slow (200 MA).
Manage your risk.
20210702 Nikkei 225 Index and River
4) Nikkei 225 Index and GMMA and Woodies CCI
Price Action and Fast MA (green) crosses down under Slow MA (red), Fast MA (green) and Price Action both stay below Slow MA (red). Price Action is resisted by Fast (green). Can the price action retrace above Slow MA (red)? Will see. Trade with eyes open.
Slow MA (red) from open to squeeze. Means what?
5) Nikkei 225 Index and Bollinger Bands and Moving Averages
Price Action and moving averages: ^N225, Nikkei 225 Index price action has closed below its Short time (20 period) moving average. Short time (20) moving average is currently above mid-time (50), AND above long time (100) moving averages. 20, 50 and 100 MA are twisted together, and three MA, 20, 50, and 100 are above 200 longer time MA.
Bollinger Bands: ^N225, Nikkei 225 price action has closed above bottom band. Bollinger Bands are narrower than normal.
In addition, can you also spot an ABCD wave pattern.
Manage your risk.
July 2, 2021 Japan Nikkei 225 Index and Bollinger Bands and Moving Averages
6) Nikkei 225 Index and MACD
We see price action continues to go higher next we see price action forms three lower low. Remember all these can not come without any signals.
20210702 Nikkei 225 Index and Dow Jones Index Correlation
Moses Power Charting
Official AmiBrokerAcademy.com Charting
Disclaimer
The above result is for illustration purpose. It is not meant to be used for buy or sell decision. We do not recommend any particular stocks. If particular stocks of such are mentioned, they are meant as demonstration of Amibroker as a powerful charting software and MACD. Amibroker can program to scan the stocks for buy and sell signals.
These are script generated signals. Not all scan results are shown here. The MACD signal should use with price action. Users must understand what MACD and price action are all about before using them. If necessary you should attend a course to learn more on Technical Analysis (TA) and Moving Average Convergence Divergence, MACD.
Once again, the website does not guarantee any results or investment return based on the information and instruction you have read here. It should be used as learning aids only and if you decide to trade real money, all trading decision should be your own.
We learn from many past and present great traders. Kudo to these master.
Welcome to AmiBroker Academy dot com, amibrokeracademy.com.
We will use 1) Ichimoku Cloud, 2) Support Resistance (using box), 3) River (moving average), 4) GMMA and Woodies CCI, 5) Bollinger Bands and Moving Averages, and 6) MACD to analyze chart. See our simple reading of price action. We also reading Cryptocurrencies price action chart.
We also use correlation to benchmark Dow Jones Index with stock chart like Autoliv. See chart for more.
We translate price action chart into layman language. This will help you in understand the financial instrument you are trading. We believe picture worth a thousand words. So, sometimes we use less words. You can learn the price action interpretation too. Give it a tray. You may not have the same view points as us. Remember all analysis read price action chart differently. It is just like reading an essay, we will have different conclusion.
Trade well.
Trade what you see. Manage your risk.
1) Autoliv and Dow Jones Industrial Average Index Correlation
20210702 Autoliv and Dow Jones Industrial Average Index Correlation
Moses Power Charting
Official AmiBrokerAcademy.com Charting
Disclaimer
The above result is for illustration purpose. It is not meant to be used for buy or sell decision. We do not recommend any particular stocks. If particular stocks of such are mentioned, they are meant as demonstration of Amibroker as a powerful charting software and MACD. Amibroker can program to scan the stocks for buy and sell signals.
These are script generated signals. Not all scan results are shown here. The MACD signal should use with price action. Users must understand what MACD and price action are all about before using them. If necessary you should attend a course to learn more on Technical Analysis (TA) and Moving Average Convergence Divergence, MACD.
Once again, the website does not guarantee any results or investment return based on the information and instruction you have read here. It should be used as learning aids only and if you decide to trade real money, all trading decision should be your own.
We learn from many past and present great traders. Kudo to these master.
Welcome to AmiBroker Academy. Thanks for visiting the site.
Moving Average Convergence Divergence, MACD Screener
MACD was developed by Gerald Appel in the late seventies.
MACD stands for Moving Average Convergence Divergence, the MACD line (red line or called fast line) and MACD signal line (blue line, or called slow line).
MACD Bullish Signal Line Cross: MACD bullish signal when red line crosses above the blue line or MACD line crosses above zero line.
MACD Bearish Signal Line Cross: MACD bearish signal when blue line crosses below red line or MACD line crosses below zero line.
MACD Scan
These are stocks picked for today.
Some of 11 June, 2021 AmiBroker AFL Script Generated One-day US Stock MACD Signals
Ticker
Company
Date
Signals
Close
Vol.(K)
Screening Result
AAPL
Apple Inc.
11/6/2021
Bullish
127.35
53415
MACD Cross-Up ZeroLine
ABT
Abbott Laboratories
11/6/2021
Bullish
109.91
6517
MACD Cross-Up Signal
COG
Cabot Oil & Gas Corporation
11/6/2021
Bullish
17.28
9382
MACD Cross-Up ZeroLine
KMI
Kinder Morgan, Inc.
11/6/2021
Bullish
19.14
17406
MACD Cross-Up Signal
KO
Coca-Cola Company (The)
11/6/2021
Bullish
56.16
11816
MACD Cross-Up Signal
MX
MagnaChip Semiconductor Corporation
11/6/2021
Bullish
25.91
6683
MACD Cross-Up Signal
NCTY
The9 Limited
11/6/2021
Bullish
19.37
6592
MACD Cross-Up ZeroLine
PM
Philip Morris International Inc
11/6/2021
Bullish
98.84
5530
MACD Cross-Up Signal
PPL
PPL Corporation
11/6/2021
Bullish
29.33
6017
MACD Cross-Up Signal
TJX
TJX Companies, Inc. (The)
11/6/2021
Bullish
65.76
7653
MACD Cross-Up Signal
AGNC
AGNC Investment Corp.
11/6/2021
Bearish
17.71
25926
MACD Cross-Down ZeroLine
AMC
AMC Entertainment Holdings, Inc.
11/6/2021
Bearish
49.4
215932
MACD Cross-Down Signal
APA
Apache Corporation
11/6/2021
Bearish
22.63
5807
MACD Cross-Down Signal
ETH-USD
Ethereum
11/6/2021
Bearish
2353.769
24832564
MACD Cross-Down Signal
NUAN
Nuance Communications, Inc.
11/6/2021
Bearish
54.93
13546
MACD -ve Divergence
OXY
Occidental Petroleum Corporation
11/6/2021
Bearish
28.33
10849
MACD Cross-Down Signal
RAMP
LiveRamp Holdings, Inc.
11/6/2021
Bearish
41.75
6952
MACD Cross-Down ZeroLine
SLB
Schlumberger N.V.
11/6/2021
Bearish
34.89
7241
MACD Cross-Down Signal
UNI3-USD
Uniswap
11/6/2021
Bearish
21.851
390924
MACD Cross-Down Signal
VRTX
Vertex Pharmaceuticals Incorporated
11/6/2021
Bearish
193.02
13721
MACD Cross-Down Signal
WMB
Williams Companies, Inc. (The)
11/6/2021
Bearish
27.79
7263
MACD Cross-Down Signal
20210611 US Stock One-day MACD Signals
Moses Stock Scan
Free Power US Stock MACD Scan Signals AmiBroker Academy.com
Disclaimer: The above result is for illustration purpose. It is not meant to be used for buy or sell decision. We do not recommend any particular stocks on our website. If particular stocks of such are mentioned, they are meant as illustration or demonstration of Amibroker as a powerful charting software or MACD scanner. Amibroker can program to scan the stocks that have MACD buy or sell signals.
These are script generated signals. Not all scan results are shown here. The MACD signal should use with price action and confirmation. Users must understand what MACD and price action are all about before using them. If necessary you should attend a course to learn more about Technical Analysis (TA) and Moving Average Convergence Divergence, MACD.
Once again, the website does not guarantee any results or investment return based on the information and instruction you have read here. It should be used as learning aids only and if you decide to trade real money, all trading decision should be your own, and you should take your own responsibility.
Welcome to AmiBroker Academy. Thanks for visiting the site.
Moving Average Convergence Divergence, MACD Screener
MACD was developed by Gerald Appel in the late seventies.
MACD stands for Moving Average Convergence Divergence, the MACD line (red line or called fast line) and MACD signal line (blue line, or called slow line).
MACD Bullish Signal Line Cross: MACD bullish signal when red line crosses above the blue line or MACD line crosses above zero line.
MACD Bearish Signal Line Cross: MACD bearish signal when blue line crosses below red line or MACD line crosses below zero line.
MACD Scan
These are stocks picked for today.
Some of 7 to 11 June, 2021 AmiBroker AFL Script Generated Five-day US Stock MACD Signals
Ticker
Company
Date
Signals
Close
Vol.(K)
Screening Result
AAPL
Apple Inc.
11/6/2021
Bullish
127.35
53415
MACD Cross-Up ZeroLine
ABBV
AbbVie Inc.
10/6/2021
Bullish
116.24
6264
MACD Cross-Up ZeroLine
ABT
Abbott Laboratories
11/6/2021
Bullish
109.91
6517
MACD Cross-Up Signal
COG
Cabot Oil & Gas Corporation
7/6/2021
Bullish
16.86
7396
MACD Cross-Up ZeroLine
COG
Cabot Oil & Gas Corporation
11/6/2021
Bullish
17.28
9382
MACD Cross-Up ZeroLine
COUP
Coupa Software Incorporated
8/6/2021
Bullish
217.4
6617
MACD Cross-Up Signal
FISV
Fiserv, Inc.
7/6/2021
Bullish
109.66
6853
MACD +ve Divergence
KMI
Kinder Morgan, Inc.
11/6/2021
Bullish
19.14
17406
MACD Cross-Up Signal
KO
Coca-Cola Company (The)
8/6/2021
Bullish
55.65
10968
MACD Cross-Up Signal
KO
Coca-Cola Company (The)
9/6/2021
Bullish
55.48
9839
MACD Cross-Up Signal
KO
Coca-Cola Company (The)
11/6/2021
Bullish
56.16
11816
MACD Cross-Up Signal
MX
MagnaChip Semiconductor Corporation
11/6/2021
Bullish
25.91
6683
MACD Cross-Up Signal
NCTY
The9 Limited
11/6/2021
Bullish
19.37
6592
MACD Cross-Up ZeroLine
PM
Philip Morris International Inc
8/6/2021
Bullish
96.4
5456
MACD Cross-Up Signal
PM
Philip Morris International Inc
11/6/2021
Bullish
98.84
5530
MACD Cross-Up Signal
PPL
PPL Corporation
11/6/2021
Bullish
29.33
6017
MACD Cross-Up Signal
TJX
TJX Companies, Inc. (The)
11/6/2021
Bullish
65.76
7653
MACD Cross-Up Signal
AGNC
AGNC Investment Corp.
11/6/2021
Bearish
17.71
25926
MACD Cross-Down ZeroLine
AI
Arlington Asset Investment Corp
8/6/2021
Bearish
63.29
8489
MACD Cross-Down ZeroLine
AMC
AMC Entertainment Holdings, Inc.
11/6/2021
Bearish
49.4
215932
MACD Cross-Down Signal
APA
Apache Corporation
8/6/2021
Bearish
23.14
8693
MACD Cross-Down Signal
APA
Apache Corporation
11/6/2021
Bearish
22.63
5807
MACD Cross-Down Signal
ETH-USD
Ethereum
11/6/2021
Bearish
2353.769
24832564
MACD Cross-Down Signal
GIS
General Mills, Inc.
9/6/2021
Bearish
62.12
6911
MACD Cross-Down ZeroLine
HAL
Halliburton Company
7/6/2021
Bearish
24.3
5644
MACD Cross-Down Signal
NUAN
Nuance Communications, Inc.
11/6/2021
Bearish
54.93
13546
MACD -ve Divergence
OXY
Occidental Petroleum Corporation
11/6/2021
Bearish
28.33
10849
MACD Cross-Down Signal
PDBC
Invesco Optimum Yield Diversified Commodity Strategy No K-1 ET
9/6/2021
Bearish
19.99
7369
MACD -ve Divergence
RAMP
LiveRamp Holdings, Inc.
11/6/2021
Bearish
41.75
6952
MACD Cross-Down ZeroLine
SLB
Schlumberger N.V.
7/6/2021
Bearish
35.83
10083
MACD Cross-Down Signal
SLB
Schlumberger N.V.
8/6/2021
Bearish
35.9
12822
MACD Cross-Down Signal
SLB
Schlumberger N.V.
11/6/2021
Bearish
34.89
7241
MACD Cross-Down Signal
SU
Suncor Energy Inc.
7/6/2021
Bearish
25.42
8767
MACD Cross-Down Signal
TCF
TCF Financial Corporation
8/6/2021
Bearish
45.18
53401
MACD Cross-Down ZeroLine
UNI3-USD
Uniswap USD
11/6/2021
Bearish
21.851
390924
MACD Cross-Down Signal
VRTX
Vertex Pharmaceuticals Incorporated
11/6/2021
Bearish
193.02
13721
MACD Cross-Down Signal
WMB
Williams Companies, Inc. (The)
11/6/2021
Bearish
27.79
7263
MACD Cross-Down Signal
202106 7 to 11 US Stock Five-day MACD Signals
Moses Stock Scan
Free Power US Stock MACD Scan Signals AmiBroker Academy.com
Disclaimer: The above result is for illustration purpose. It is not meant to be used for buy or sell decision. We do not recommend any particular stocks on our website. If particular stocks of such are mentioned, they are meant as illustration or demonstration of Amibroker as a powerful charting software or MACD scanner. Amibroker can program to scan the stocks that have MACD buy or sell signals.
These are script generated signals. Not all scan results are shown here. The MACD signal should use with price action and confirmation. Users must understand what MACD and price action are all about before using them. If necessary you should attend a course to learn more about Technical Analysis (TA) and Moving Average Convergence Divergence, MACD.
Once again, the website does not guarantee any results or investment return based on the information and instruction you have read here. It should be used as learning aids only and if you decide to trade real money, all trading decision should be your own, and you should take your own responsibility.