6 July 2021
Welcome!
Welcome to AmiBroker Academy dot com, amibrokeracademy.com.
We will use 1) Ichimoku Cloud, 2) Support Resistance (using box), 3) River (moving average), 4) GMMA and Woodies CCI, 5) Bollinger Bands and Moving Averages, and 6) MACD to analyze chart. See our simple reading of price action. We also reading Cryptocurrencies price action chart.
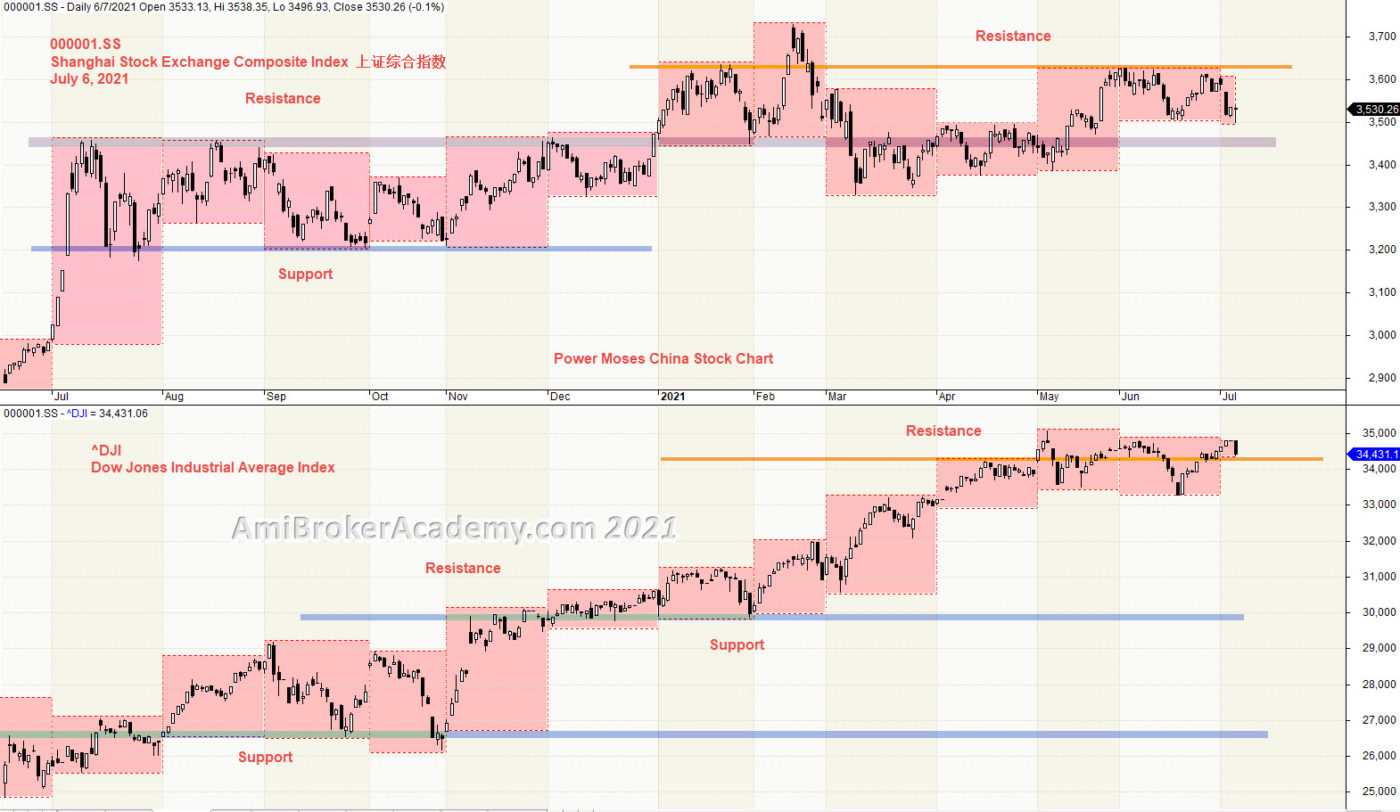
We also use correlation to benchmark Dow Jones Index with stock chart like Shanghai Stock Exchange Composite Index 上证综合指数. See chart for more.
We translate price action chart into layman language. This will help you in understand the financial instrument you are trading. We believe picture worth a thousand words. So, sometimes we use less words. You can learn the price action interpretation too. Give it a tray. You may not have the same view points as us. Remember all analysis read price action chart differently. It is just like reading an essay, we will have different conclusion.
Trade well.
Trade what you see. Manage your risk.
1) Shanghai Stock Exchange Composite Index 上证综合指数 and Dow Jones Index and Correlation
Shanghai Stock Exchange Composite Index is moving along the resistance region. This happen way back in the start of 2021. China Stock Index has hit the ceiling. But this is not true for US Stock Market, when you reference Dow Jones Index, see chart. Dow Index only test the resistance in last three months.
We just read what the chart said. Have fun!
We all read the same chart, but we may read some other do not pick up.
Moses Power Charting
Official AmiBrokerAcademy.com Charting
Disclaimer
The above result is for illustration purpose. It is not meant to be used for buy or sell decision. We do not recommend any particular stocks. If particular stocks of such are mentioned, they are meant as demonstration of Amibroker as a powerful charting software and MACD. Amibroker can program to scan the stocks for buy and sell signals.
These are script generated signals. Not all scan results are shown here. The MACD signal should use with price action. Users must understand what MACD and price action are all about before using them. If necessary you should attend a course to learn more on Technical Analysis (TA) and Moving Average Convergence Divergence, MACD.
Once again, the website does not guarantee any results or investment return based on the information and instruction you have read here. It should be used as learning aids only and if you decide to trade real money, all trading decision should be your own.
We learn from many past and present great traders. Kudo to these master.