Welcome to AmiBroker Academy dot com, amibrokeracademy.com.
We sometime bench mark two stock price action or stock price with index. The following example, we benchmark Volatility Index and US NASDAQ Composite stock index. Besides correlation we use other tools such as 1) Ichimoku Cloud, 2) Support Resistance (using box), 3) River (moving average), 4) GMMA and Woodies CCI, 5) Bollinger Bands and Moving Averages, and 6) MACD to analyze chart. See our simple reading of price action.
We also apply wave theory onto chart. Such as well know Elliott Waves. Just in case you are not familiar with Elliott Waves. Elliott was from Ralph Nelson Elliott.
Otherwise, we like to use pattern, such as ABCD pattern. Checkout our posting here for more.
We translate price action chart into layman language. This will help you in understand the financial instrument you are trading. We believe picture worth a thousand words. So, sometimes we use less words. You can learn the price action interpretation too. Give it a tray. You may not have the same view points as us. Remember all analysis read price action chart differently. It is just like reading an essay, we will have different conclusion.
Trade what you see. Manage your risk. Trade well.
1) Volatility Index and NASDAQ Composite Index Correlation
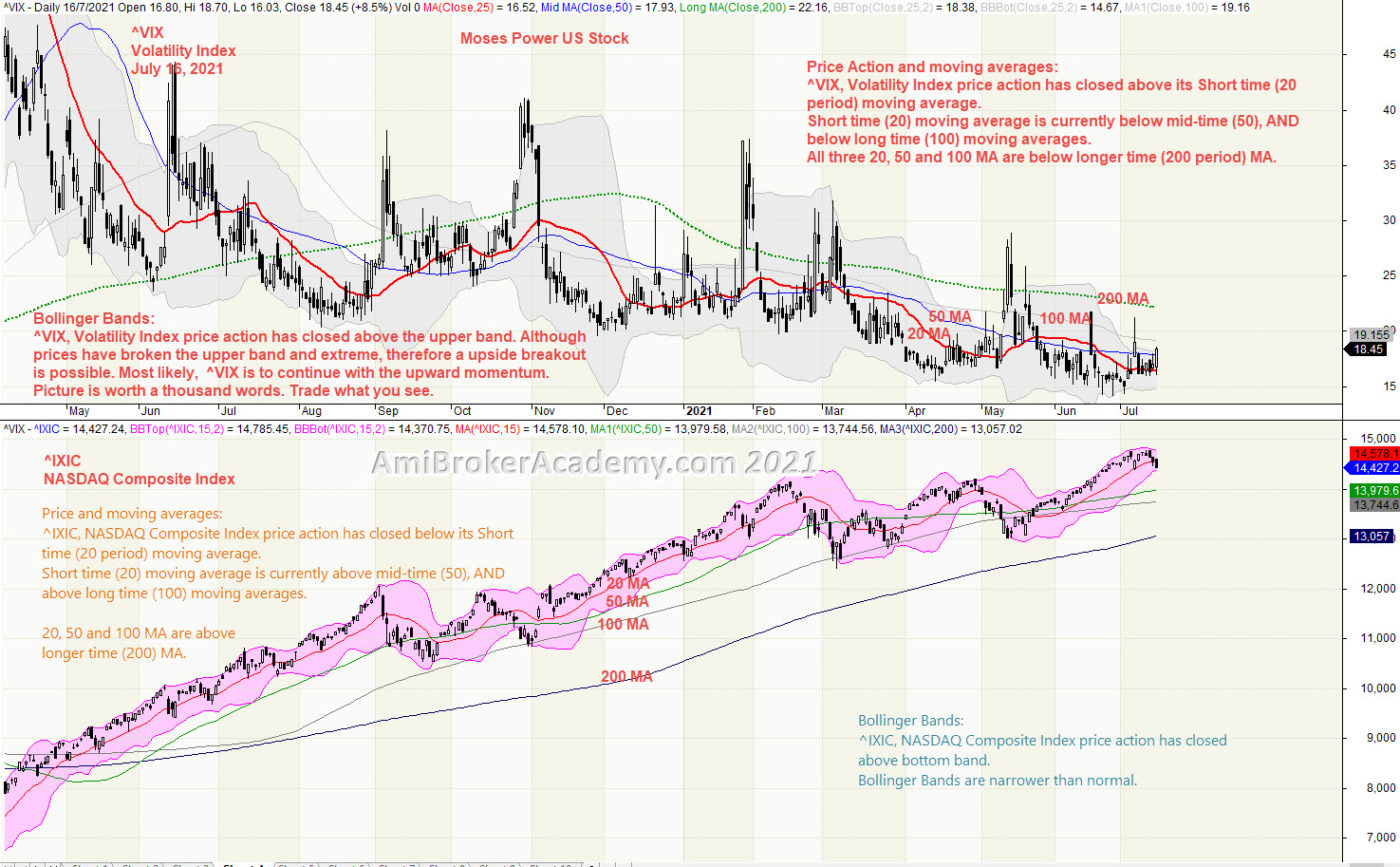
We study price action we see Volatility Index price action begin to go from high to low. Price Action try to breakout higher but fail. We see NASDAQ Composite Index price action just continues to go from low to high. Benchmark both Volatility Index and NASDAQ Index, you can see one has the bear trend and the other bull.
Volatility Index is used to indicate the market fear. Looks the the fear factor is low. Although occasionally, the fear pop up. Manage your risk. And Trade what you see.
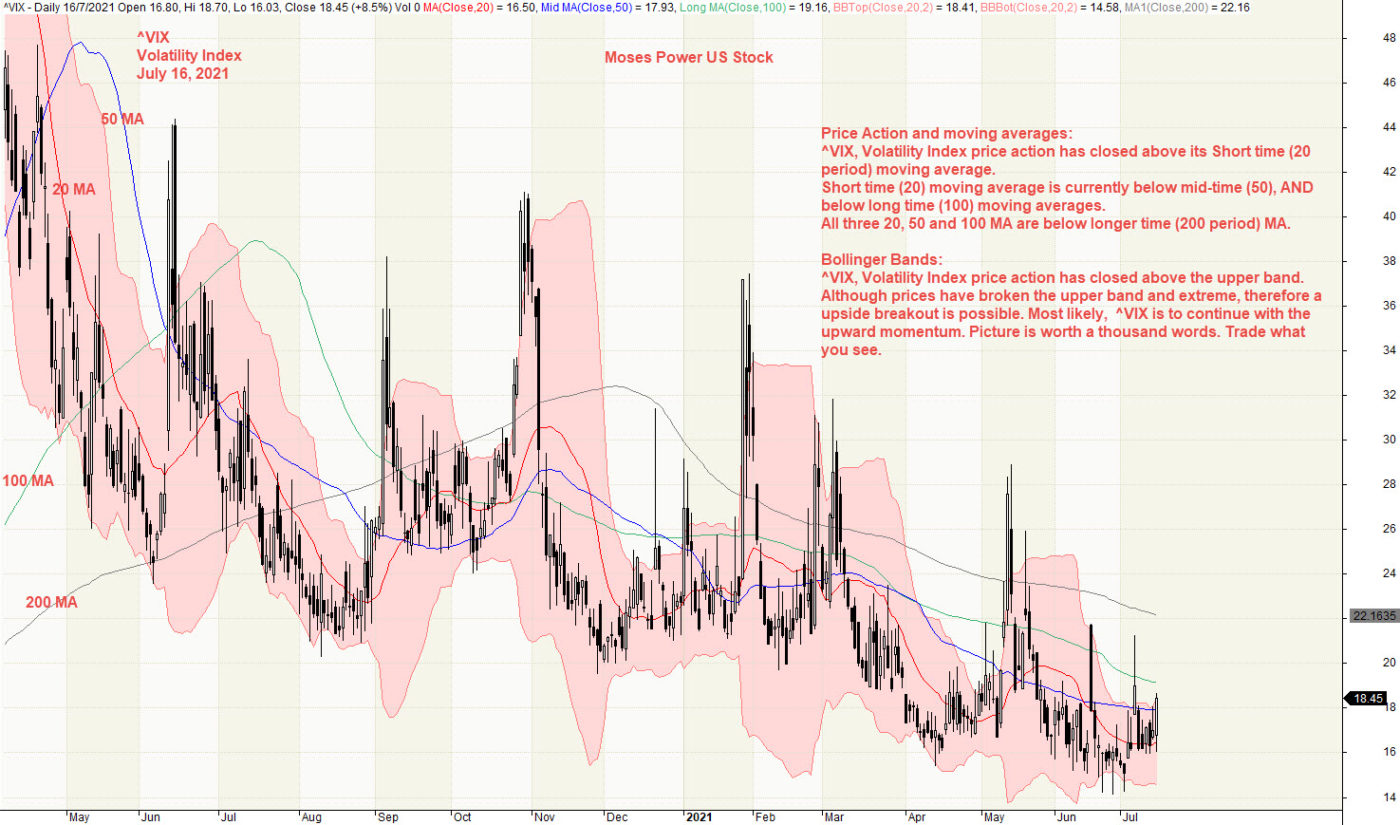
Price Action and moving averages: ^VIX, Volatility Index price action has closed above its Short time (20 period) moving average. Short time (20) moving average is currently below mid-time (50), AND below long time (100) moving averages. All three 20, 50 and 100 MA are below longer time (200 period) MA.
Bollinger Bands: ^VIX, Volatility Index price action has closed above the upper band. Although prices have broken the upper band and extreme, therefore a upside breakout is possible. Most likely, ^VIX is to continue with the upward momentum. Picture is worth a thousand words. Trade what you see.
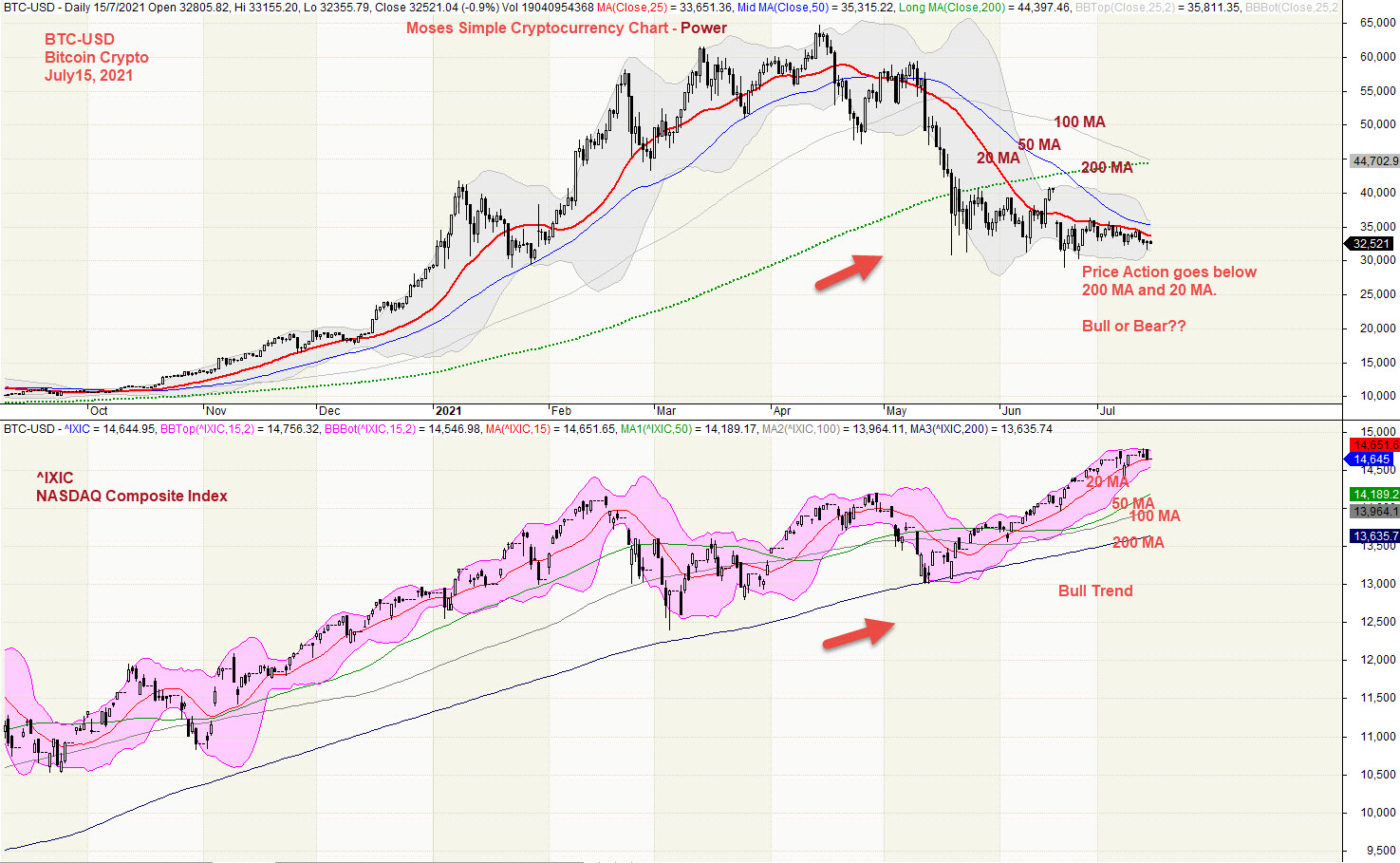
Price and moving averages: ^IXIC, NASDAQ Composite Index price action has closed below its Short time (20 period) moving average. Short time (20) moving average is currently above mid-time (50), AND above long time (100) moving averages.
20, 50 and 100 MA are above longer time (200) MA.
Bollinger Bands: ^IXIC, NASDAQ Composite Index price action has closed above bottom band. Bollinger Bands are narrower than normal.
Remember, we just read what the chart said. Have fun!
20210716 Volatility Index and NASDAQ Composite Index Correlation
Moses Power Charting
Official AmiBrokerAcademy.com Charting
Disclaimer
The above result is for illustration purpose. It is not meant to be used for buy or sell decision. We do not recommend any particular stocks. If particular stocks of such are mentioned, they are meant as demonstration of Amibroker as a powerful charting software and MACD. Amibroker can program to scan the stocks for buy and sell signals.
These are script generated signals. Not all scan results are shown here. The MACD signal should use with price action. Users must understand what MACD and price action are all about before using them. If necessary you should attend a course to learn more on Technical Analysis (TA) and Moving Average Convergence Divergence, MACD.
Once again, the website does not guarantee any results or investment return based on the information and instruction you have read here. It should be used as learning aids only and if you decide to trade real money, all trading decision should be your own.
We learn from many past and present great traders. Kudo to these master.
Welcome to AmiBroker Academy dot com, amibrokeracademy.com.
We sometime bench mark two stock price action or stock price with index. The following example, we benchmark BlackRock Credit Allocation Income Trust and US NASDAQ Composite stock index. Besides correlation we use other tools such as 1) Ichimoku Cloud, 2) Support Resistance (using box), 3) River (moving average), 4) GMMA and Woodies CCI, 5) Bollinger Bands and Moving Averages, and 6) MACD to analyze chart. See our simple reading of price action.
We occasionally, we apply wave theory onto chart. Such as well know Elliott Waves. Just in case you are not familiar with Elliott Waves. Elliott was from Ralph Nelson Elliott.
Ralph Nelson Elliott a professional accountant, after analyzing close to 75 years worth of stock data, Elliott discovered that stock markets, thought to behave in a somewhat chaotic manner, actually didn’t.
Otherwise, we like to use pattern, such as ABCD pattern. Checkout our posting here for more.
We translate price action chart into layman language. This will help you in understand the financial instrument you are trading. We believe picture worth a thousand words. So, sometimes we use less words. You can learn the price action interpretation too. Give it a tray. You may not have the same view points as us. Remember all analysis read price action chart differently. It is just like reading an essay, we will have different conclusion.
Trade what you see. Manage your risk. Trade well.
1) BlackRock Credit Allocation Income Trust and NASDAQ Composite Index Correlation
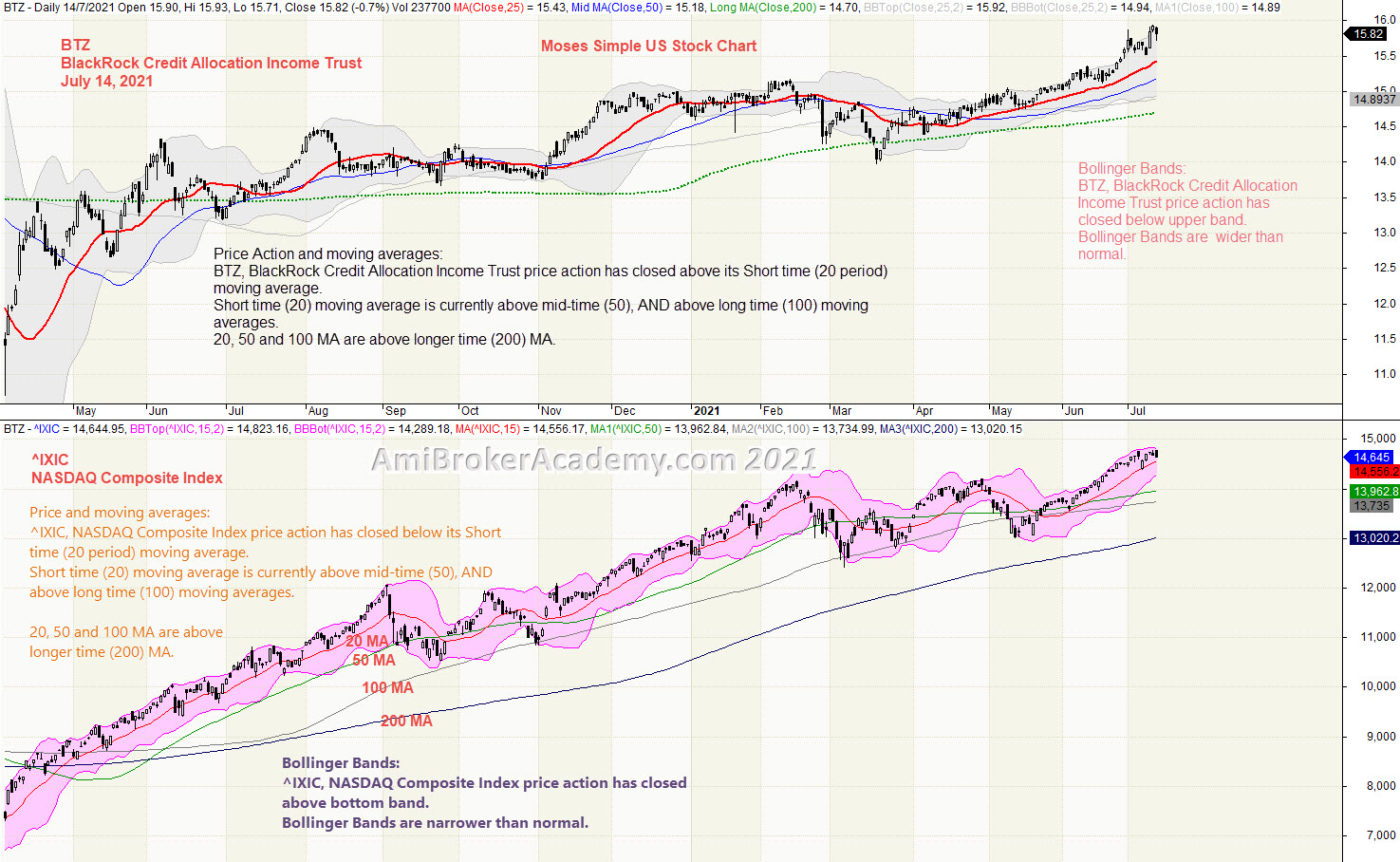
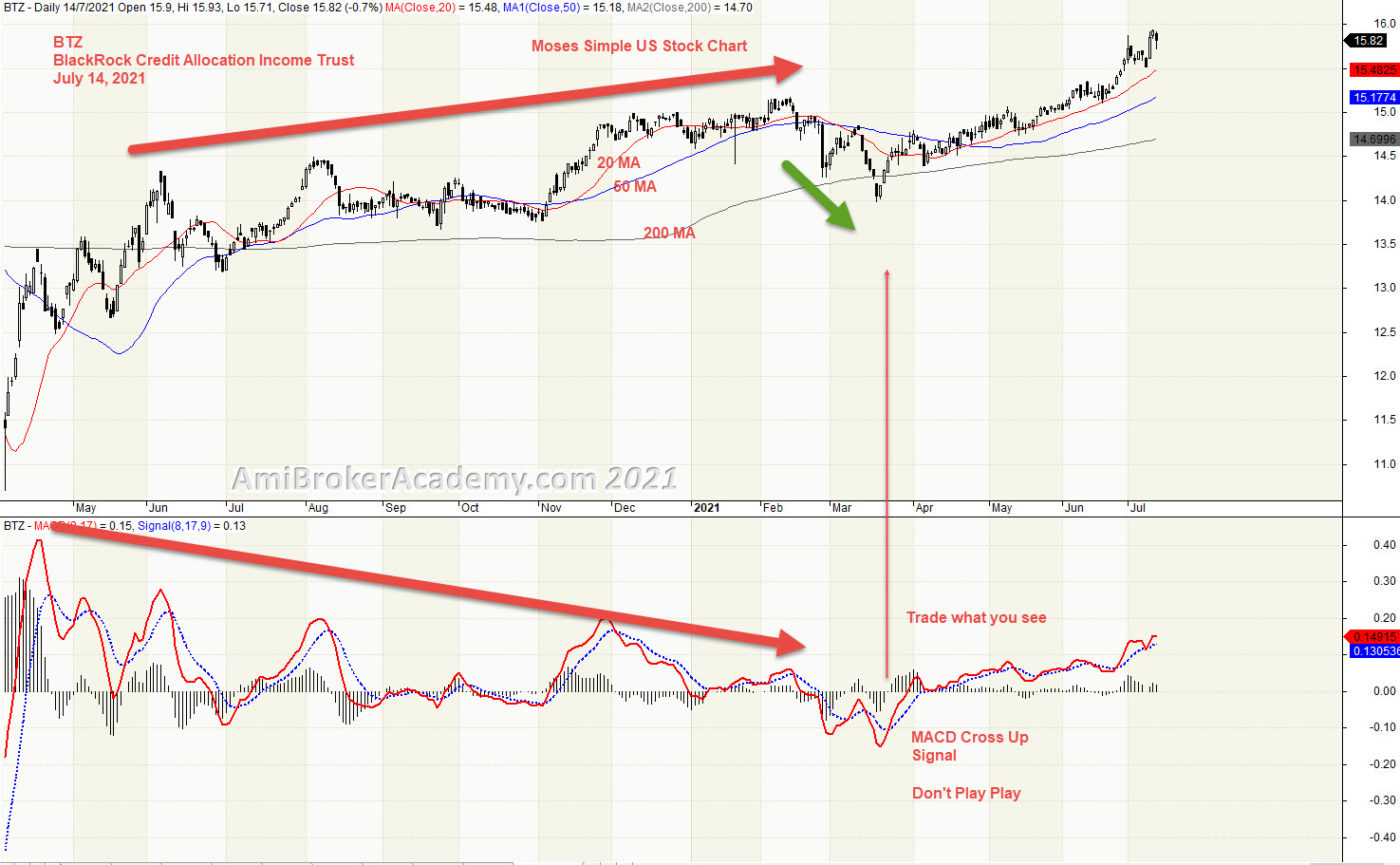
We study price action we see BlackRock Credit Allocation Income Trust price action begin to go from low to high. Price Action continues to go higher and have not pullback. We see NASDAQ Composite Index price action also goes from low to high. Benchmark both BlackRock Credit Allocation Income Trust and NASDAQ Index, you can see both have the bull trend.
Trade what you see.
Price Action and moving averages: BTZ, BlackRock Credit Allocation Income Trust price action has closed above its Short time (20 period) moving average. Short time (20) moving average is currently above mid-time (50), AND above long time (100) moving averages. 20, 50 and 100 MA are above longer time (200) MA.
Bollinger Bands: BTZ, BlackRock Credit Allocation Income Trust price action has closed below upper band. Bollinger Bands are wider than normal.
Price and moving averages: ^IXIC, NASDAQ Composite Index price action has closed below its Short time (20 period) moving average. Short time (20) moving average is currently above mid-time (50), AND above long time (100) moving averages.
20, 50 and 100 MA are above longer time (200) MA.
Bollinger Bands: ^IXIC, NASDAQ Composite Index price action has closed above bottom band. Bollinger Bands are narrower than normal.
Remember, we just read what the chart said. Have fun!
20210714 BlackRock Credit Allocation Income Trust and NASDAQ Composite Index Correlation
Moses Power Charting
Official AmiBrokerAcademy.com Charting
Disclaimer
The above result is for illustration purpose. It is not meant to be used for buy or sell decision. We do not recommend any particular stocks. If particular stocks of such are mentioned, they are meant as demonstration of Amibroker as a powerful charting software and MACD. Amibroker can program to scan the stocks for buy and sell signals.
These are script generated signals. Not all scan results are shown here. The MACD signal should use with price action. Users must understand what MACD and price action are all about before using them. If necessary you should attend a course to learn more on Technical Analysis (TA) and Moving Average Convergence Divergence, MACD.
Once again, the website does not guarantee any results or investment return based on the information and instruction you have read here. It should be used as learning aids only and if you decide to trade real money, all trading decision should be your own.
We learn from many past and present great traders. Kudo to these master.
Welcome to AmiBroker Academy dot com, amibrokeracademy.com.
Trading is all about observation, reading the price bar and not news. By the time you hear the news it is already old and become history. Why? It is very simple, remember where the news come from? It has first someone release to the news agency like CNBC, and so on. Next, someone has to read the news to you after some research and summarize. This will be few hours later, by then the price action has already done.
As for price bar, it is what the market supply and remand. When market feel that is over price, the price will drop. All this reflected on the price bar almost instantly.
Next is how to read our price bar plus using some tools, such as MACD.
Here, we simply translate price action chart into layman language. This will help you in understand the financial instrument you are trading. We believe picture worth a thousand words. So, sometimes we use less words. You can learn the price action interpretation too. Give it a tray. You may not have the same view points as us. Remember all analysis read price action chart differently. It is just like reading an essay, we will have different conclusion.
Trade well.
Trade what you see. Manage your risk.
1) AOSL | Alpha and Omega Semiconductor and Ichimoku Cloud
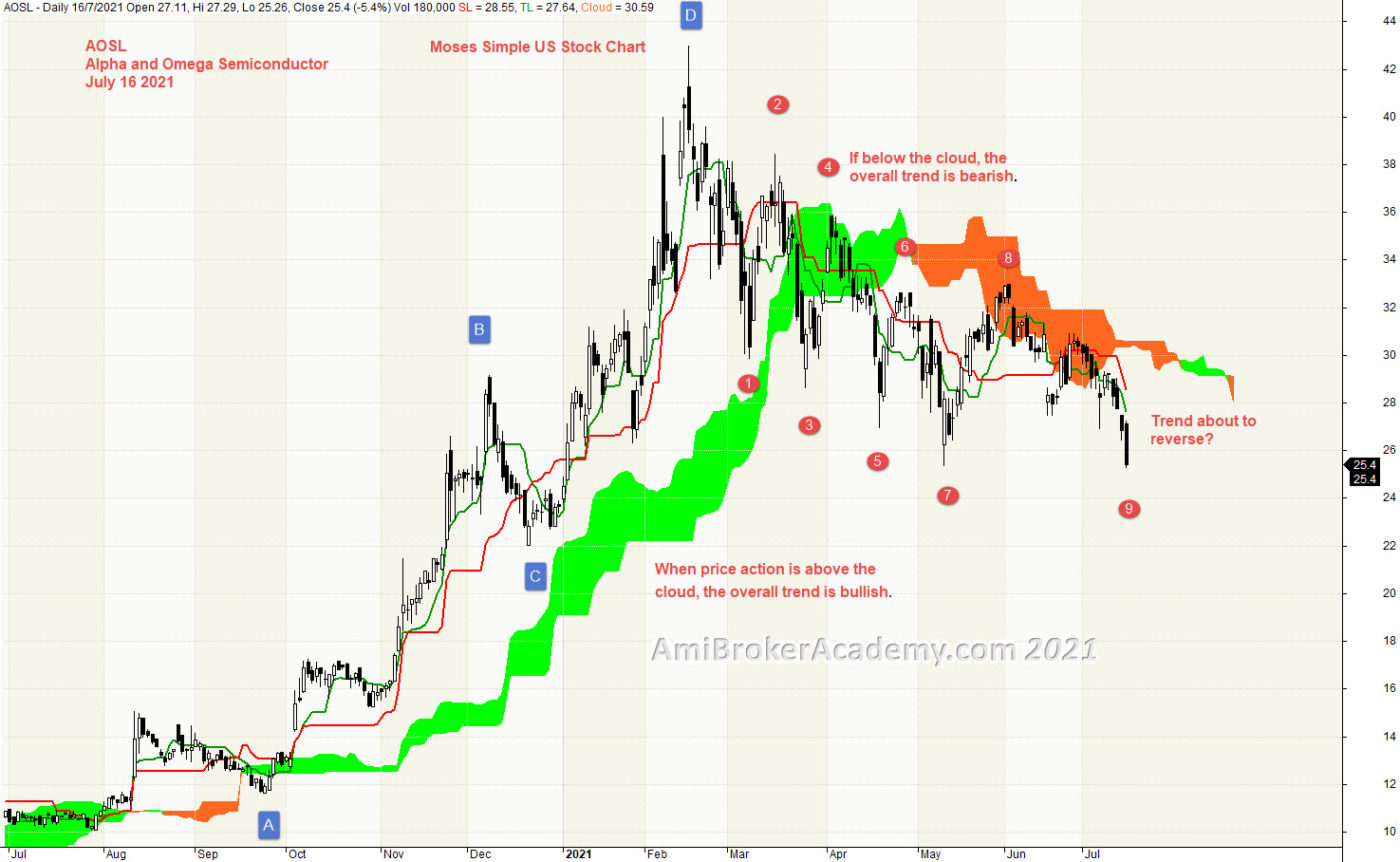
Ichimoku Cloud is a trend following strategy tool, can use in any market and any timeframe. Ichimoku indicator emphasize to trade in the trend direction. We see price action emerge from the cloud. Price Action goes on top of cloud and stay above. Price Action goes from bottom left to top right, ie Bull trend. We see also Tenkan Sen (green) goes above Kijun Sen (red). But after February, Tenkan cross below Kijun and stay below, bear trend.
Ichimoku is a great visual tool too, to help to avoid trading in the wrong direction.
Ichimoku Cloud is a multi-dimensional indicator designed to offer support and resistance levels, trending, and entry and exit points. Besides that, Ichimoku is an indicator that gauges future price momentum and determine futures areas of support and resistance. Price Action is currently below cloud.
Trade what you see. Find a potential support to buy.
Trade what you see.
Remember, we just read what the chart said. Have fun!
But. don’t play play with Ichimoku indicator. Very simple yet powerful. We are here provide you simple yet powerful stock chart. Check out Moses power stock chart. Have fun!
20210716 Alpha and Omega Semiconductor and Ichimoku Cloud
2) Alpha and Omega Semiconductor and Support Resistance
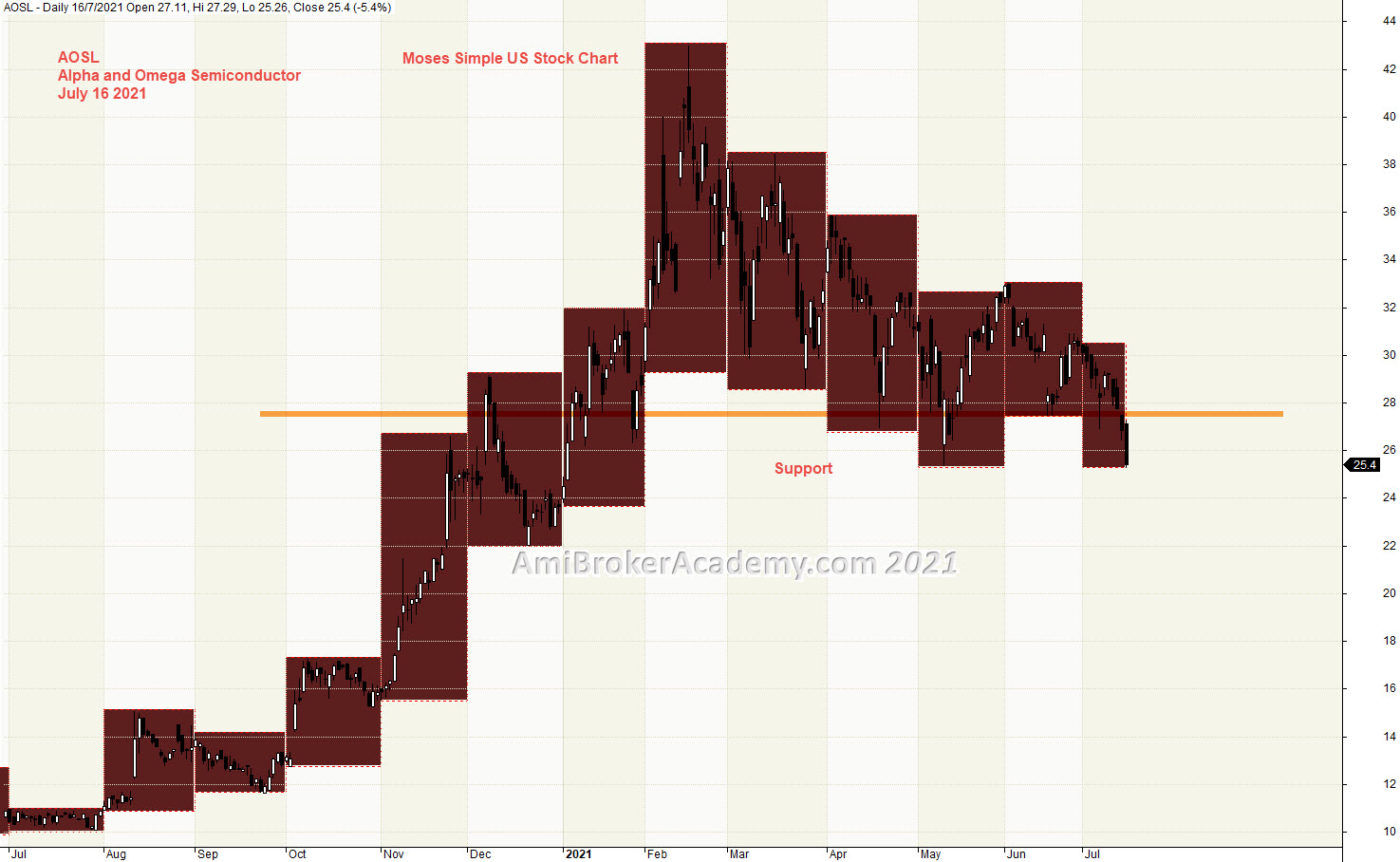
Study Alpha and Omega Semiconductor price action, price action goes from low to high and pullback, from bottom left to top. If we use the month high low to help in finding the support resistance. We will fine a key level, price action has supported by the key level.
Trade what you see. Mange your risk.
20210716 Alpha and Omega Semiconductor and Support Resistance
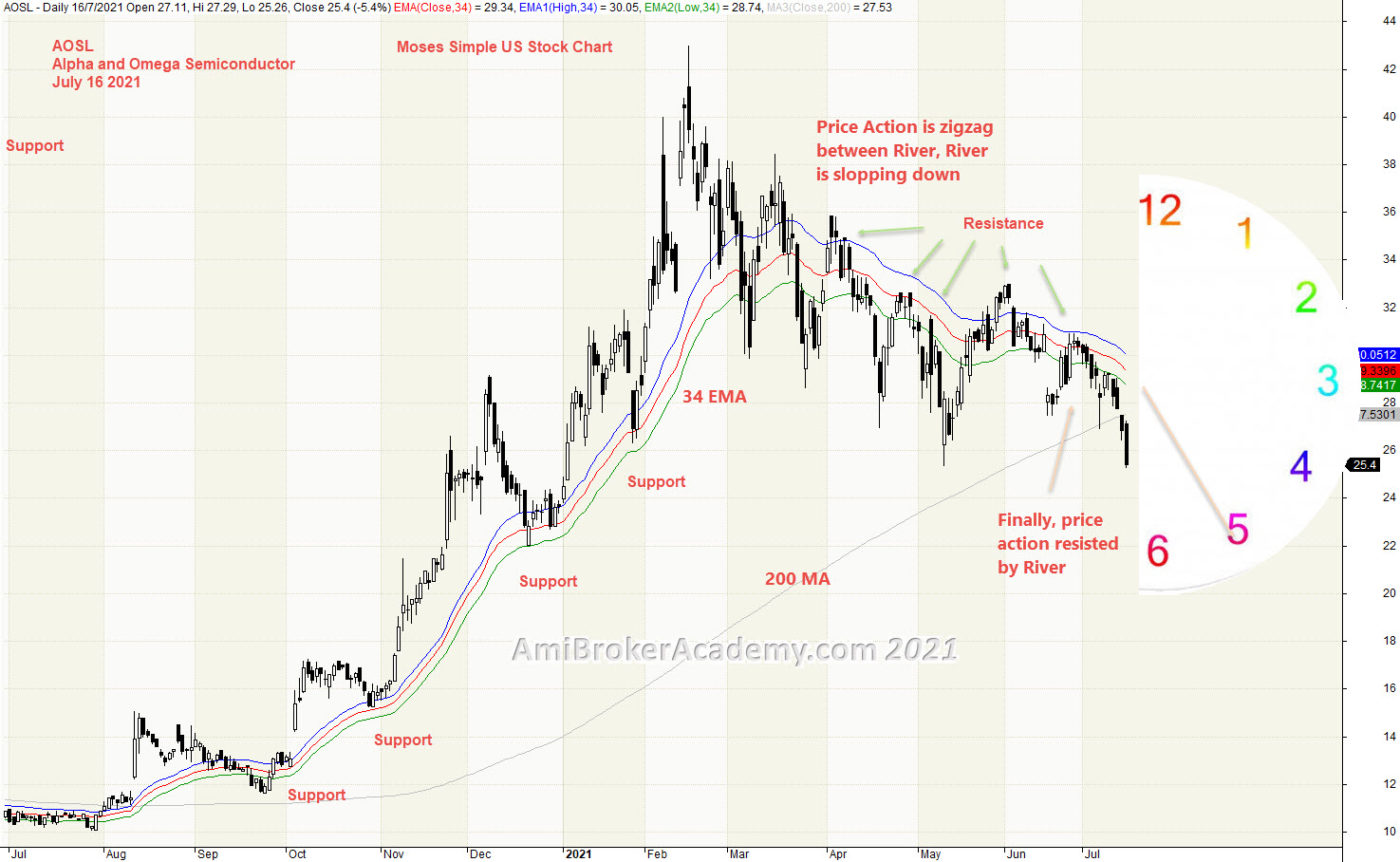
3) Alpha and Omega Semiconductor and River
Price Action is pointing to five o’clock direction, price action is bear bias. See chart, we see the trend is slopping down for its high in February.
Moving Average is a great visual tool. Raghee uses high, low and close of 34 EMA to form a band to determine the wave direction. Price action goes from above 34 EMA and continue to stay above River. But Price Action fail to go higher, price action begin to breakout below the River and stay below. River is now act as resistance.
River is a great support resistance tool too.
Manage your risk.
20210716 Alpha and Omega Semiconductor and River
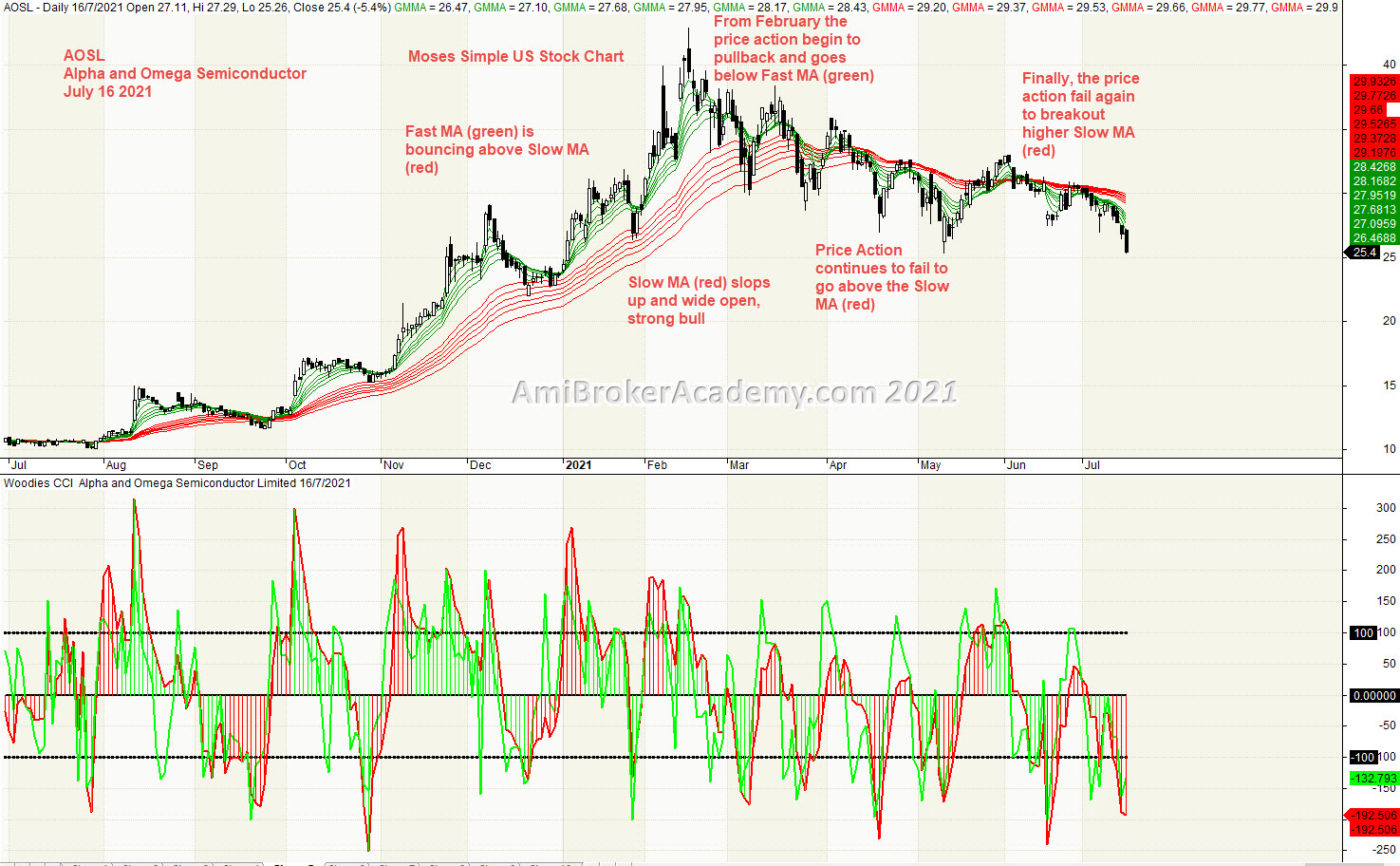
4) Alpha and Omega Semiconductor and GMMA and Woodies CCI
Price Action and Fast MA (green) is above Slow MA (red) until February. Price action begin to cross below Slow MA (red) and stay below.
Trade with eyes open.
20210716 Alpha and Omega Semiconductor and GMMA and Woodies CCI
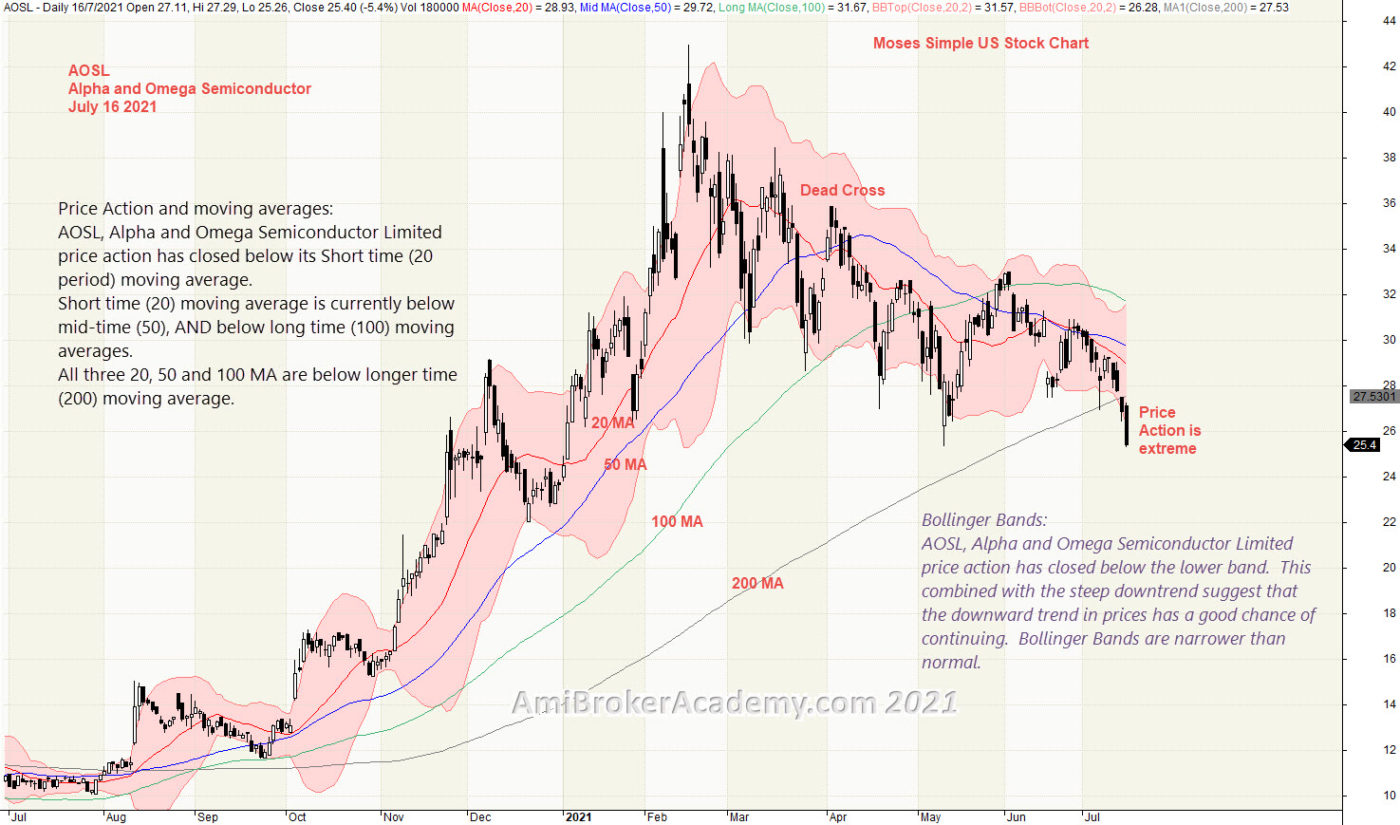
5) Alpha and Omega Semiconductor and Bollinger Bands and Moving Averages
Price Action and Moving Averages: AOSL, Alpha and Omega Semiconductor price action has closed below its Short time (20 period) moving average. Short time (20) moving average is currently below mid-time (50), and below long time (100) moving average.
Mange your risk.
20210716 Alpha and Omega Semiconductor and Bollinger Bands and Moving Averages
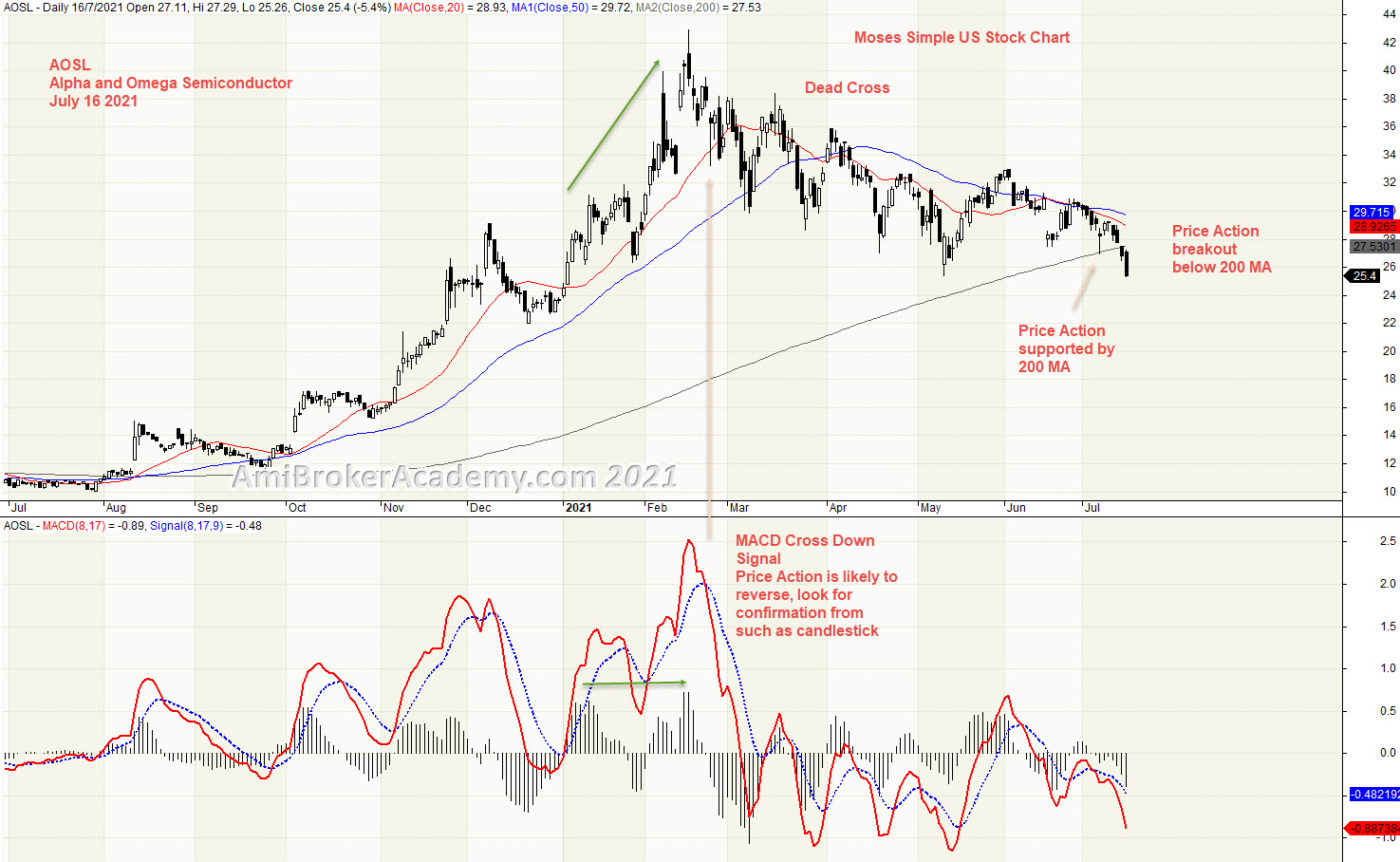
6) Alpha and Omega Semiconductor and MACD
We study price action we see MACD Divergence, price action continues to go higher, but MACD begin to form lower high. So we expect a reversal is going to happen. But everyone by now has learnt that MACD Divergence is like a traffic light, you don’t have to stop at every traffic light. So, be the MACD Divergence.
Trade what you see. We are looking for bear signal, and confirmation. MACD cross signal is a good indication to lookout for.
So, read the information you can get from the chart. You probably notice a MACD cross up signal, this is a signal on price action reversal. Reay to buy.
Remember, we just read what the chart said. Have fun!
But. don’t play play with MACD indicator. Very simple yet powerful.
We could find some similarity on the bull and bear trend, see chart.
20210716 Alpha and Omega Semiconductor and TSMC Correlation
Moses Power Charting
Official AmiBrokerAcademy.com Charting
Disclaimer
The above result is for illustration purpose. It is not meant to be used for buy or sell decision. We do not recommend any particular stocks. If particular stocks of such are mentioned, they are meant as demonstration of Amibroker as a powerful charting software and MACD. Amibroker can program to scan the stocks for buy and sell signals.
These are script generated signals. Not all scan results are shown here. The MACD signal should use with price action. Users must understand what MACD and price action are all about before using them. If necessary you should attend a course to learn more on Technical Analysis (TA) and Moving Average Convergence Divergence, MACD.
Once again, the website does not guarantee any results or investment return based on the information and instruction you have read here. It should be used as learning aids only and if you decide to trade real money, all trading decision should be your own.
We learn from many past and present great traders. Kudo to these master.
Welcome to AmiBroker Academy dot com, amibrokeracademy.com.
Trading is all about observation, reading the price bar and not news. By the time you hear the news it is already old and become history. Why? It is very simple, remember where the news come from? It has first someone release to the news agency like CNBC, and so on. Next, someone has to read the news to you after some research and summarize. This will be few hours later, by then the price action has already done.
As for price bar, it is what the market supply and remand. When market feel that is over price, the price will drop. All this reflected on the price bar almost instantly.
Next is how to read our price bar plus using some tools, such as MACD.
Here, we simply translate price action chart into layman language. This will help you in understand the financial instrument you are trading. We believe picture worth a thousand words. So, sometimes we use less words. You can learn the price action interpretation too. Give it a tray. You may not have the same view points as us. Remember all analysis read price action chart differently. It is just like reading an essay, we will have different conclusion.
Trade well.
Trade what you see. Manage your risk.
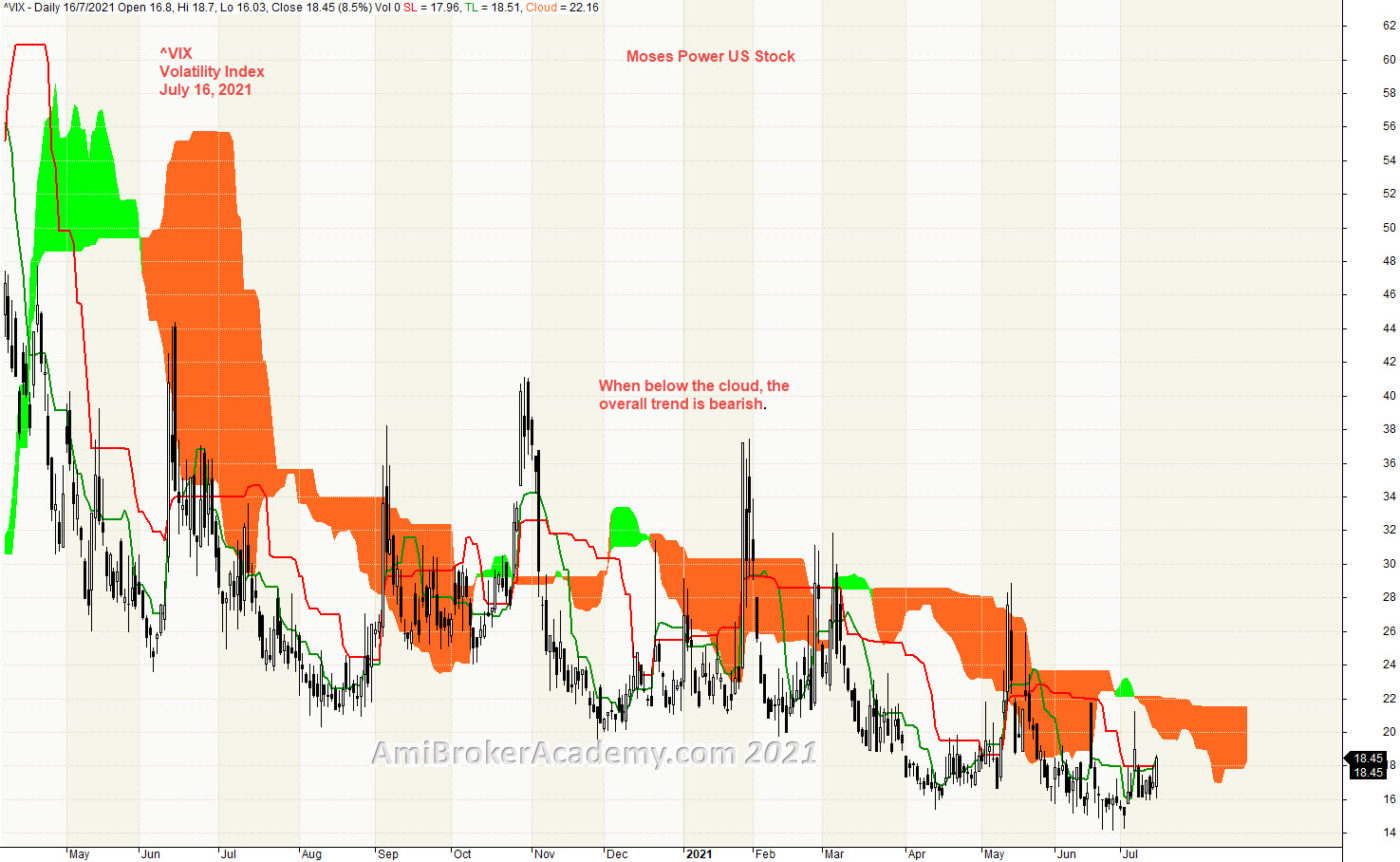
1) ^VIX | Volatility Index and Ichimoku Cloud
Ichimoku Cloud is a trend following strategy tool, can use in any market and any timeframe. Ichimoku indicator emphasize to trade in the trend direction. We see price action resisted by the cloud. Price Action goes from the top, top left to bottom right, ie Bear trend. We see Tenkan Sen (green) below Kijun Sen (red). Tenkan cross below Kijun and stay below, bear trend. Although Tenkan has spike above Kijun a few times. Price Action stay below both Tenkan and Kijun. Price Action stay below cloud. Cloud act as resistance to keep the price action low and lower.
Ichimoku is a great visual tool, to help to avoid trading in the wrong direction.
Ichimoku Cloud is a multi-dimensional indicator designed to offer support and resistance levels, trending, and entry and exit points. Besides that, Ichimoku is an indicator that gauges future price momentum and determine futures areas of support and resistance. Price Action is currently below cloud.
Trade what you see. See a potential support.
Trade what you see.
Remember, we just read what the chart said. Have fun!
But. don’t play play with Ichimoku indicator. Very simple yet powerful. We are here provide you simple stock chart, but powerful stock charting. Have fun!
20210716 Volatility Index and Ichimoku Cloud
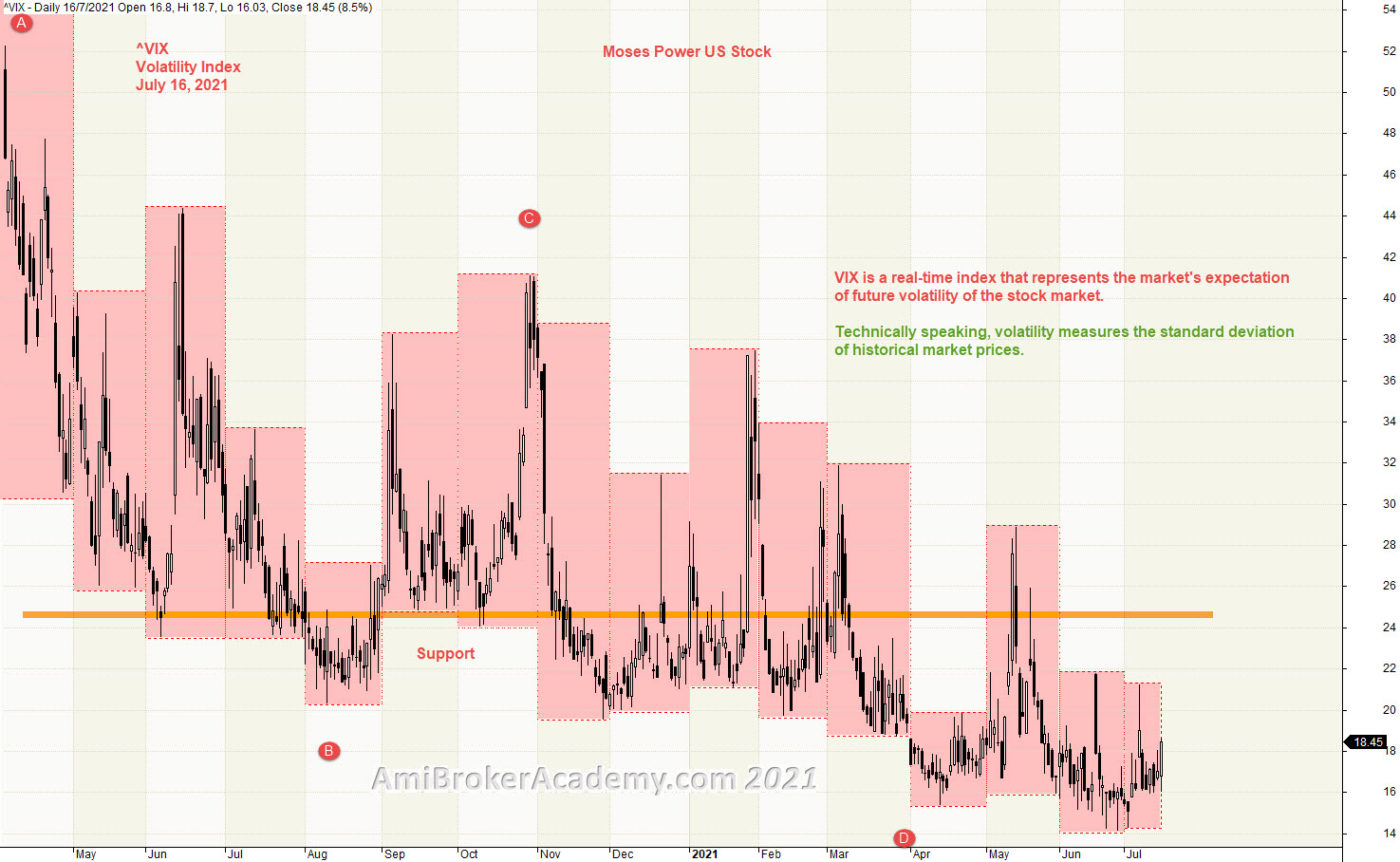
2) Volatility Index and Support Resistance
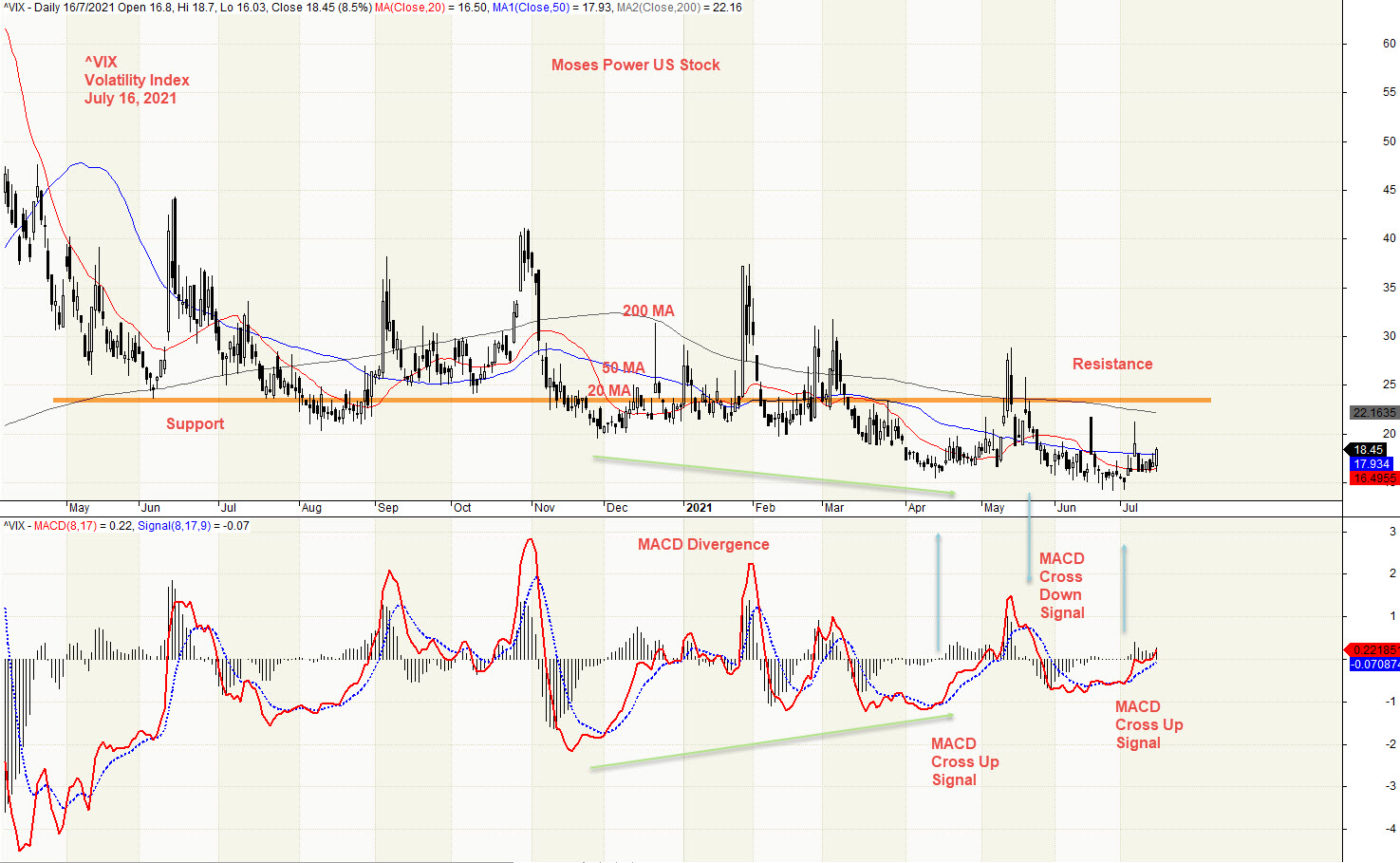
Study Volatility Index price action, price action goes from high to low, from top left to bottom right. If we use the month high low to help in the support resistance. We will fine a key level, price action has gone below the key level and stay lower.
If you a H M Gartley fans, you probably spot a big ABCD pattern. From the ABCD pattern, the CD leg has completed. Checkout the ABCD pattern characteristic. Trade what you see.
20210716 Volatility Index and Support Resistance
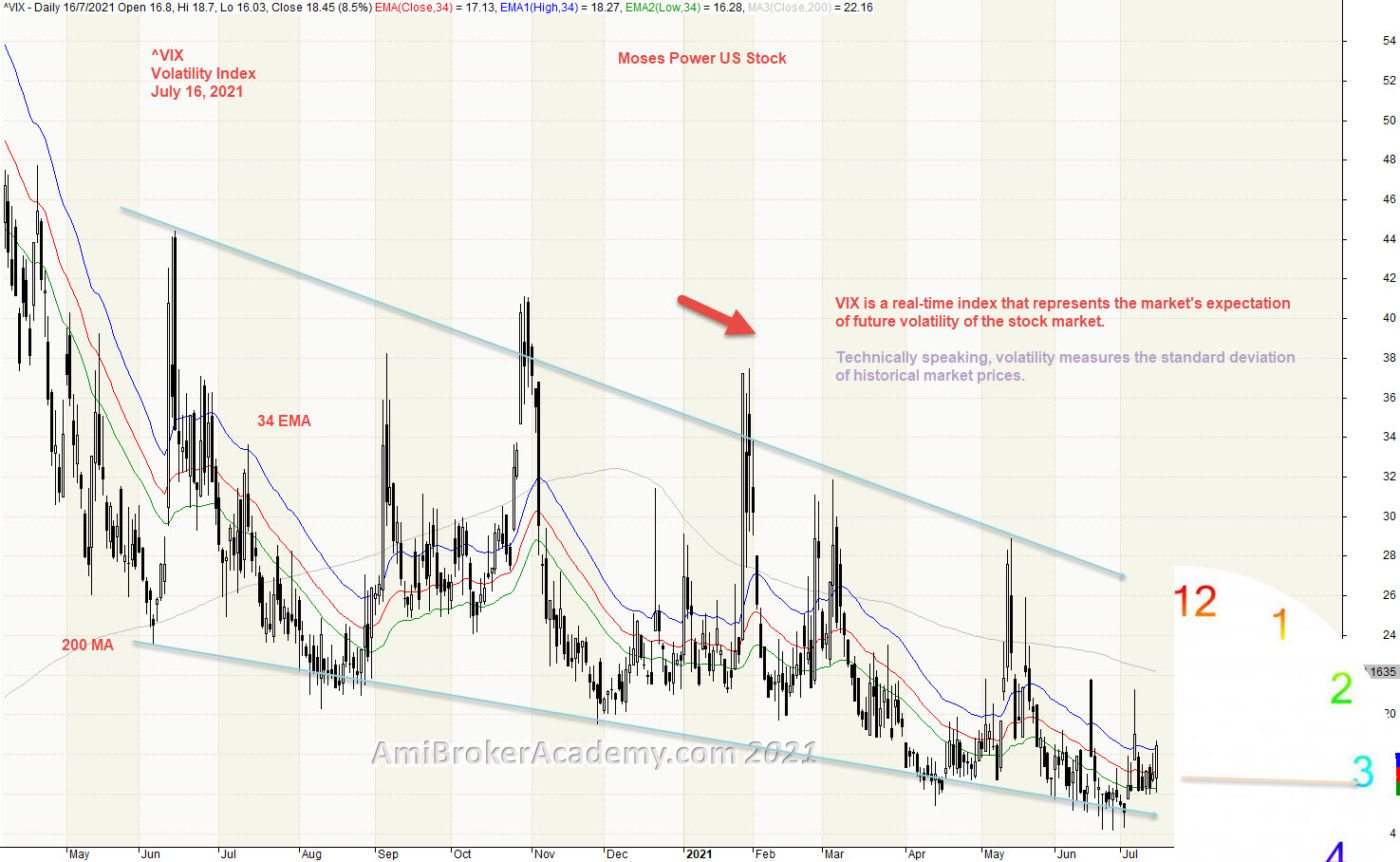
3) Volatility Index and River
Price Action is pointing to three o’clock direction. See chart, we see the trend is slopping down for its high, and also down for its low.
Moving Average is a great visual tool. Raghee uses high, low and close of 34 EMA to form a band to determine the wave direction. Price action goes from below 34 EMA and continue to stay below River. Price Action fail to go higher, although the price action has breakout above the River a few times.
Manage your risk.
20210716 Volatility Index and River
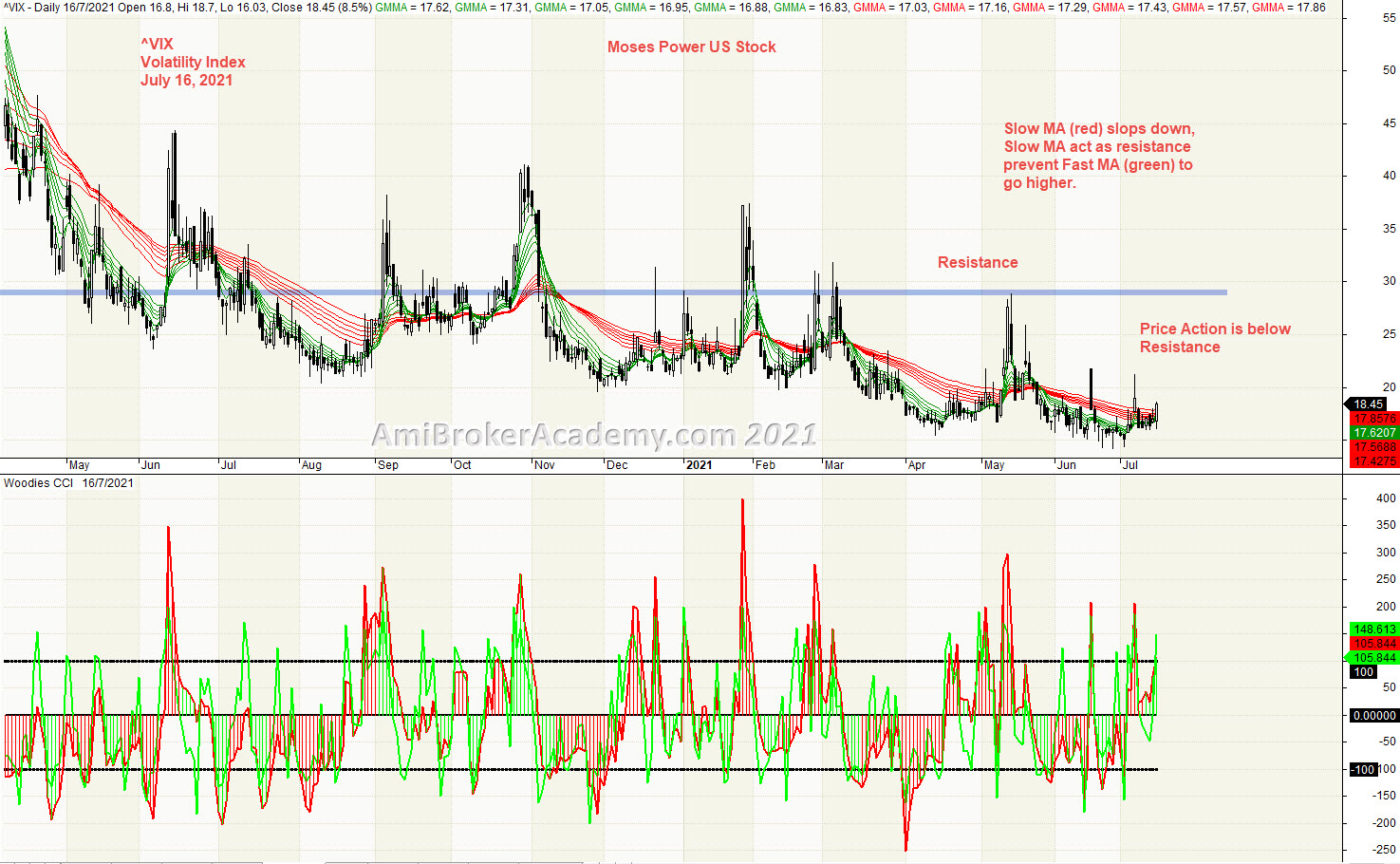
4) Volatility Index and GMMA and Woodies CCI
Price Action and Fast MA (green) goes from above Slow MA (red) to below. Price action continues to stay below Fast MA (green) and Slow MA (red).
Trade with eyes open.
20210716 Volatility Index and GMMA and Woodies CCI
5) Volatility Index and Bollinger Bands and Moving Averages
Price Action and moving averages: ^VIX, Volatility Index price action has closed above its Short time (20 period) moving average. Short time (20) moving average is currently below mid-time (50), AND below long time (100) moving averages. All three 20, 50 and 100 MA are below longer time (200 period) MA.
Bollinger Bands: ^VIX, Volatility Index price action has closed above the upper band. Although prices have broken the upper band and extreme, therefore a upside breakout is possible. Most likely, ^VIX is to continue with the upward momentum. Picture is worth a thousand words. Trade what you see.
Mange your risk.
20210716 Volatility Index and Bollinger Bands and Moving Averages
6) Volatility Index and MACD
We study price action we see MACD Divergence, price action continues to go lower, but MACD begin to form higher low. But, when the reversal is going to happen. As everyone by now will know that MACD Divergence is like a traffic light, you don’t have to stop at every traffic light. So, a MACD Divergence is asking you to find confirmation of price action change. So, look out for bullish candlestick pattern and so on.
Trade what you see.
So, read the information you can get from the chart. You probably notice a MACD cross up signal, this is a signal on price action reversal. Reay to buy.
Remember, we just read what the chart said. Have fun!
But. don’t play play with MACD indicator. Very simple yet powerful.
20210716 Volatility Index and MACD
Moses Power Charting
Official AmiBrokerAcademy.com Charting
Disclaimer
The above result is for illustration purpose. It is not meant to be used for buy or sell decision. We do not recommend any particular stocks. If particular stocks of such are mentioned, they are meant as demonstration of Amibroker as a powerful charting software and MACD. Amibroker can program to scan the stocks for buy and sell signals.
These are script generated signals. Not all scan results are shown here. The MACD signal should use with price action. Users must understand what MACD and price action are all about before using them. If necessary you should attend a course to learn more on Technical Analysis (TA) and Moving Average Convergence Divergence, MACD.
Once again, the website does not guarantee any results or investment return based on the information and instruction you have read here. It should be used as learning aids only and if you decide to trade real money, all trading decision should be your own.
We learn from many past and present great traders. Kudo to these master.
Welcome to AmiBroker Academy dot com, amibrokeracademy.com.
Besides benchmarking, we also use other tools such as 1) Ichimoku Cloud, 2) Support Resistance (using box), 3) River (moving average), 4) GMMA and Woodies CCI, 5) Bollinger Bands and Moving Averages, and 6) MACD to analyze chart. See our simple reading of price action.
We translate price action chart into layman language. This will help you in understand the financial instrument you are trading. We believe picture worth a thousand words. So, sometimes we use less words. You can learn the price action interpretation too. Give it a tray. You may not have the same view points as us. Remember all analysis read price action chart differently. It is just like reading an essay, we will have different conclusion.
Trade well.
Trade what you see. Manage your risk.
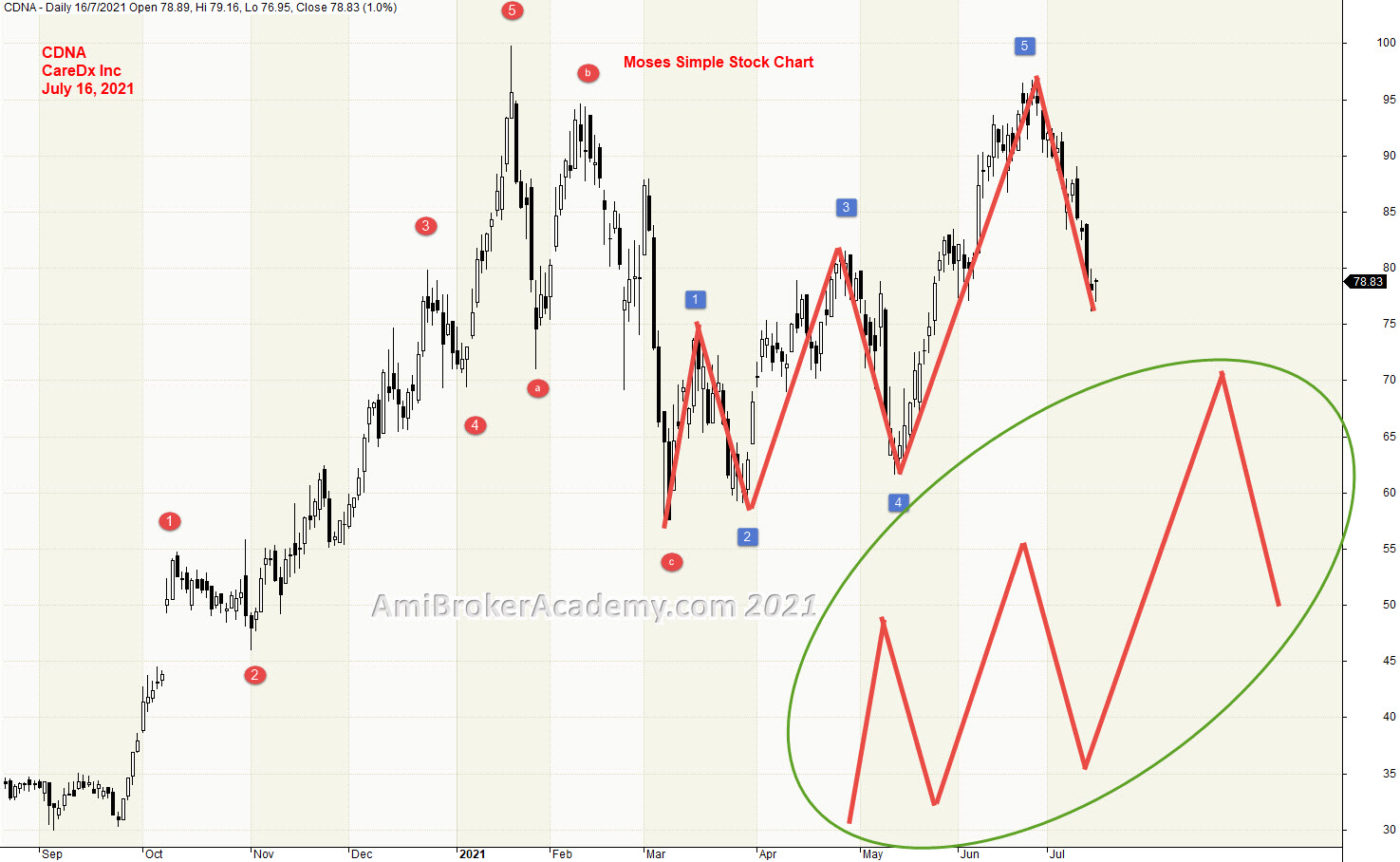
1) CareDx Inc and Elliott Waves
We study price action using wave pattern, we see CareDx Inc price action, price action begin to go from low at bottom left to high and pullback. Price Action after test the support and begin to bounce high again. Why counting the waves? A simple reason is to predict the entry or project the profit taking.
Trade what you see.
Remember, we just read what the chart said. We just mark the wave accordingly. Have fun!
20210716 CareDx Inc and Elliott Waves
Elliott Waves Theory
Elliott Waves Theory came from Ralph Nelson Elliott.
Ralph Nelson Elliott a professional accountant, after analyzing close to 75 years worth of stock data, Elliott discovered that stock markets, thought to behave in a somewhat chaotic manner, actually didn’t.
At 66 years old, he finally concluded enough evidence and confidence to share his discovery with the world. He published his theory in the book entitled The Wave Principle.
Moses Power Charting
Official AmiBrokerAcademy.com Charting
Disclaimer
The above result is for illustration purpose. It is not meant to be used for buy or sell decision. We do not recommend any particular stocks. If particular stocks of such are mentioned, they are meant as demonstration of Amibroker as a powerful charting software and MACD. Amibroker can program to scan the stocks for buy and sell signals.
These are script generated signals. Not all scan results are shown here. The MACD signal should use with price action. Users must understand what MACD and price action are all about before using them. If necessary you should attend a course to learn more on Technical Analysis (TA) and Moving Average Convergence Divergence, MACD.
Once again, the website does not guarantee any results or investment return based on the information and instruction you have read here. It should be used as learning aids only and if you decide to trade real money, all trading decision should be your own.
We learn from many past and present great traders. Kudo to these master.
Welcome to AmiBroker Academy dot com, amibrokeracademy.com.
We bench mark two stock stock price of its price action. If you are our great follower, you will see many examples, we sometime benchmark two semiconductor companies, or such as Alpha and Omega Semiconductor a chip design and marketing company, and cryptocurrency, like Bitcoin, the world first cryptocurrency. Besides that we use other tools such as 1) Ichimoku Cloud, 2) Support Resistance (using box), 3) River (moving average), 4) GMMA and Woodies CCI, 5) Bollinger Bands and Moving Averages, and 6) MACD to analyze chart. See our simple reading of price action.
We translate price action chart into layman language. This will help you in understand the financial instrument you are trading. We believe picture worth a thousand words. So, sometimes we use less words. You can learn the price action interpretation too. Give it a tray. You may not have the same view points as us. Remember all analysis read price action chart differently. It is just like reading an essay, we will have different conclusion.
Trade well.
Trade what you see. Manage your risk.
Elliott Waves
Source: Photo taken from Internet.
Ralph Nelson Elliott a professional accountant, after analyzing close to 75 years worth of stock data, Elliott discovered that stock markets, thought to behave in a somewhat chaotic manner, actually didn’t.
At 66 years old, he finally concluded enough evidence and confidence to share his discovery with the world. He published his theory in the book entitled The Wave Principle.
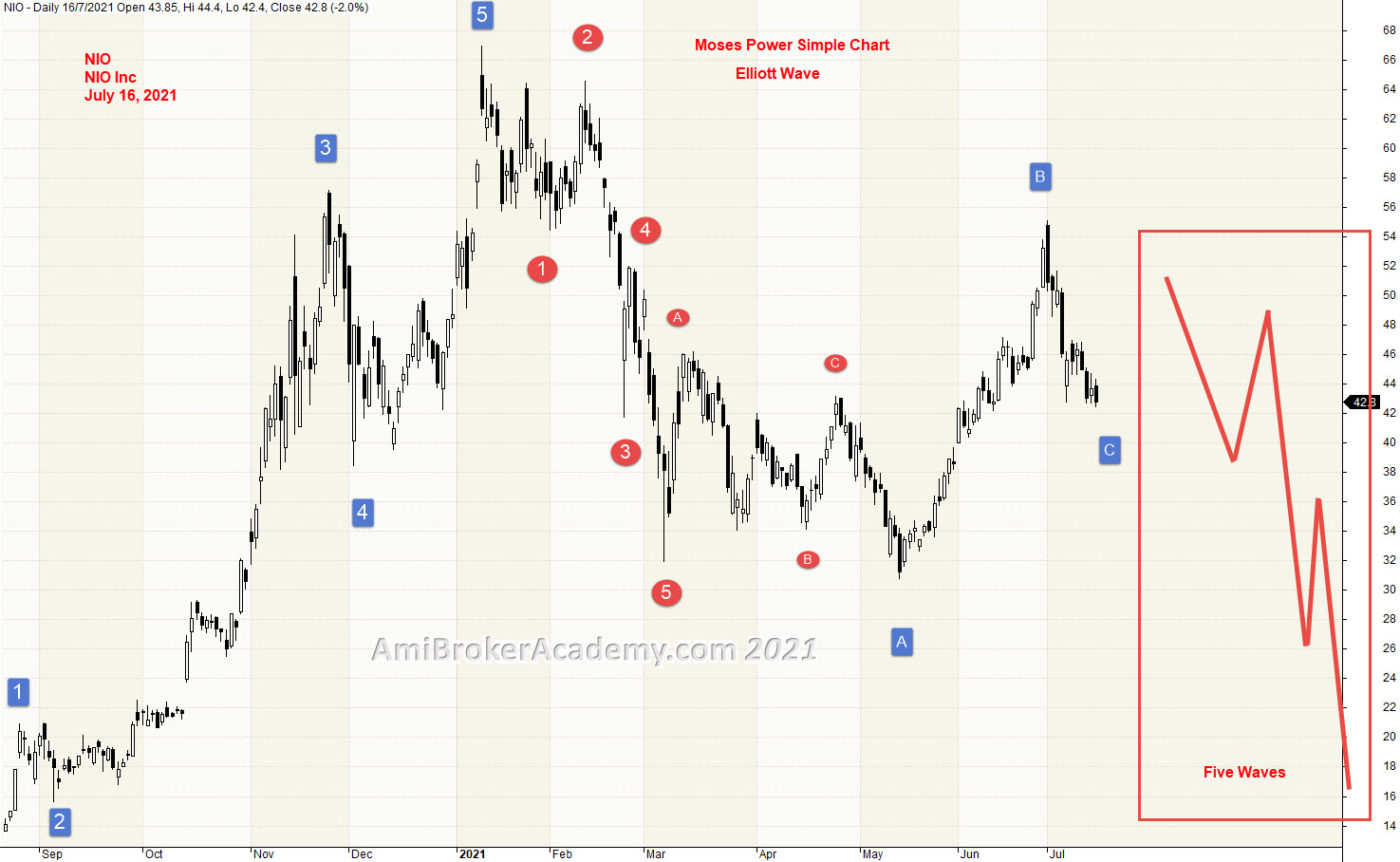
1) NIO Inc and Elliott Waves
We study price action using wave pattern, we see NIO Inc price action, price action begin to go from low at bottom left to high and pullback. Price Action after test the support and begin to return high again. Why counting the waves? One very simple reason is to predict the entry or project the profit taking.
Trade what you see.
Remember, we just read what the chart said. We just mark the wave accordingly. Have fun!
20210716 NIO Inc and Elliott Waves
Moses Power Charting
Official AmiBrokerAcademy.com Charting
Disclaimer
The above result is for illustration purpose. It is not meant to be used for buy or sell decision. We do not recommend any particular stocks. If particular stocks of such are mentioned, they are meant as demonstration of Amibroker as a powerful charting software and MACD. Amibroker can program to scan the stocks for buy and sell signals.
These are script generated signals. Not all scan results are shown here. The MACD signal should use with price action. Users must understand what MACD and price action are all about before using them. If necessary you should attend a course to learn more on Technical Analysis (TA) and Moving Average Convergence Divergence, MACD.
Once again, the website does not guarantee any results or investment return based on the information and instruction you have read here. It should be used as learning aids only and if you decide to trade real money, all trading decision should be your own.
We learn from many past and present great traders. Kudo to these master.
Welcome to AmiBroker Academy dot com, amibrokeracademy.com.
We sometime bench mark stock price action for two stocks. The following example, we benchmark cryptocurrency, Bitcoin and US stock index, NASDAQ Composite Index. Bticoin crypto is a origin Cryptocurrency in the today crypto market. Besides that we use other tools such as 1) Ichimoku Cloud, 2) Support Resistance (using box), 3) River (moving average), 4) GMMA and Woodies CCI, 5) Bollinger Bands and Moving Averages, and 6) MACD to analyze chart. See our simple reading of price action.
We translate price action chart into layman language. This will help you in understand the financial instrument you are trading. We believe picture worth a thousand words. So, sometimes we use less words. You can learn the price action interpretation too. Give it a tray. You may not have the same view points as us. Remember all analysis read price action chart differently. It is just like reading an essay, we will have different conclusion.
Trade well.
Trade what you see. Manage your risk.
1) Volatility Index and Bitcoin Crypto Correlation
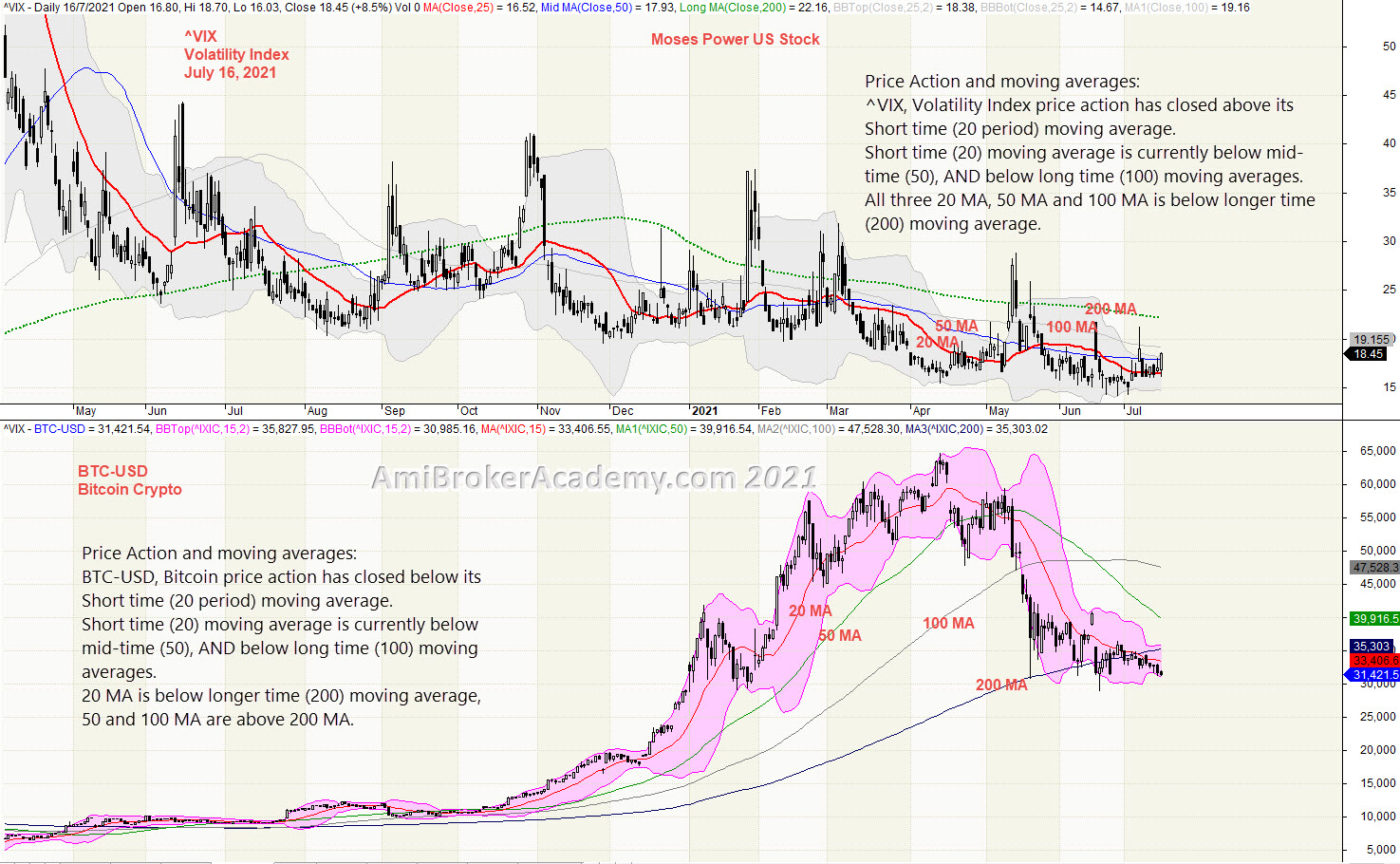
We study price action we see Bitcoin Cryptocurrency price action begin to go from low to high. Price Action after test the peak and fail, price action begin to pullback. We see Volatility Index price action goes from high to low. Benchmark both Bitcoin and ^VIX, you can see Bitcoin has turned from bull to bear, while Volatity Index continues to be bearish.
Trade what you see.
Price Action and moving averages: ^VIX, Volatility Index price action has closed above its Short time (20 period) moving average. Short time (20) moving average is currently below mid-time (50), AND below long time (100) moving averages. All three 20 MA, 50 MA and 100 MA is below longer time (200) moving average.
Price Action and moving averages: BTC-USD, Bitcoin price action has closed below its Short time (20 period) moving average. Short time (20) moving average is currently below mid-time (50), AND below long time (100) moving averages. 20 MA is below longer time (200) moving average, 50 and 100 MA are above 200 MA.
Bollinger Bands: BTC-USD, Bitcoin price action has closed above bottom band. Bollinger Bands are narrower than normal. The narrow width of the bands suggests low volatility as compared to normal range. Therefore, the probability of volatility increasing with a sharp price move in the near-term.
Remember, we just read what the chart said. Have fun!
20210716 Volatility Index and Bitcoin Crypto Correlation
Moses Power Charting
Official AmiBrokerAcademy.com Charting
Disclaimer
The above result is for illustration purpose. It is not meant to be used for buy or sell decision. We do not recommend any particular stocks. If particular stocks of such are mentioned, they are meant as demonstration of Amibroker as a powerful charting software and MACD. Amibroker can program to scan the stocks for buy and sell signals.
These are script generated signals. Not all scan results are shown here. The MACD signal should use with price action. Users must understand what MACD and price action are all about before using them. If necessary you should attend a course to learn more on Technical Analysis (TA) and Moving Average Convergence Divergence, MACD.
Once again, the website does not guarantee any results or investment return based on the information and instruction you have read here. It should be used as learning aids only and if you decide to trade real money, all trading decision should be your own.
We learn from many past and present great traders. Kudo to these master.
Welcome to AmiBroker Academy dot com, amibrokeracademy.com.
We do bench mark stock price action for two stocks. The following example, we benchmark two semiconductor companies, Alpha and Omega Semiconductor and chip design and marketing company, and cryptocurrency, Bitcoin, the world first cryptocurrency. Besides that we use other tools such as 1) Ichimoku Cloud, 2) Support Resistance (using box), 3) River (moving average), 4) GMMA and Woodies CCI, 5) Bollinger Bands and Moving Averages, and 6) MACD to analyze chart. See our simple reading of price action.
We translate price action chart into layman language. This will help you in understand the financial instrument you are trading. We believe picture worth a thousand words. So, sometimes we use less words. You can learn the price action interpretation too. Give it a tray. You may not have the same view points as us. Remember all analysis read price action chart differently. It is just like reading an essay, we will have different conclusion.
Trade well.
Trade what you see. Manage your risk.
1) Alpha and Omega Semiconductor and Bitcoin Correlation
We study price action we see Alpha and Omega Semiconductor price action, price action begin to go from low to high and pullback. Price Action after test the peak and fail, price action begin to pullback. We see Bitcoin price action also like AOS goes from low to high, but in between, price action had “rest” on 200 MA to get support before breakout below 200 MA. Benchmark both AOS and Bitcoin, you can see AOS has goes from bull to bear, while Bitcoin is also to continue to go from bullish to bear, forming a bell shape.
Trade what you see.
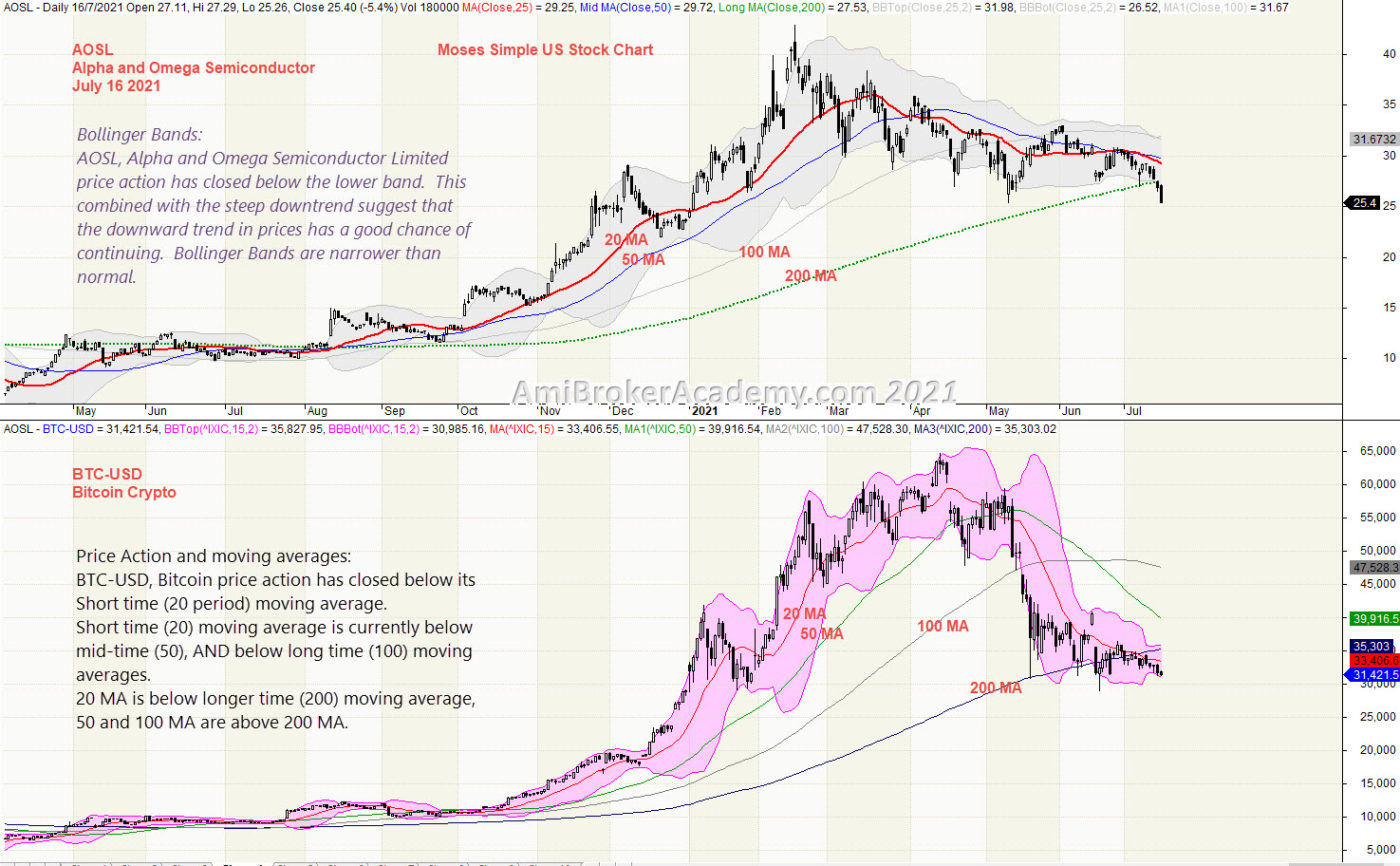
Bollinger Bands: AOSL, Alpha and Omega Semiconductor Limited price action has closed below the lower band. This combined with the steep downtrend suggest that the downward trend in prices has a good chance of continuing. Bollinger Bands are narrower than normal.
Price Action and moving averages: BTC-USD, Bitcoin price action has closed below its Short time (20 period) moving average. Short time (20) moving average is currently below mid-time (50), AND below long time (100) moving averages. 20 MA is below longer time (200) moving average, 50 and 100 MA are above 200 MA.
Remember, we just read what the chart said. Have fun!
20210716 Alpha and Omega Semiconductor and Bitcoin Correlation
Moses Power Charting
Official AmiBrokerAcademy.com Charting
Disclaimer
The above result is for illustration purpose. It is not meant to be used for buy or sell decision. We do not recommend any particular stocks. If particular stocks of such are mentioned, they are meant as demonstration of Amibroker as a powerful charting software and MACD. Amibroker can program to scan the stocks for buy and sell signals.
These are script generated signals. Not all scan results are shown here. The MACD signal should use with price action. Users must understand what MACD and price action are all about before using them. If necessary you should attend a course to learn more on Technical Analysis (TA) and Moving Average Convergence Divergence, MACD.
Once again, the website does not guarantee any results or investment return based on the information and instruction you have read here. It should be used as learning aids only and if you decide to trade real money, all trading decision should be your own.
We learn from many past and present great traders. Kudo to these master.
Welcome to AmiBroker Academy dot com, amibrokeracademy.com.
We do bench mark stock price action for two stocks. The following example, we benchmark two semiconductor companies, Alpha and Omega Semiconductor and chip design and marketing company, and TSMC, the world number one Semiconductor outsourcing company in Taiwan. Besides that we use other tools such as 1) Ichimoku Cloud, 2) Support Resistance (using box), 3) River (moving average), 4) GMMA and Woodies CCI, 5) Bollinger Bands and Moving Averages, and 6) MACD to analyze chart. See our simple reading of price action.
We translate price action chart into layman language. This will help you in understand the financial instrument you are trading. We believe picture worth a thousand words. So, sometimes we use less words. You can learn the price action interpretation too. Give it a tray. You may not have the same view points as us. Remember all analysis read price action chart differently. It is just like reading an essay, we will have different conclusion.
Trade well.
Trade what you see. Manage your risk.
1) Alpha and Omega Semiconductor and TSMC Correlation
We study price action we see AOS price action begin to go from low from bottom left to high and pullback. Price Action after test the peak and fail, price action begin to pullback. We see TSMC price action also like AOS goes from low to high, but in between, price action had “rest” on 100 MA and pullback to get support from 200 MA before return to go higher. Benchmark both AOS and TSMC, you can see AOS has turned from bull to bear, while TSMC continues to be bullish.
Trade what you see.
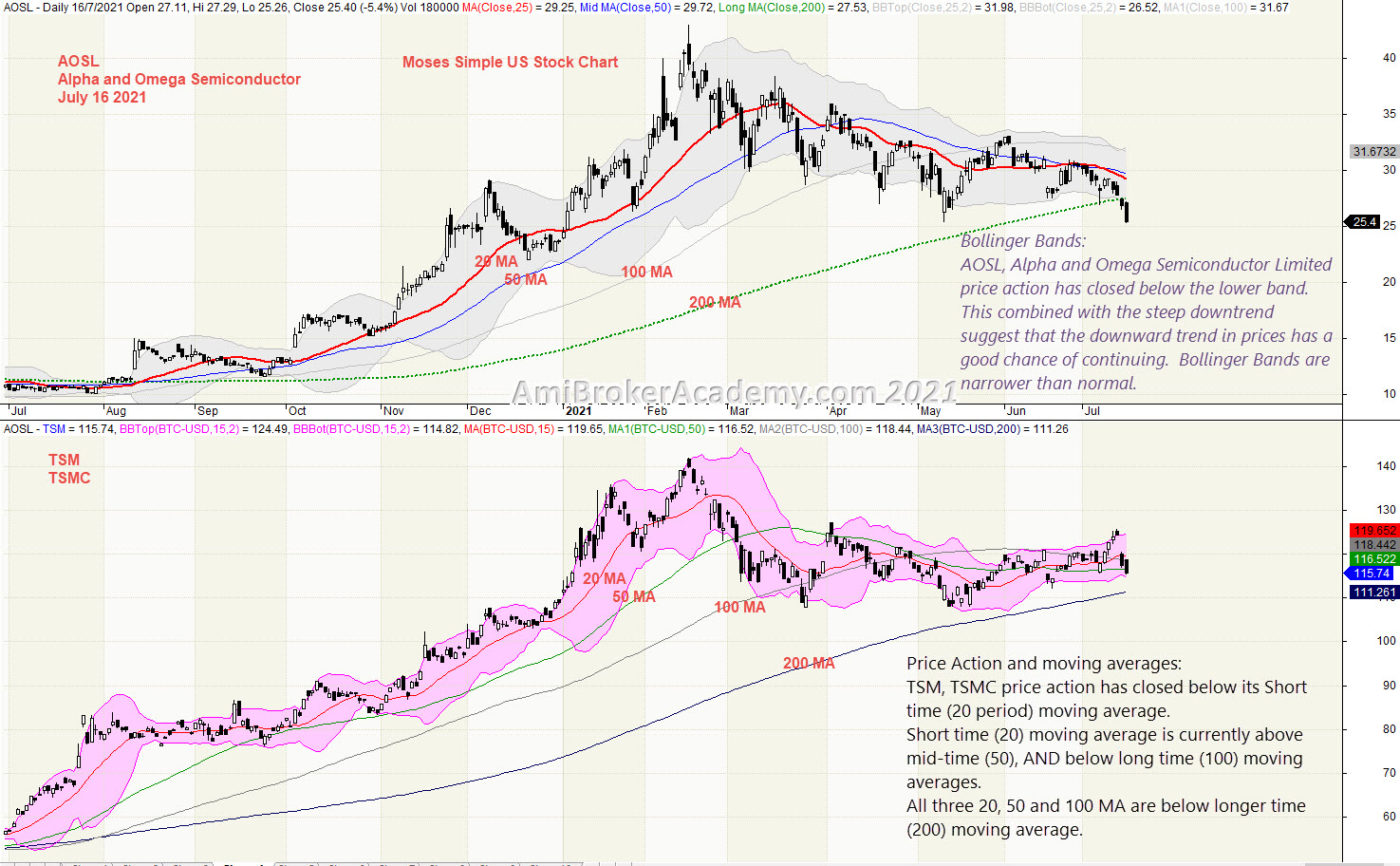
Bollinger Bands: AOSL, Alpha and Omega Semiconductor Limited price action has closed below the lower band. This combined with the steep downtrend suggest that the downward trend in prices has a good chance of continuing. Bollinger Bands are narrower than normal.
Price Action and moving averages: TSM, TSMC price action has closed below its Short time (20 period) moving average. Short time (20) moving average is currently above mid-time (50), AND below long time (100) moving averages. All three 20, 50 and 100 MA are below longer time (200) moving average.
Remember, we just read what the chart said. Have fun!
20210716 Alpha and Omega Semiconductor and TSMC Correlation
Moses Power Charting
Official AmiBrokerAcademy.com Charting
Disclaimer
The above result is for illustration purpose. It is not meant to be used for buy or sell decision. We do not recommend any particular stocks. If particular stocks of such are mentioned, they are meant as demonstration of Amibroker as a powerful charting software and MACD. Amibroker can program to scan the stocks for buy and sell signals.
These are script generated signals. Not all scan results are shown here. The MACD signal should use with price action. Users must understand what MACD and price action are all about before using them. If necessary you should attend a course to learn more on Technical Analysis (TA) and Moving Average Convergence Divergence, MACD.
Once again, the website does not guarantee any results or investment return based on the information and instruction you have read here. It should be used as learning aids only and if you decide to trade real money, all trading decision should be your own.
We learn from many past and present great traders. Kudo to these master.
Welcome to AmiBroker Academy dot com, amibrokeracademy.com.
Trading is all about observation, reading the price bar and not news. By the time you hear the news it is already history. Why? Simple, where the news come from? It has first someone release to the broadcasting company like CNBC, and so on. Next, someone has to read the news to you after some research. This will be few hours after the incident.
As for price bar, it is what the market supply and remand. When market feel that is over price, the price will drop. All this reflected on the price bar almost instantly.
Next is how to read our price bar using some tools, such as MACD. A simple MACD cross up signal line, is hinting there is a possibility that the price action is ready to turn up. Trading need confirmation, what is confirmation? When your receive such as bull signal, do you also get confirmation from candlesticks, support and resistance, or moving averages.
Here, we translate price action chart into layman language. This will help you in understand the financial instrument you are trading. We believe picture worth a thousand words. So, sometimes we use less words. You can learn the price action interpretation too. Give it a tray. You may not have the same view points as us. Remember all analysis read price action chart differently. It is just like reading an essay, we will have different conclusion.
Trade well.
Trade what you see. Manage your risk.
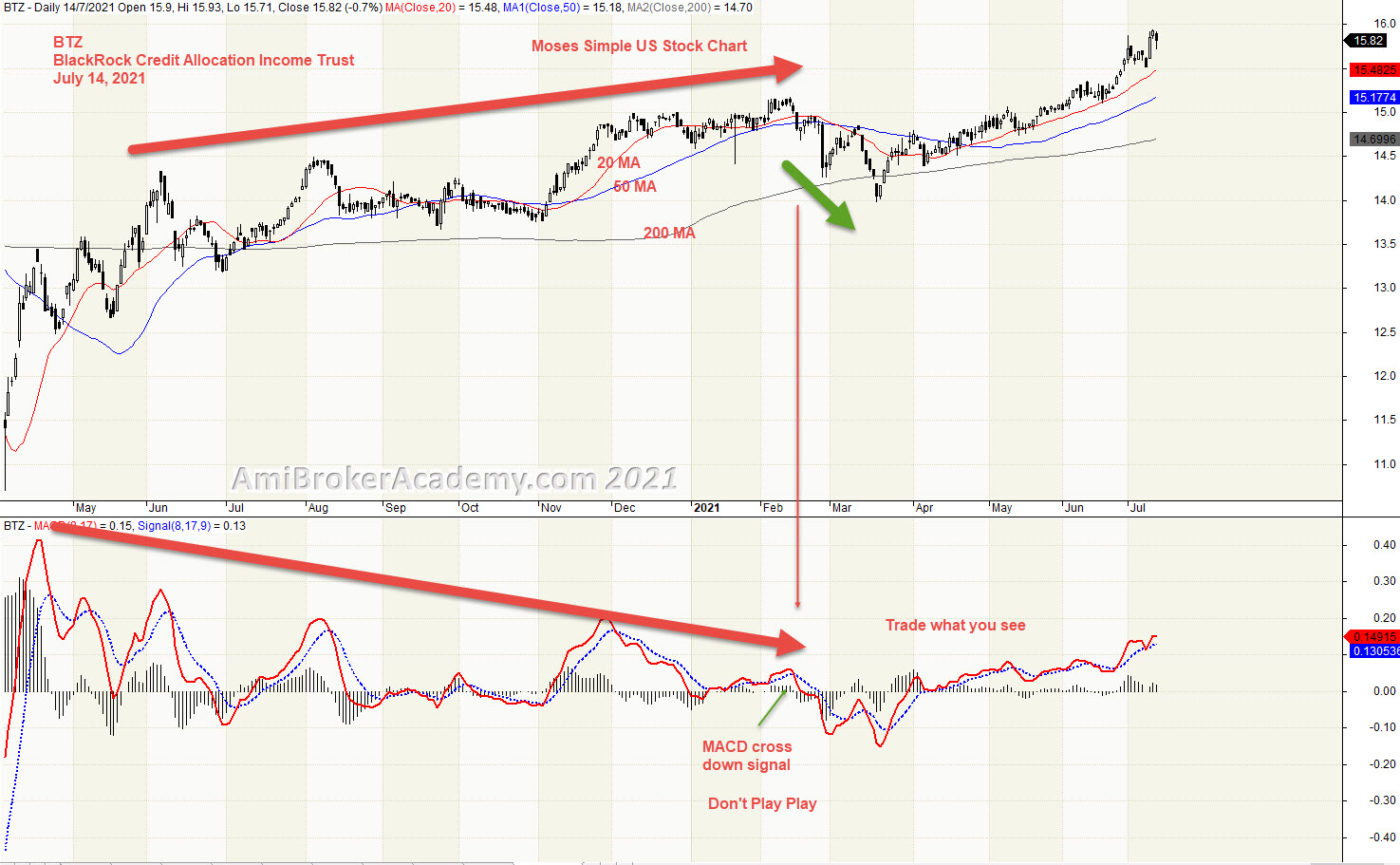
1) BlackRock Credit Allocation Income Trust and MACD Signal
We study price action we see MACD Divergence, price action forms higher high, but MACD continues to form lower high. But, when the pullback is going to happen. As everyone by now aware that MACD Divergence is like traffic light, you don’t stop at every traffic light. So, a MACD Divergence is asking you to find confirmation of price action change. So, look out for bullish candlestick pattern and so on.
Trade what you see.
So, read the information you can get from the chart. You probably notice a MACD cross down signal, this is a signal on price action reversal. Reay to sell.
After the price action response to MACD Divergence, next you are finding the next change in price action direction. See the MACD cross up signal. Price Action ready to continue the bull trend.
Remember, we just read what the chart said. Have fun!
But. don’t play play with MACD indicator. Very simple yet powerful. We are here provide you simple stock chart, but powerful stock charting. Have fun!
20210714 BlackRock Credit Allocation Income Trust and MACD Signal20210714 20210714 BlackRock Credit Allocation Income Trust and MACD Signal
Moses Power Charting
Official AmiBrokerAcademy.com Charting
Disclaimer
The above result is for illustration purpose. It is not meant to be used for buy or sell decision. We do not recommend any particular stocks. If particular stocks of such are mentioned, they are meant as demonstration of Amibroker as a powerful charting software and MACD. Amibroker can program to scan the stocks for buy and sell signals.
These are script generated signals. Not all scan results are shown here. The MACD signal should use with price action. Users must understand what MACD and price action are all about before using them. If necessary you should attend a course to learn more on Technical Analysis (TA) and Moving Average Convergence Divergence, MACD.
Once again, the website does not guarantee any results or investment return based on the information and instruction you have read here. It should be used as learning aids only and if you decide to trade real money, all trading decision should be your own.
We learn from many past and present great traders. Kudo to these master.
Welcome to AmiBroker Academy dot com, amibrokeracademy.com.
We sometime bench mark stock price action for two stocks. The following example, we benchmark British American Tobacco with NASDAQ Composite Index. ^IXIC is a major index in US market. Besides that we use other tools such as 1) Ichimoku Cloud, 2) Support Resistance (using box), 3) River (moving average), 4) GMMA and Woodies CCI, 5) Bollinger Bands and Moving Averages, and 6) MACD to analyze chart. See our simple reading of price action. We read Cryptocurrencies price action chart too.
We translate price action chart into layman language. This will help you in understand the financial instrument you are trading. We believe picture worth a thousand words. So, sometimes we use less words. You can learn the price action interpretation too. Give it a tray. You may not have the same view points as us. Remember all analysis read price action chart differently. It is just like reading an essay, we will have different conclusion.
Trade well.
Trade what you see. Manage your risk.
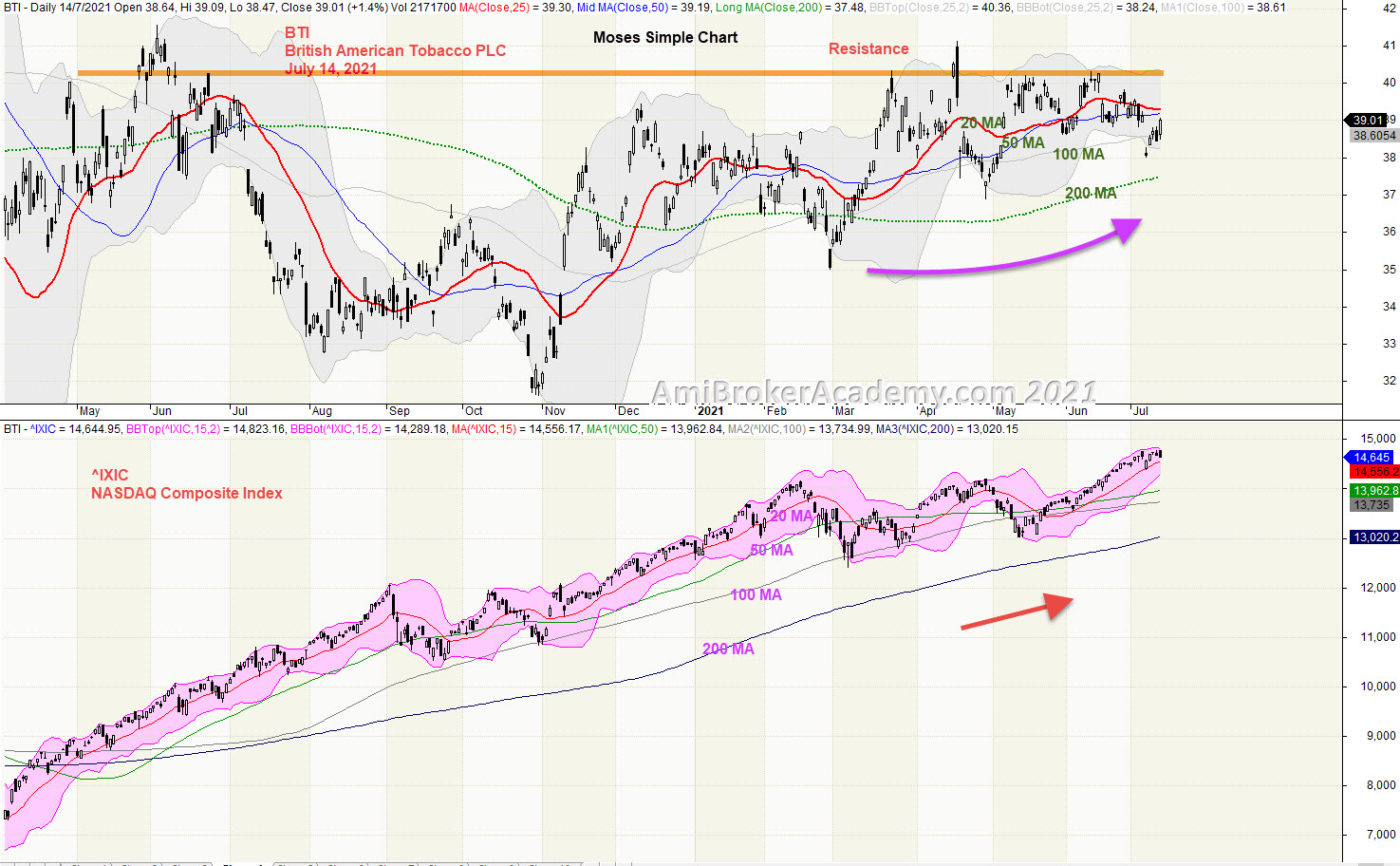
1) British American Tobacco PLC and NASDAQ Composite Index Correlation
We study price action we see British American Tobacco PLC stock price bounce up and pullback. We see price action can not make any higher high, the resistance has been so strong to stand for so many months. Don’t play play, don’t under estimate the price will a longer time to breakout higher. See the last few months the test of the ceiling even more frequently.
Trade what you see.
Now, see NASDAQ Composite Index, the price action has been growing higher and higher. price action continues to forms higher high. Price Action does not move in straight line, it moves in zigzag manner.
Remember, we just read what the chart said. Remember do not imaging.
20210714 British American Tobacco PLC and NASDAQ Composite Index Correlation
Moses Power Charting
Official AmiBrokerAcademy.com Charting
Disclaimer
The above result is for illustration purpose. It is not meant to be used for buy or sell decision. We do not recommend any particular stocks. If particular stocks of such are mentioned, they are meant as demonstration of Amibroker as a powerful charting software and MACD. Amibroker can program to scan the stocks for buy and sell signals.
These are script generated signals. Not all scan results are shown here. The MACD signal should use with price action. Users must understand what MACD and price action are all about before using them. If necessary you should attend a course to learn more on Technical Analysis (TA) and Moving Average Convergence Divergence, MACD.
Once again, the website does not guarantee any results or investment return based on the information and instruction you have read here. It should be used as learning aids only and if you decide to trade real money, all trading decision should be your own.
We learn from many past and present great traders. Kudo to these master.
Welcome to AmiBroker Academy dot com, amibrokeracademy.com.
We will use 1) Ichimoku Cloud, 2) Support Resistance (using box), 3) River (moving average), 4) GMMA and Woodies CCI, 5) Bollinger Bands and Moving Averages, and 6) MACD to analyze price action. We also analyze crypto currency price action. See our posting for Bitcoin and other popular cryptocurries.
What we do is to translate price action chart into layman language for you to understand, ie Picture worth a thousand words. You can learn this too. All analysis read the price action chart differently. It is just like an essay, all reader will have different conclusion.
Trade well.
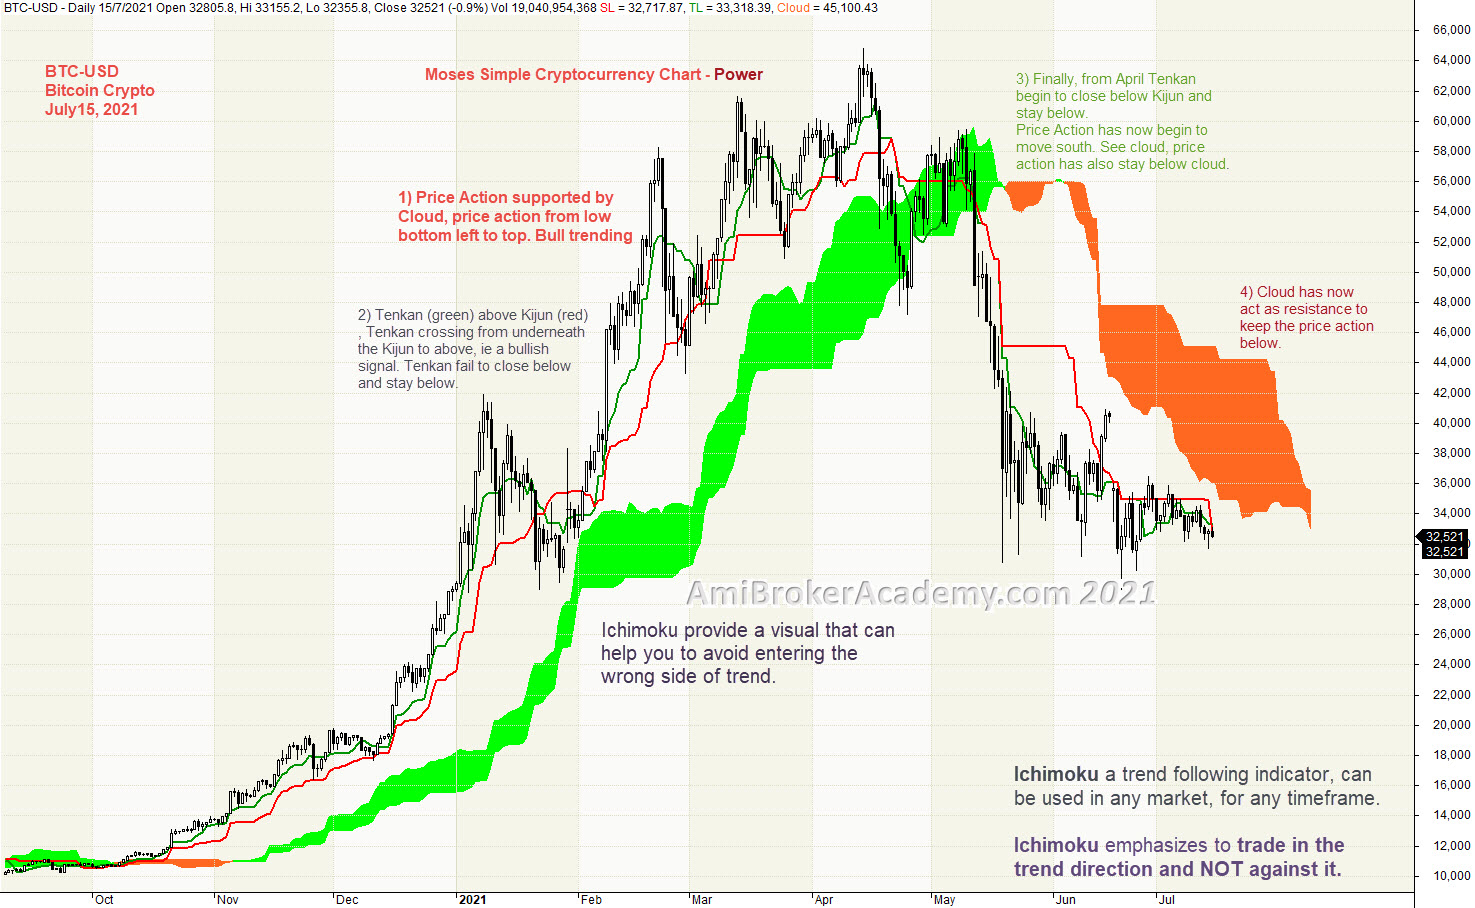
1) BTC-USD | Bitcoin Crypto and Ichimoku Cloud
Ichimoku Cloud is a trend following strategy tool, can use in any market and any timeframe. Ichimoku indicator emphasize to trade in the trend direction. We see price action supported byt the cloud. Price Action goes from the bottom left to top, ie Bull trend. We see Tenkan Sen (green) above Kijun Sen (red). Tenkan cross below Kijun and fail, bull trend. Finally, from April, Tenkan begin to close below Kijun and stay below. Price Action has begin to move south. Price Action begin to stay below cloud. Cloud act as resistance to keep the price action lower.
Ichimoku is a great visual tool, to help to avoid trading in the wrong direction.
Ichimoku Cloud is a multi-dimensional indicator designed to offer support and resistance levels, trending, and entry and exit points. Besides that, Ichimoku is an indicator that gauges future price momentum and determine futures areas of support and resistance. Price Action is currently below cloud.
Trade what you see. See a potential support.
Manage risk is a key in trading.
Moses Free Charting
20210715 Bitcoin Crypto and Ichimoku Cloud
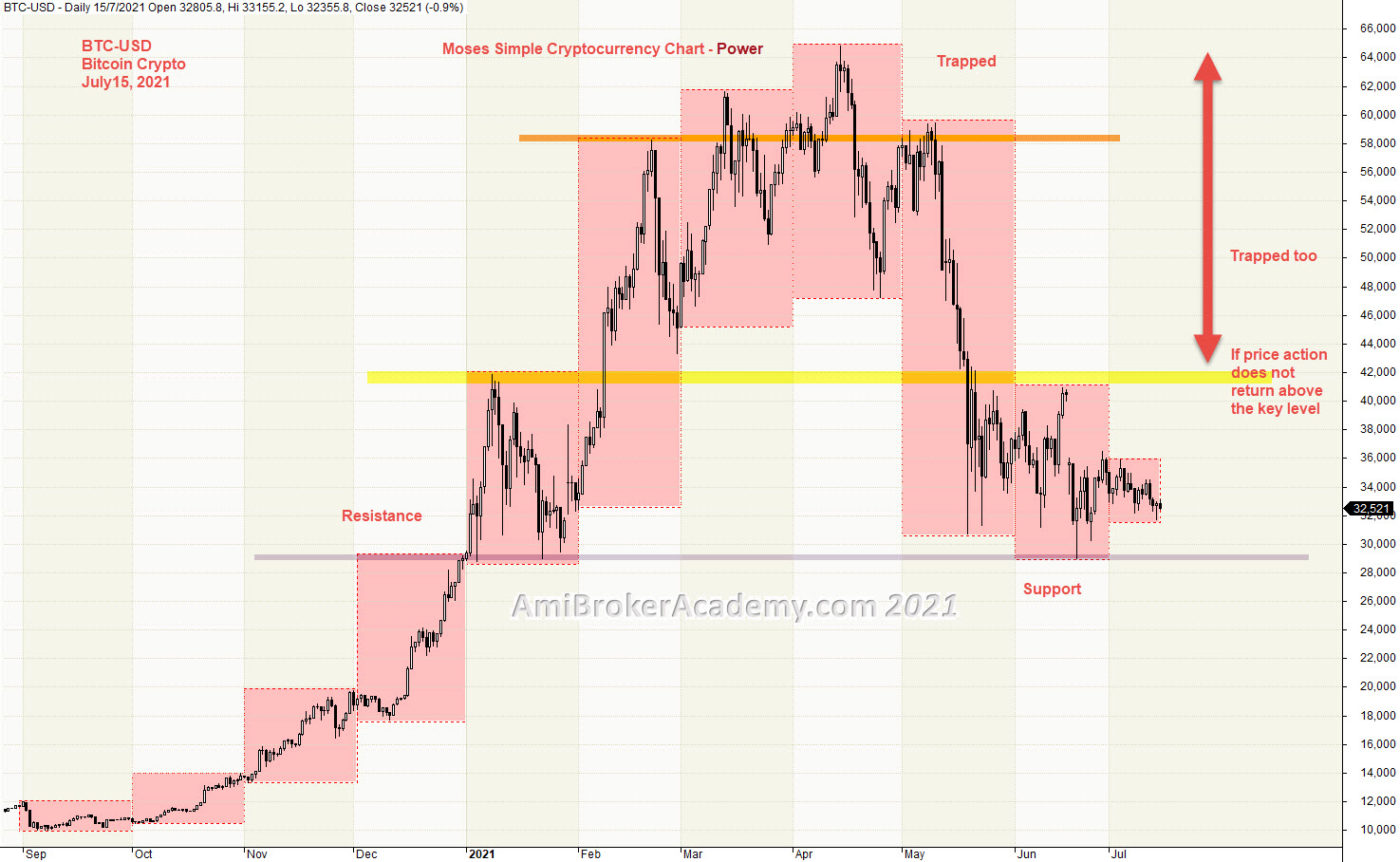
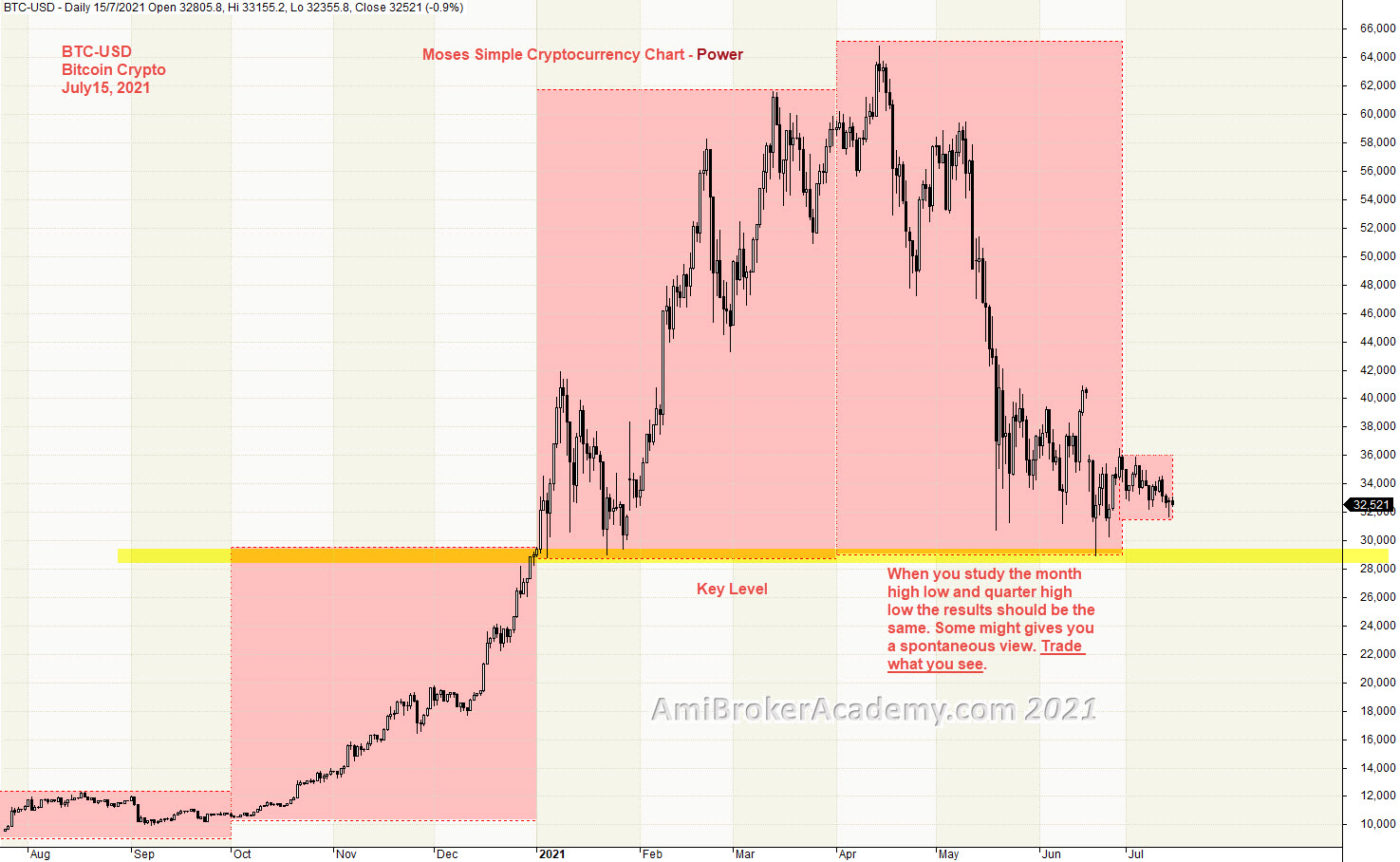
2) Bitcoin Crypto and Support Resistance
Price Action goes from low to high. You can see price action goes from bottom in last September to top in April. Price Action thereafter pullback and form lower high and lower high again.
We use box to box month high low to find a key level. See chart. We have plotted three strong levels. We also find that February and May is the most volatile month, see the box size.
Trade what you see. Manage your risk.
20210715 Bitcoin Crypto and Support Resistance
Bitcoin Crypto Quarter Box and Support Resistance
We sometime box such as quarter instead of months, from the quarter high low to find key level too. See chart.
20210715 Bitcoin Crypto Quarter Box and Support Resistance
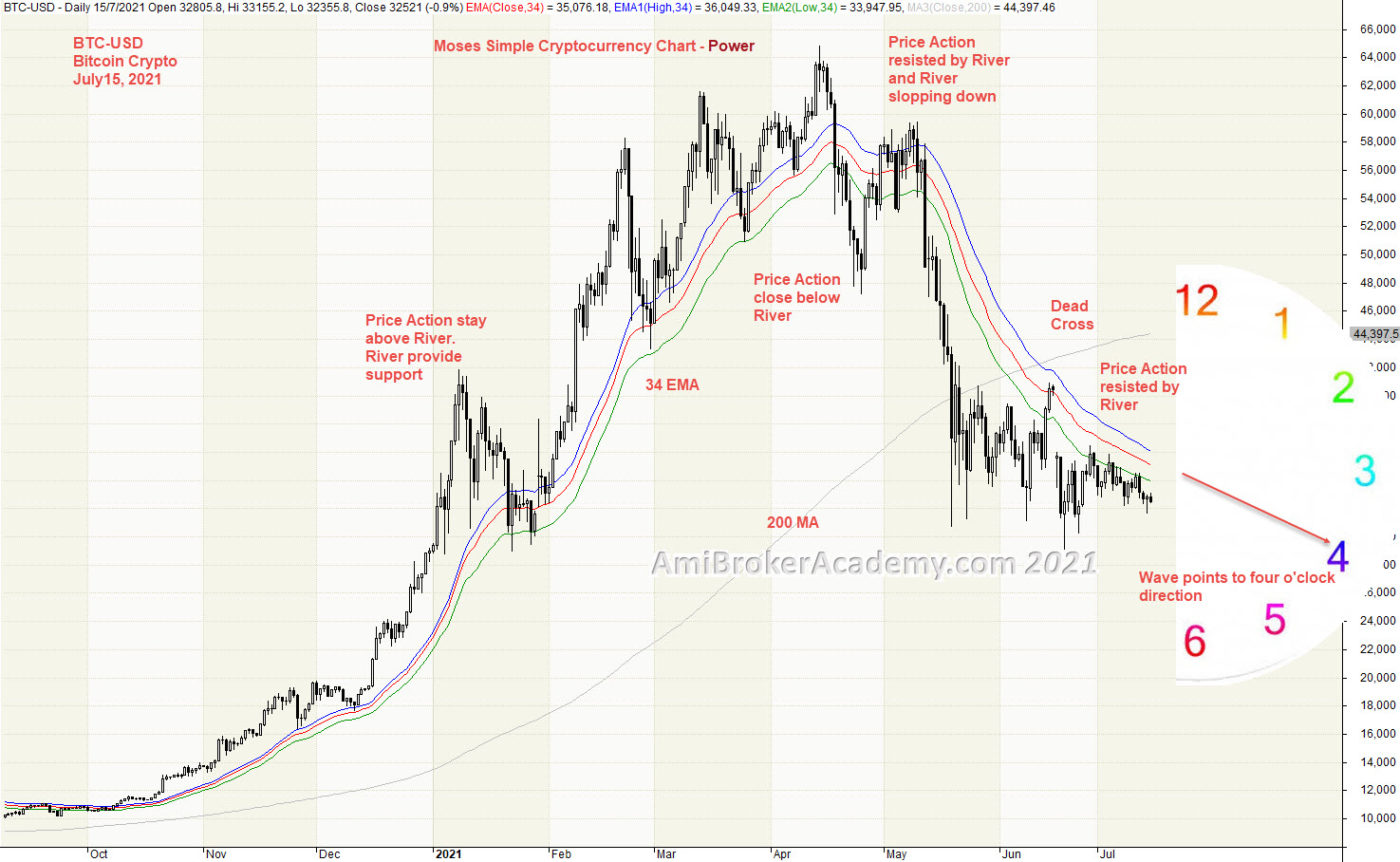
3) Bitcoin Crypto and River
Moving Average is a great visual tool. Raghee uses high, low and close 34 EMA to form a band to determine the wave direction. Price action goes from above 34 EMA to below River. Price Action fail to go higher and begin to go south. Price Action now stay below River.
Manage your risk.
20210715 Bitcoin Crypto and River
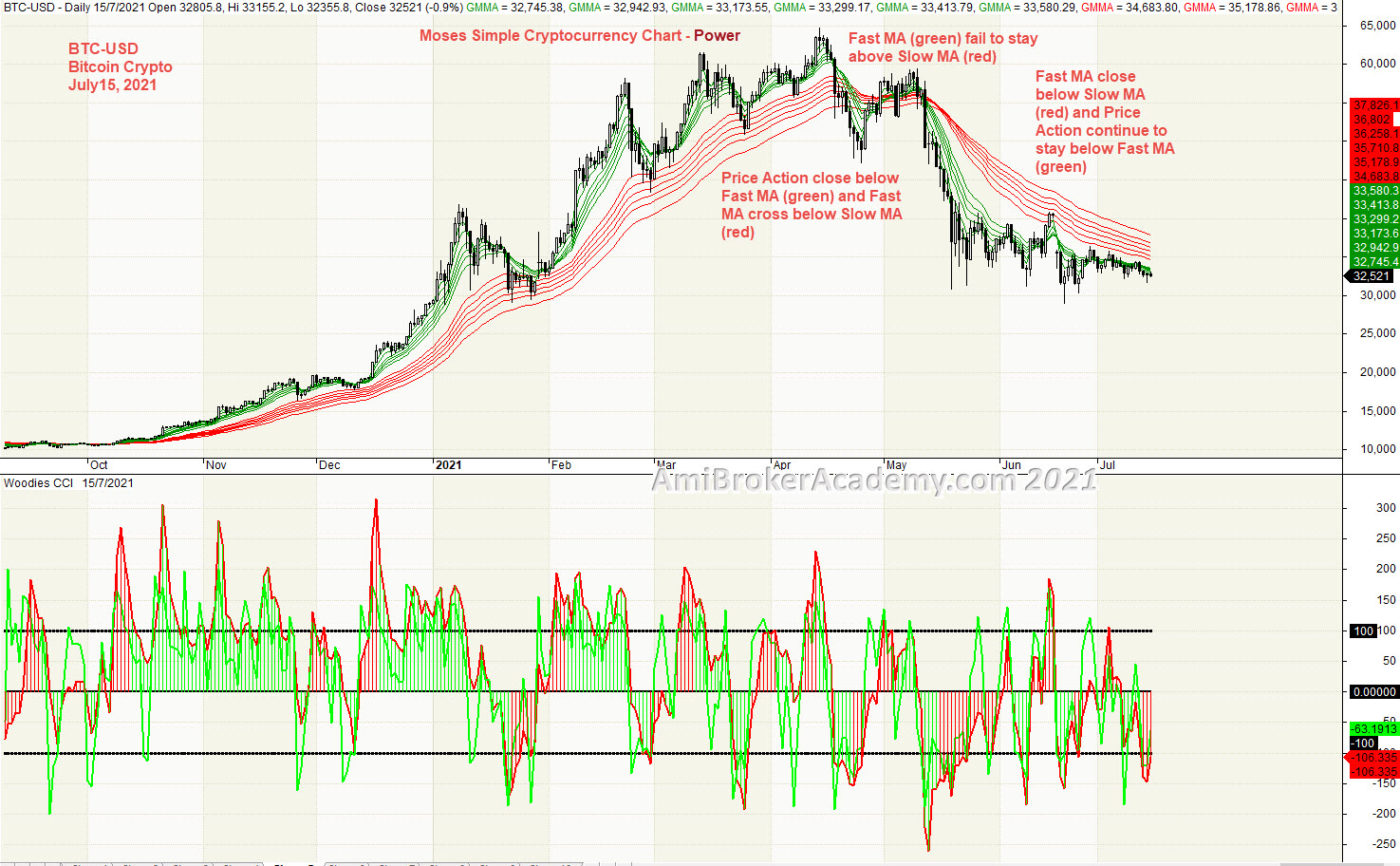
4) Bitcoin Crypto and GMMA and Woodies CCI
Price Action and Fast MA (green) goes from above Slow MA (red) to go below. After April the price action and Fast MA (green) are slopping down. Finally, Fast MA are below Slow MA.
Trade with eyes open.
20210715 Bitcoin Crypto and GMMA and Woodies CCI
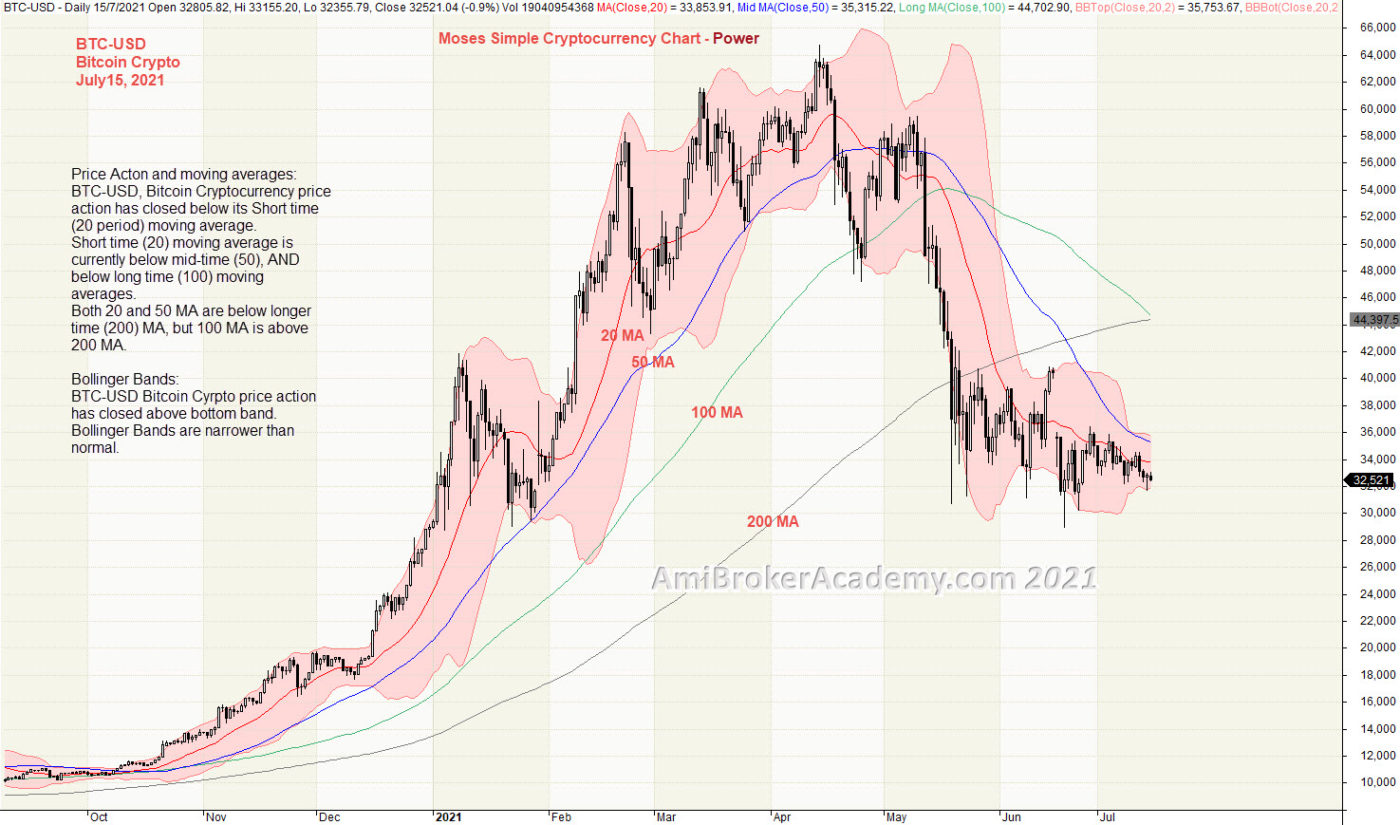
5) Bitcoin Crypto and Bollinger Bands and Moving Averages
Price Acton and moving averages: BTC-USD, Bitcoin Cryptocurrency price action has closed below its Short time (20 period) moving average. Short time (20) moving average is currently below mid-time (50), AND below long time (100) moving averages. Both 20 and 50 MA are below longer time (200) MA, but 100 MA is above 200 MA.
Bollinger Bands: BTC-USD Bitcoin Cyrpto price action has closed above bottom band. Bollinger Bands are narrower than normal.
You may also sport a few ABCD patterns. See chart.
Manage your risk.
20210715 Bitcoin Crypto and Bollinger Bands and Moving Averages
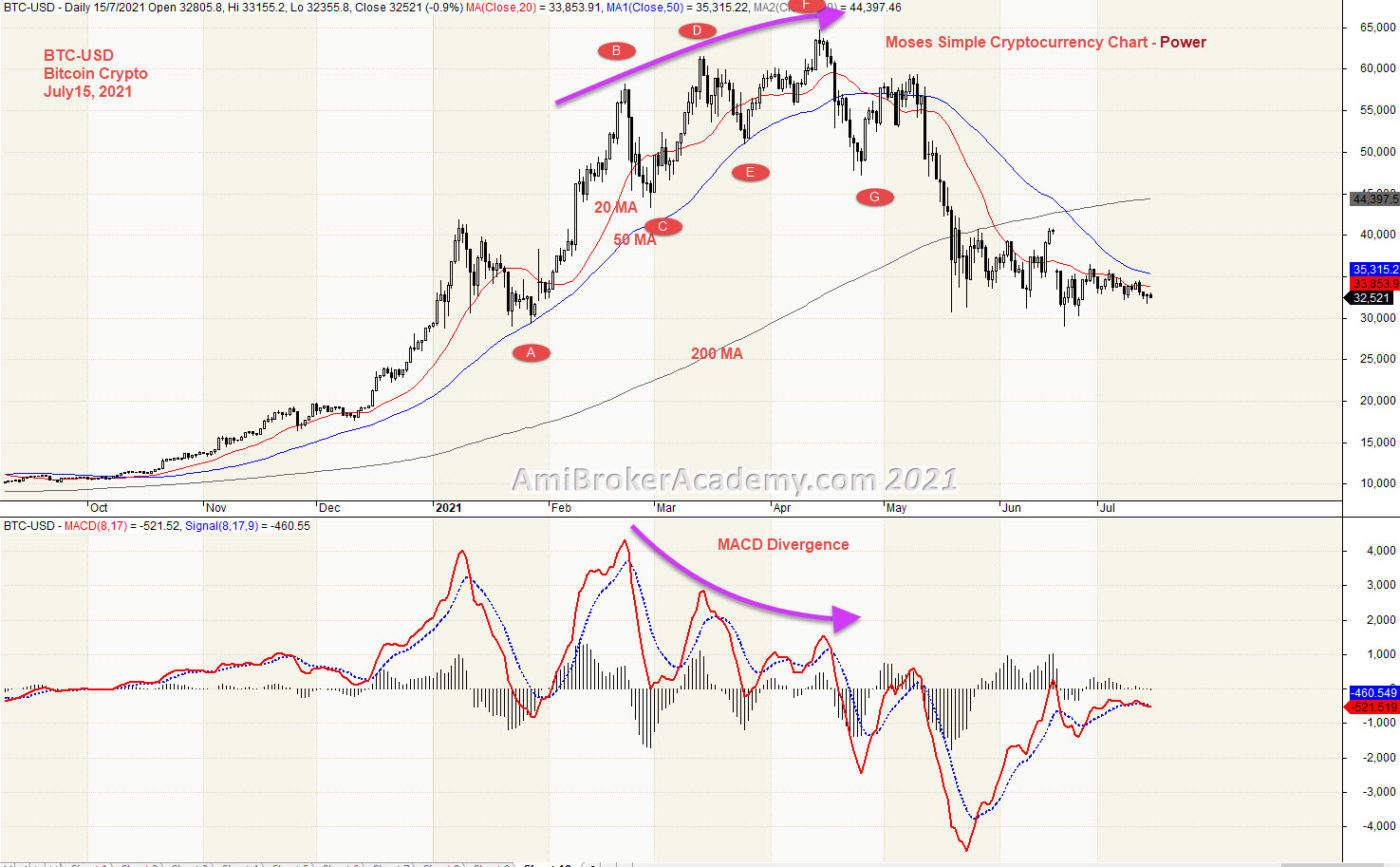
6) Bitcoin Crypto and MACD
We see price action continues to go from low to high, continues to form higher high. 200 MA slopping up. After the MACD Divergence, the price action begin to go lower than the last low. See chart.
Don’t take MACD or MACD-H Divergence lightly. Don’t play play.
Read our earlier posting on benchmarking the Bitcoin with NASDAQ Index. Have fun!
20210715 Bitcoin Crypto and NASDAQ Composite Index Correlation
Moses Power Charting
Official AmiBrokerAcademy.com Charting
Disclaimer
The above result is for illustration purpose. It is not meant to be used for buy or sell decision. We do not recommend any particular stocks. If particular stocks of such are mentioned, they are meant as demonstration of Amibroker as a powerful charting software and MACD. Amibroker can program to scan the stocks for buy and sell signals.
These are script generated signals. Not all scan results are shown here. The MACD signal should use with price action. Users must understand what MACD and price action are all about before using them. If necessary you should attend a course to learn more on Technical Analysis (TA) and Moving Average Convergence Divergence, MACD.
Once again, the website does not guarantee any results or investment return based on the information and instruction you have read here. It should be used as learning aids only and if you decide to trade real money, all trading decision should be your own.
We learn from many past and present great traders. Kudo to these master.
Welcome to AmiBroker Academy dot com, amibrokeracademy.com.
We sometime bench mark stock price action for two stocks. The following example, we benchmark cryptocurrency, Bitcoin and US stock index, NASDAQ Composite Index. Bticoin crypto is a origin Cryptocurrency in the today crypto market. Besides that we use other tools such as 1) Ichimoku Cloud, 2) Support Resistance (using box), 3) River (moving average), 4) GMMA and Woodies CCI, 5) Bollinger Bands and Moving Averages, and 6) MACD to analyze chart. See our simple reading of price action.
We translate price action chart into layman language. This will help you in understand the financial instrument you are trading. We believe picture worth a thousand words. So, sometimes we use less words. You can learn the price action interpretation too. Give it a tray. You may not have the same view points as us. Remember all analysis read price action chart differently. It is just like reading an essay, we will have different conclusion.
Trade well.
Trade what you see. Manage your risk.
1) Bitcoin Crypto and NASDAQ Composite Index Correlation
We study price action we see Bitcoin Cryptocurrency price action begin to go from low from bottom left to high. Price Action after test the peak and fail, price action begin to pullback. We see NASDAQ Composite Index price action also like Bitcoin goes from low to high, but in between, price action had “rest” and pullback to get support from 200 MA before continue to go higher. Benchmark both Bitcoin and IXIC, you can see Bitcoin has turned from bull to bear, while NASDAQ Index continues to be bullish.
Trade what you see.
Price Action and moving averages: BTC-USD, Bitcoin Crypto price action has closed below its Short time (20 period) moving average. Short time (20) moving average is currently below mid-time (50), AND below long time (100) moving averages. 20 and 50 MA are below longer time (200) MA, while 100 MA are just above 200 MA.
Bollinger Bands: BTC-USD, Bitcoin price action has closed above bottom band. Bollinger Bands are narrower than normal. The narrow width of the bands suggests low volatility as compared to normal range. Therefore, the probability of volatility increasing with a sharp price move in the near-term.
Remember, we just read what the chart said. Have fun!
20210715 Bitcoin Crypto and NASDAQ Composite Index Correlation
Moses Power Charting
Official AmiBrokerAcademy.com Charting
Disclaimer
The above result is for illustration purpose. It is not meant to be used for buy or sell decision. We do not recommend any particular stocks. If particular stocks of such are mentioned, they are meant as demonstration of Amibroker as a powerful charting software and MACD. Amibroker can program to scan the stocks for buy and sell signals.
These are script generated signals. Not all scan results are shown here. The MACD signal should use with price action. Users must understand what MACD and price action are all about before using them. If necessary you should attend a course to learn more on Technical Analysis (TA) and Moving Average Convergence Divergence, MACD.
Once again, the website does not guarantee any results or investment return based on the information and instruction you have read here. It should be used as learning aids only and if you decide to trade real money, all trading decision should be your own.
We learn from many past and present great traders. Kudo to these master.
Welcome to AmiBroker Academy dot com, amibrokeracademy.com.
We will use 1) Ichimoku Cloud, 2) Support Resistance (using box), 3) River (moving average), 4) GMMA and Woodies CCI, 5) Bollinger Bands and Moving Averages, and 6) MACD to analyze price action. We also analyze crypto currency price action. See our posting for Bitcoin and other popular cryptocurries.
What we do is to translate price action chart into layman language for you to understand, ie Picture worth a thousand words. You can learn this too. All analysis read the price action chart differently. It is just like an essay, all reader will have different conclusion.
Stock Listed Both in Hong Kong and Shanghai
SMIC listed both in Hong Kong Stock Exchange and Shanghai Stock Exchange. SMIC Hong Kong stock code, 0981.HK, and Shanghai stock code, 688981.SS.
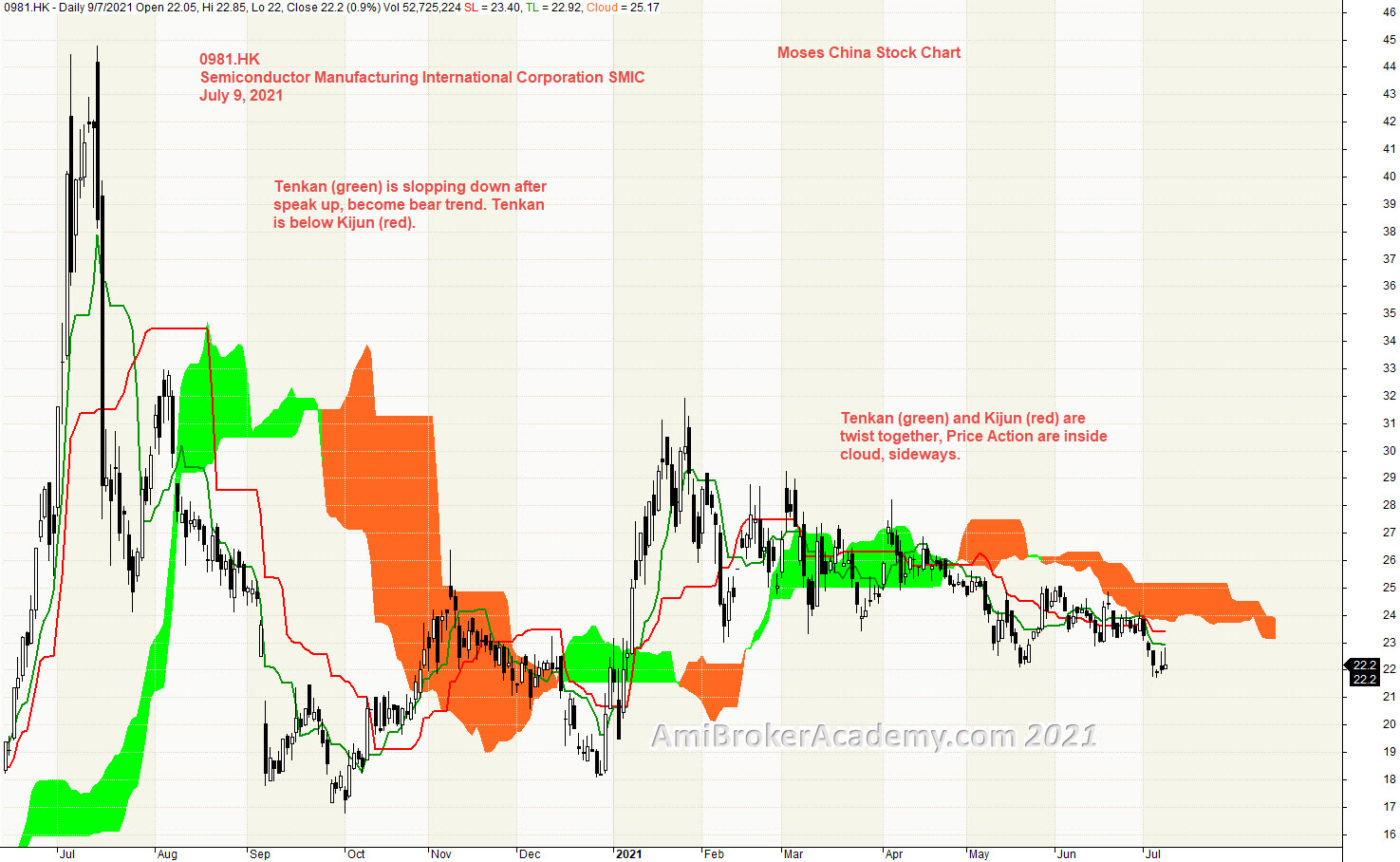
1) 0981.HK | Semiconductor Manufacturing International Corporation SMIC and Ichimoku Cloud
Ichimoku Cloud is a trend following strategy tool. We see Tenkan Sen trending up from last June and speak in July last year and pullback. That is also reflected in Tenkan cross below Kijun. Bull trend has ended in July last year. Tenkan Sen begin to zigzag with Kijun a few times, price action is sink in the cloud. Price Action begin to go sideways.
Ichimoku Cloud is a multi-dimensional indicator designed to offer support and resistance levels, trending, and entry and exit points. Besides that, Ichimoku is an indicator that gauges future price momentum and determine futures areas of support and resistance. Price Action seems to go from support to resisted by cloud.
Trade what you see. See a potential resistance.
Manage risk is a key in trading.
Moses Free Charting
20210709 0981 Semiconductor Manufacturing International Corporation SMIC and Ichimoku Cloud
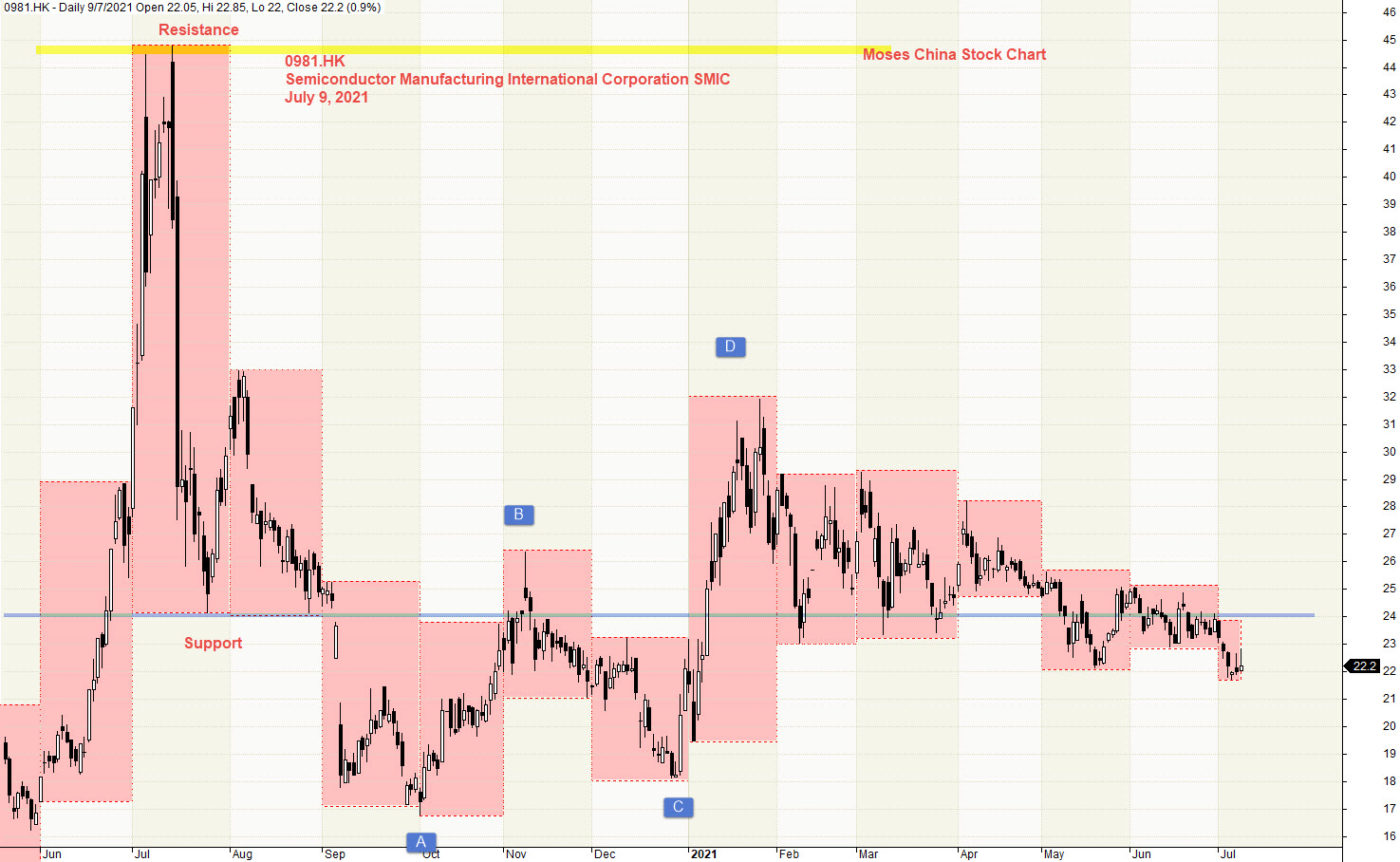
2) Semiconductor Manufacturing International Corporation SMIC and Support Resistance
Price Action goes from low to high to low again. See a key level we determine from the month high low. You can see price action first goes below key level, next the price action stay above key level. What’s now? Price Action return t below key level (blue).
We use box to box month high low to find a key level. See chart. We have plotted a strong level. Support turns Resistance and support then resistance again. Can the resistance stop the price action from moving up again? Will see.
Trade what you see. Manage your risk.
20210709 0981 Semiconductor Manufacturing International Corporation SMIC and Support Resistance
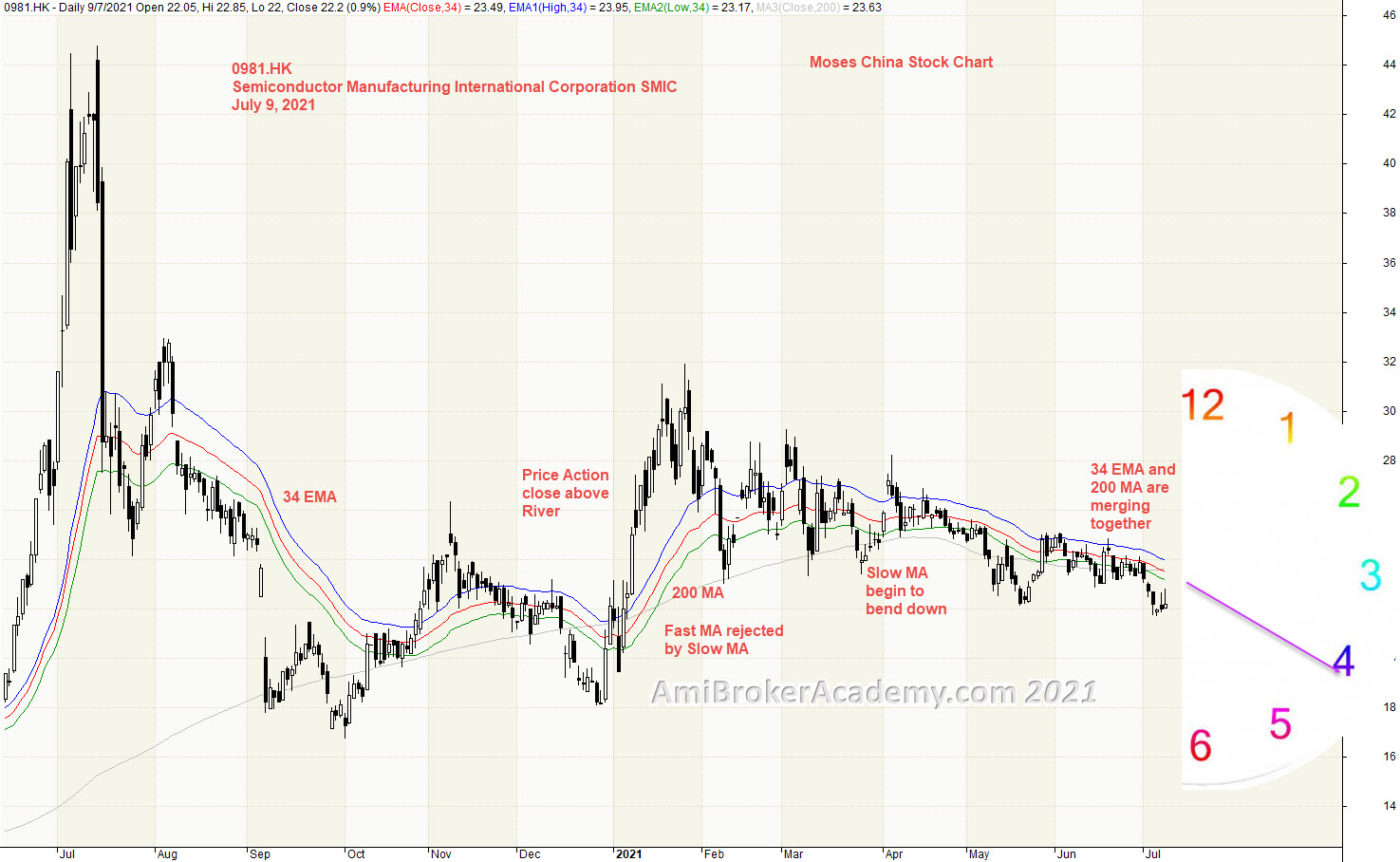
3) Semiconductor Manufacturing International Corporation SMIC and River
Moving Average is a great visual tool. Raghee uses high, low and close 34 EMA to form a band to determine the wave direction. Price action goes from above 34 EMA to below River, bear trend? Price Action finally zigzag along River, price action seems in sideways. Trade what you see.
Overall bear trend.
Manage your risk.
20210709 0981 Semiconductor Manufacturing International Corporation SMIC and River
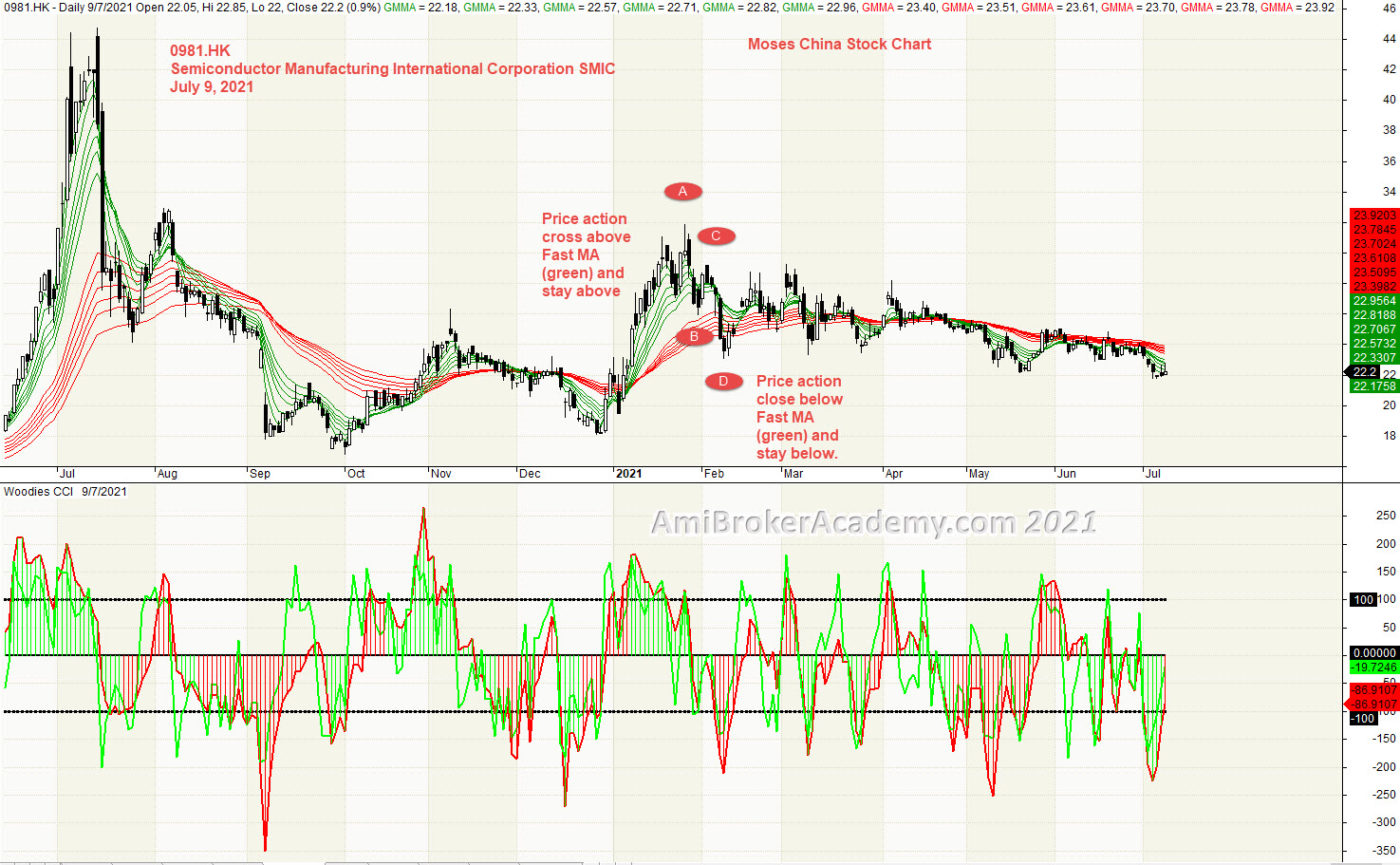
4) Semiconductor Manufacturing International Corporation SMIC and GMMA and Moving Averages
Price Action and Fast MA (green) goes from above Slow MA (red) to below. After last July the price action and Fast MA (green) are dipped below the Slow MA (red). Finally, Fast MA are still below Slow MA,
20210709 0981 Semiconductor Manufacturing International Corporation SMIC and GMMA and Moving Averages
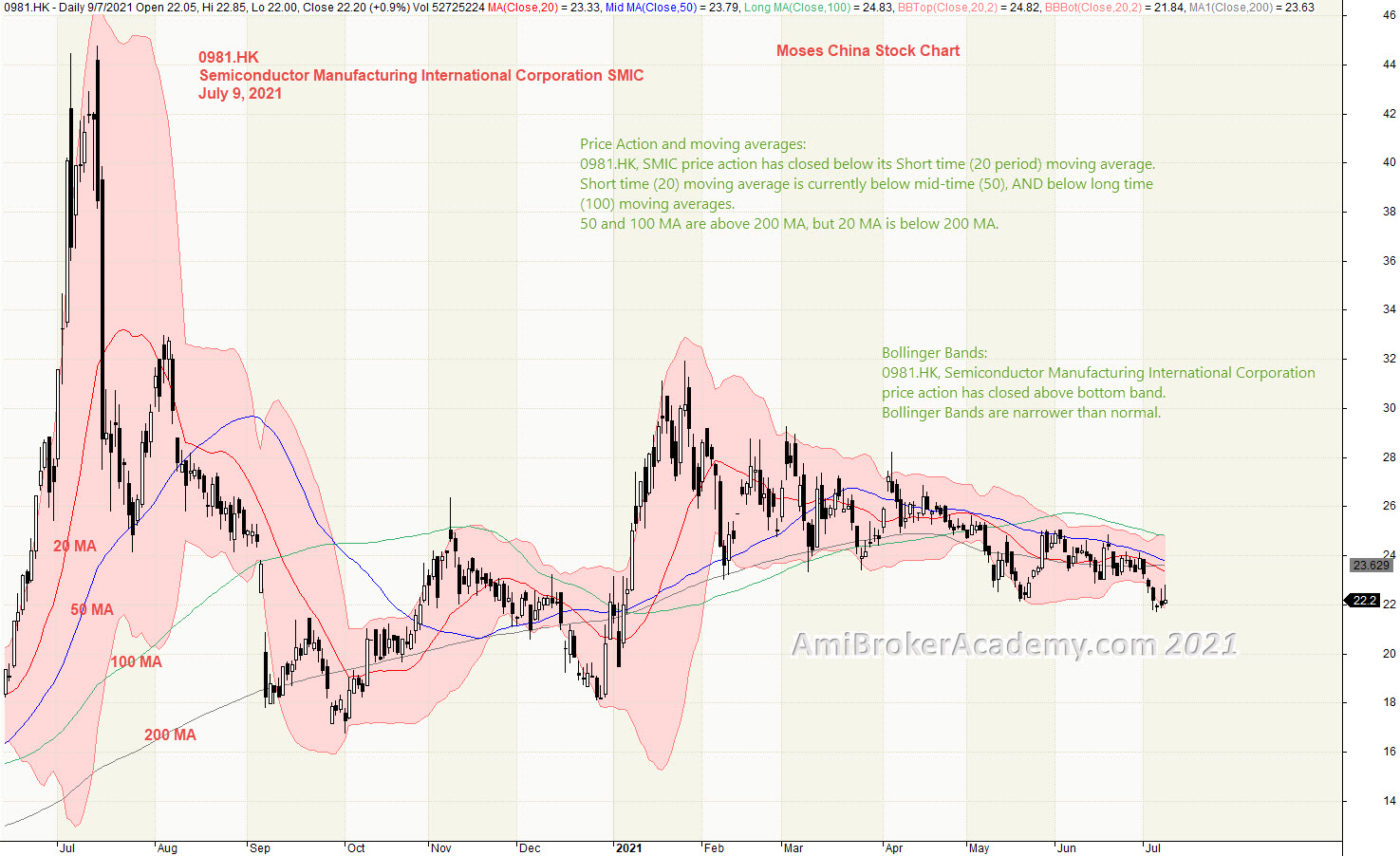
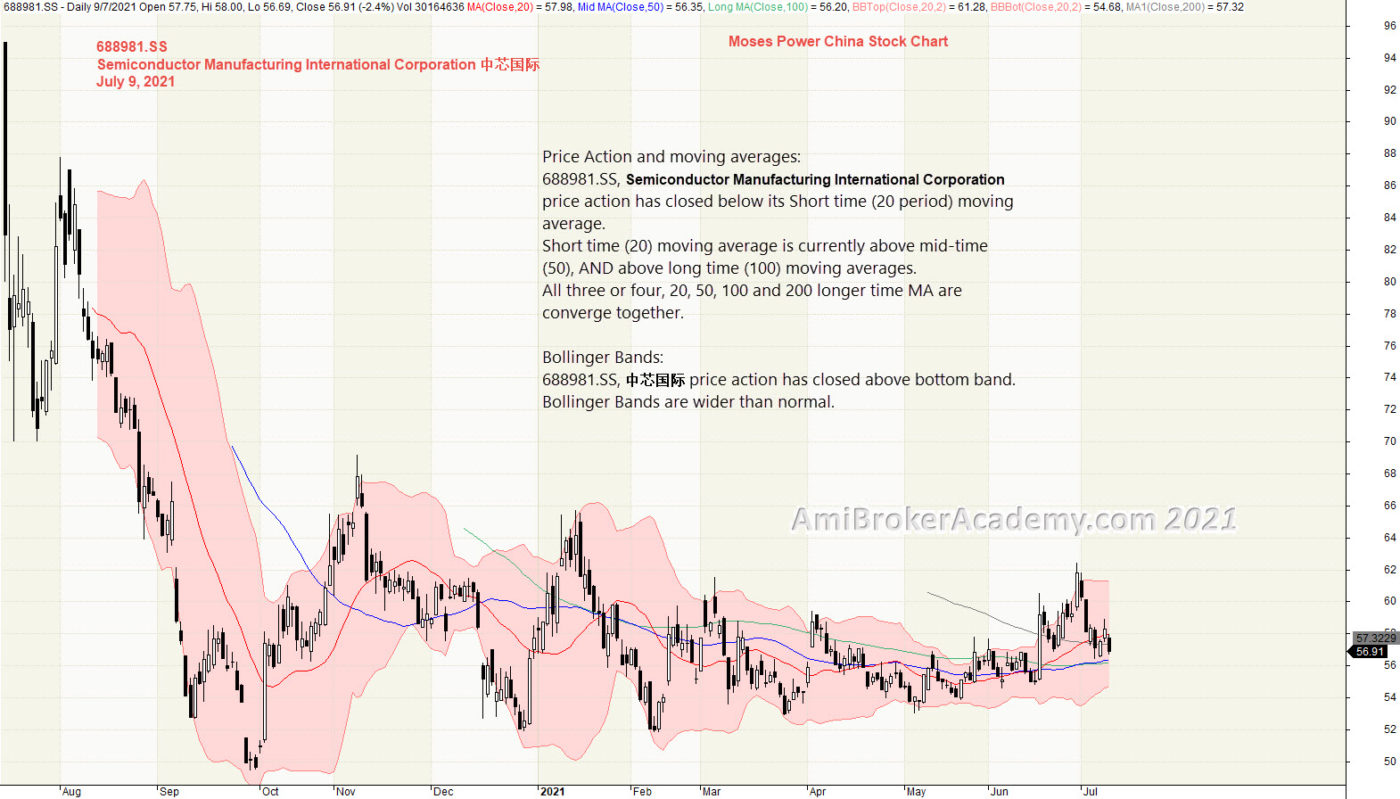
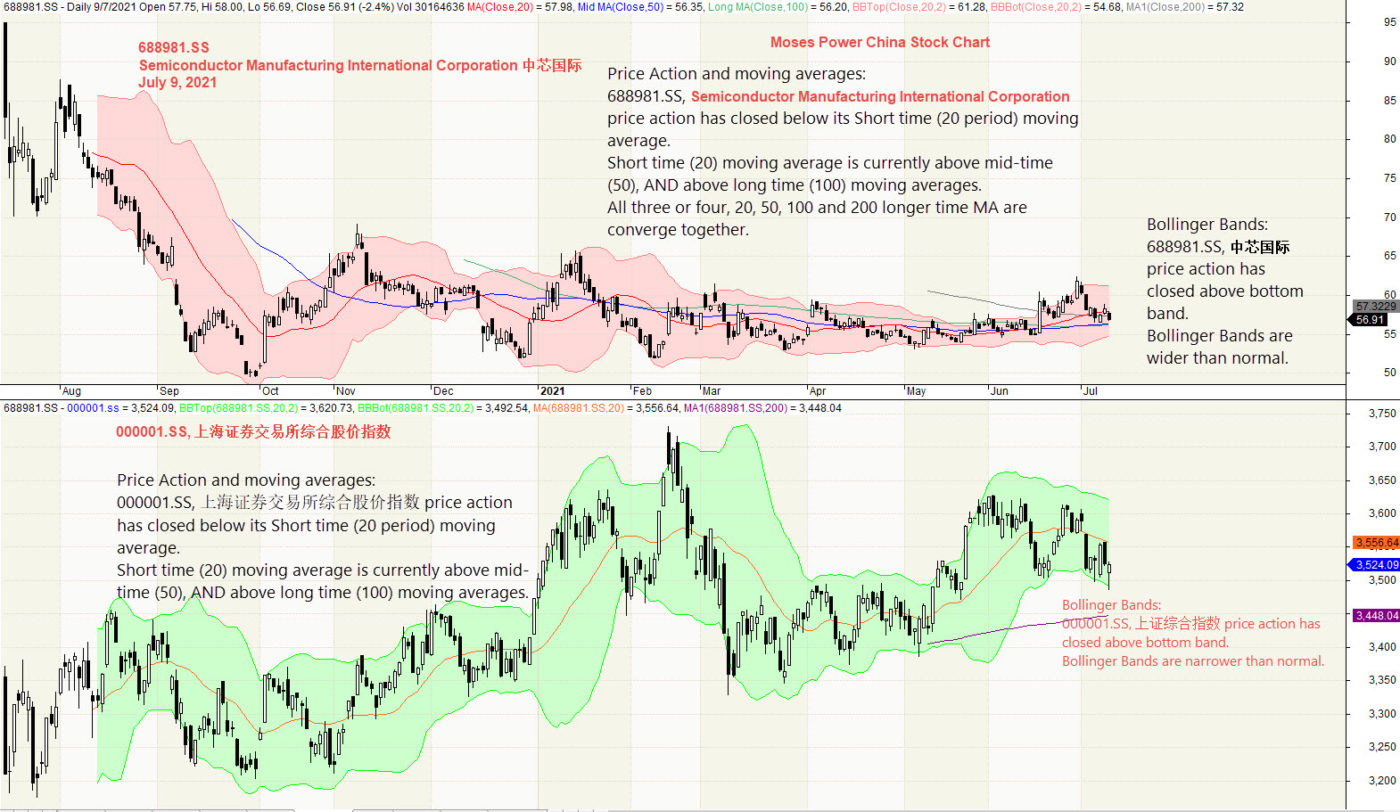
5) Semiconductor Manufacturing International Corporation SMIC and Bollinger Bands and Moving Averages
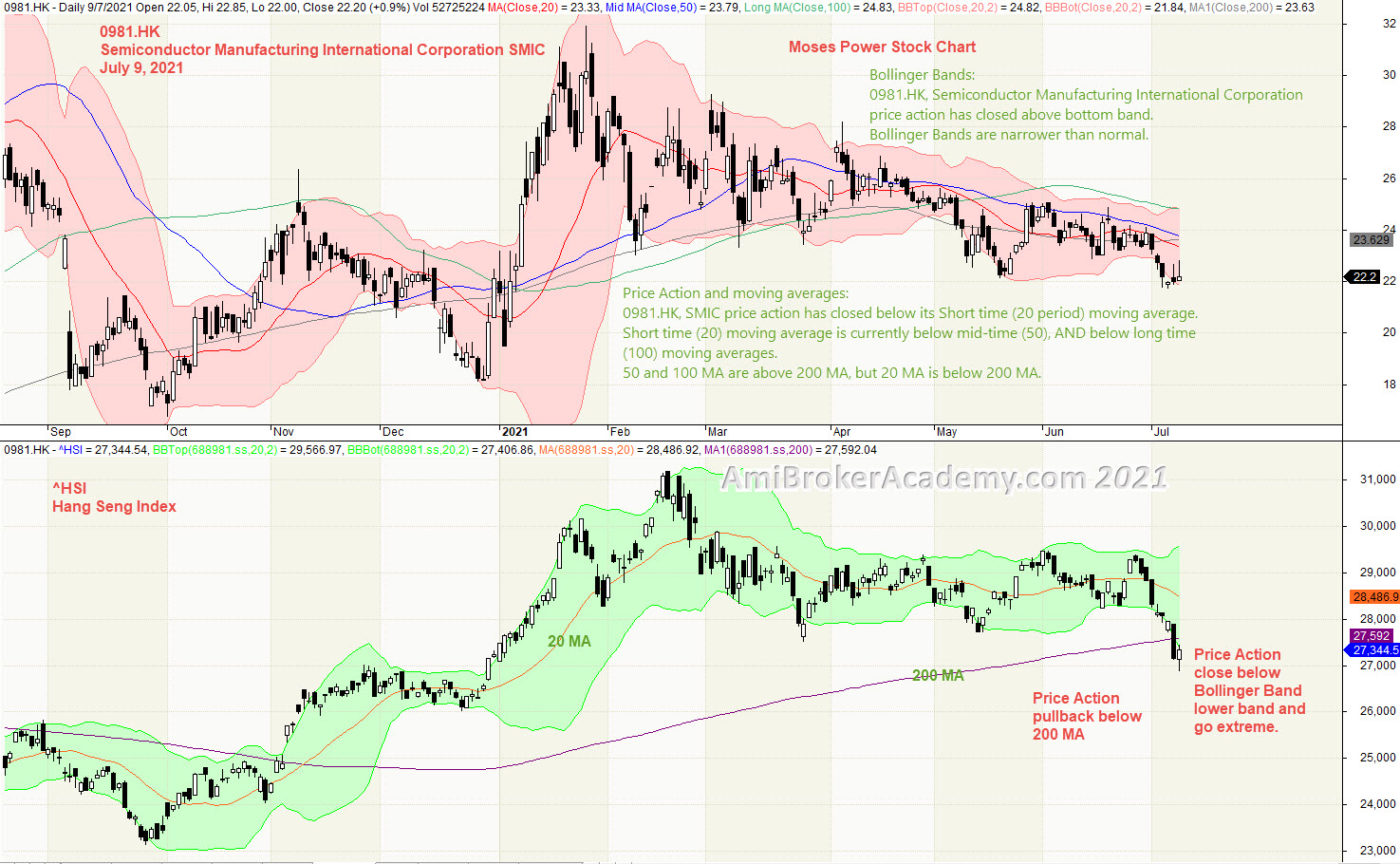
Price Action and moving averages: 0981.HK, SMIC price action has closed below its Short time (20 period) moving average. Short time (20) moving average is currently below mid-time (50), AND below long time (100) moving averages. 50 and 100 MA are above 200 MA, but 20 MA is below 200 MA.
Bollinger Bands: 0981.HK, Semiconductor Manufacturing International Corporation price action has closed above bottom band. Bollinger Bands are narrower than normal.
Manage your risk.
20210709 0981 Semiconductor Manufacturing International Corporation SMIC and Bollinger Bands and Moving Averages
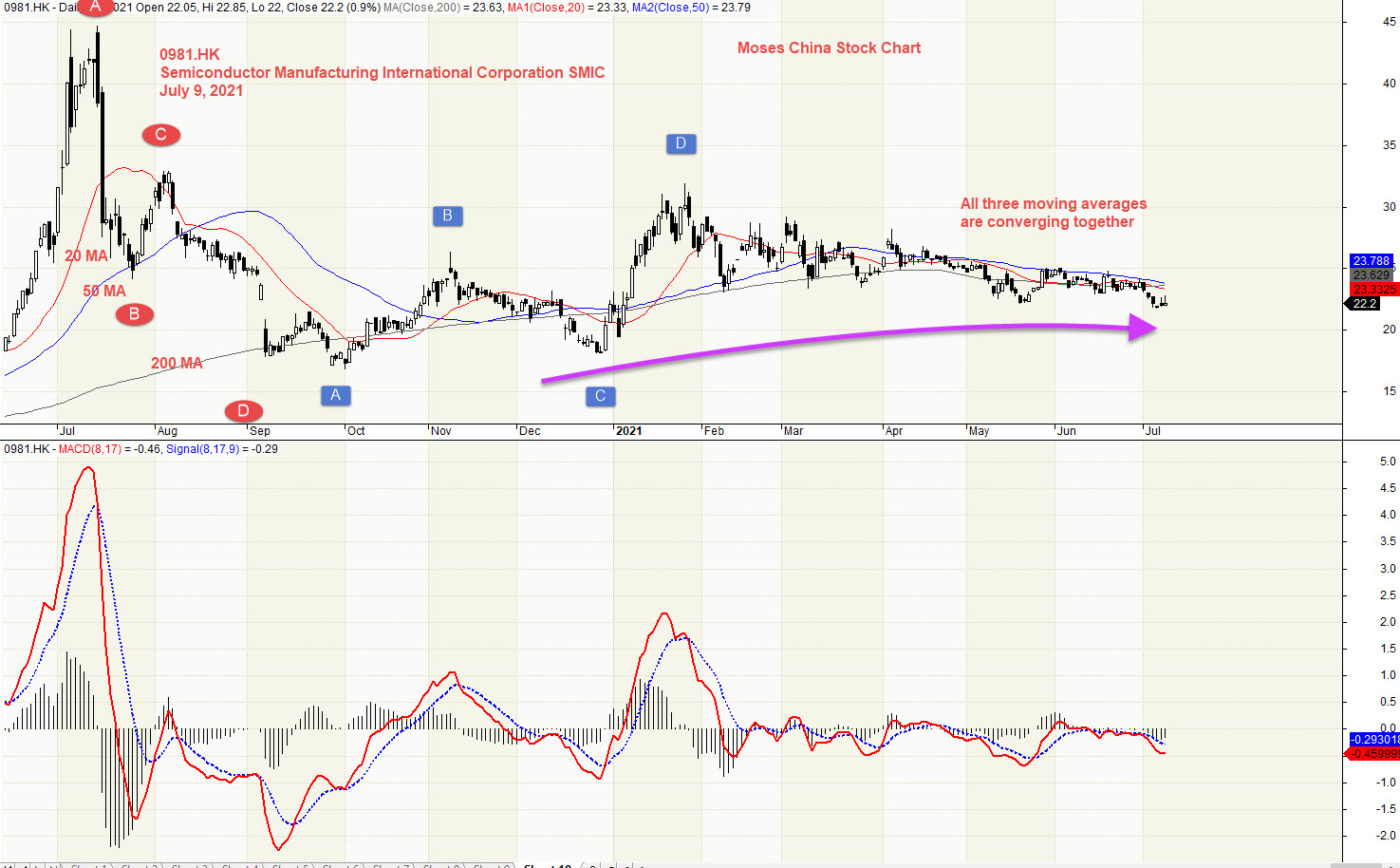
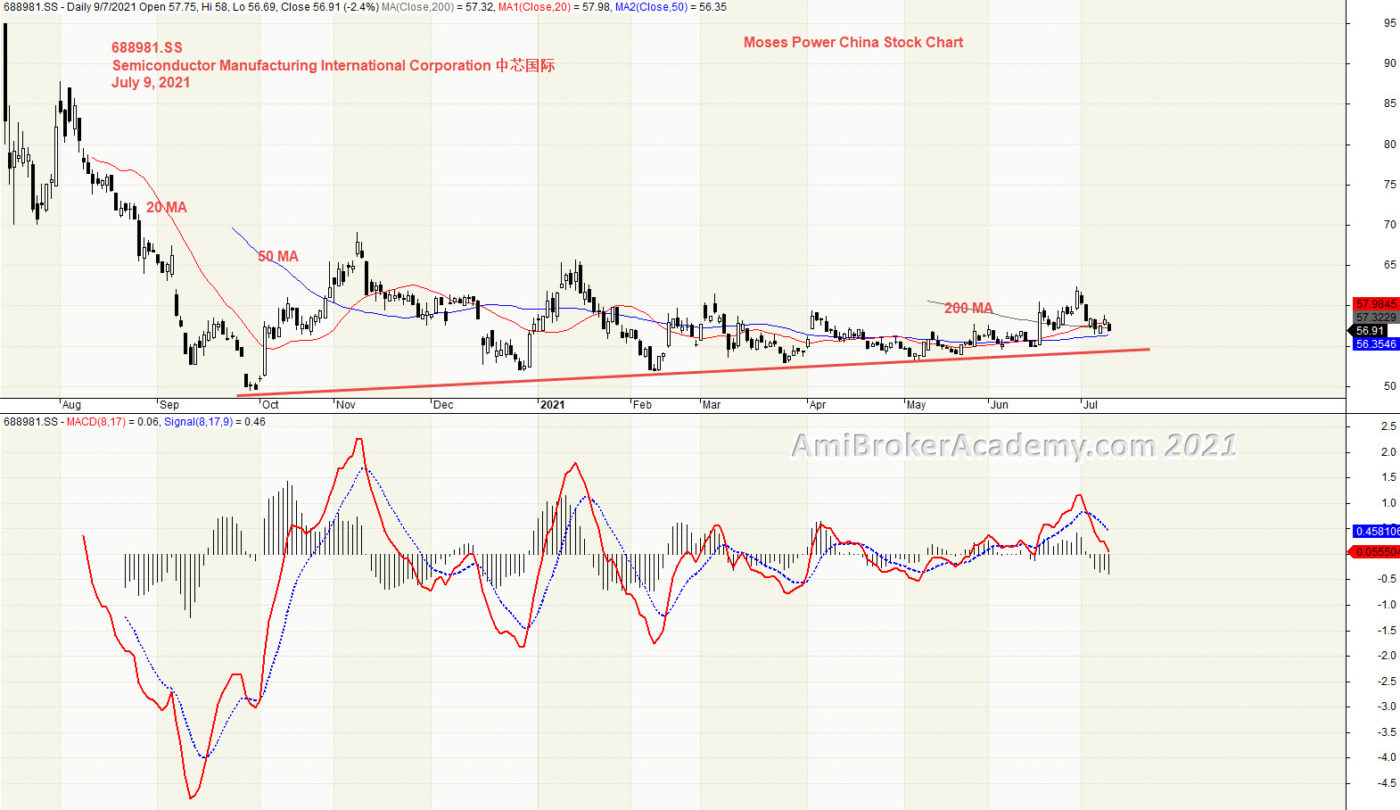
6) Semiconductor Manufacturing International Corporation SMIC and MACD
We see price action after deep down, price action slowly return to high. See chart.
Don’t take MACD or MACD-H Divergence lightly. Don’t play play.
20210709 0981 Semiconductor Manufacturing International Corporation SMIC and MACD
7) Semiconductor Manufacturing International Corporation SMIC and Hang Seng Index Correlation
Before 2021, the price action has no correlation, but for 2021, the price has a slight similarity, moving south about a similar pace. See chart.
20210709 0981 Semiconductor Manufacturing International Corporation SMIC and Hang Seng Index Correlation
Moses Power Charting
Official AmiBrokerAcademy.com Charting
Disclaimer
The above result is for illustration purpose. It is not meant to be used for buy or sell decision. We do not recommend any particular stocks. If particular stocks of such are mentioned, they are meant as demonstration of Amibroker as a powerful charting software and MACD. Amibroker can program to scan the stocks for buy and sell signals.
These are script generated signals. Not all scan results are shown here. The MACD signal should use with price action. Users must understand what MACD and price action are all about before using them. If necessary you should attend a course to learn more on Technical Analysis (TA) and Moving Average Convergence Divergence, MACD.
Once again, the website does not guarantee any results or investment return based on the information and instruction you have read here. It should be used as learning aids only and if you decide to trade real money, all trading decision should be your own.
We learn from many past and present great traders. Kudo to these master.
Welcome to AmiBroker Academy dot com, amibrokeracademy.com.
We sometime bench mark stock price action for two stocks. The following example, we benchmark Foxconn Technology 富士康 and SMIC a China chip maker. Semiconductor Manufacturing International Corporation is a major chip maker in China. Besides that we use other tools such as 1) Ichimoku Cloud, 2) Support Resistance (using box), 3) River (moving average), 4) GMMA and Woodies CCI, 5) Bollinger Bands and Moving Averages, and 6) MACD to analyze chart. See our simple reading of price action. We read Cryptocurrencies price action chart too.
We translate price action chart into layman language. This will help you in understand the financial instrument you are trading. We believe picture worth a thousand words. So, sometimes we use less words. You can learn the price action interpretation too. Give it a tray. You may not have the same view points as us. Remember all analysis read price action chart differently. It is just like reading an essay, we will have different conclusion.
Trade well.
Trade what you see. Manage your risk.
1) Foxconn Technology Co 富士康 and Semiconductor Manufacturing International Corporation aka SMIC 中芯国际 Correlation
We study price action we see Foxconn Technology 富士康 stock price bounce up and pullback. We see SMIC 中芯国际stock after retrace back to low and continue gliding very close to the “floor’. But, at the last part slightly close higher.
Trade what you see.
SMIC has a lot of potential, as there is a rush in chips market worldwide. Besides that the shortage in China market since US trade war started way back in Donald Trump day. Foxconn is s long time player in the component market. Trade what you see.
Remember, we just read what the chart said. Have fun!
20210709 Foxconn Technology Co 富士康 and Semiconductor Manufacturing International Corporation SMIC 中芯国际 Correlation
Moses Power Charting
Official AmiBrokerAcademy.com Charting
Disclaimer
The above result is for illustration purpose. It is not meant to be used for buy or sell decision. We do not recommend any particular stocks. If particular stocks of such are mentioned, they are meant as demonstration of Amibroker as a powerful charting software and MACD. Amibroker can program to scan the stocks for buy and sell signals.
These are script generated signals. Not all scan results are shown here. The MACD signal should use with price action. Users must understand what MACD and price action are all about before using them. If necessary you should attend a course to learn more on Technical Analysis (TA) and Moving Average Convergence Divergence, MACD.
Once again, the website does not guarantee any results or investment return based on the information and instruction you have read here. It should be used as learning aids only and if you decide to trade real money, all trading decision should be your own.
We learn from many past and present great traders. Kudo to these master.
Welcome to AmiBroker Academy dot com, amibrokeracademy.com.
We will use 1) Ichimoku Cloud, 2) Support Resistance (using box), 3) River (moving average), 4) GMMA and Woodies CCI, 5) Bollinger Bands and Moving Averages, and 6) MACD to analyze price action. We also analyze crypto currency price action. See our posting for Bitcoin and other popular cryptocurries.
What we do is to translate price action chart into layman language for you to understand, ie Picture worth a thousand words. You can learn this too. All analysis read the price action chart differently. It is just like an essay, all reader will have different conclusion.
Trade well.
1) 2354.TW | Foxconn Technology Co Ltd 富士康 and Ichimoku Cloud
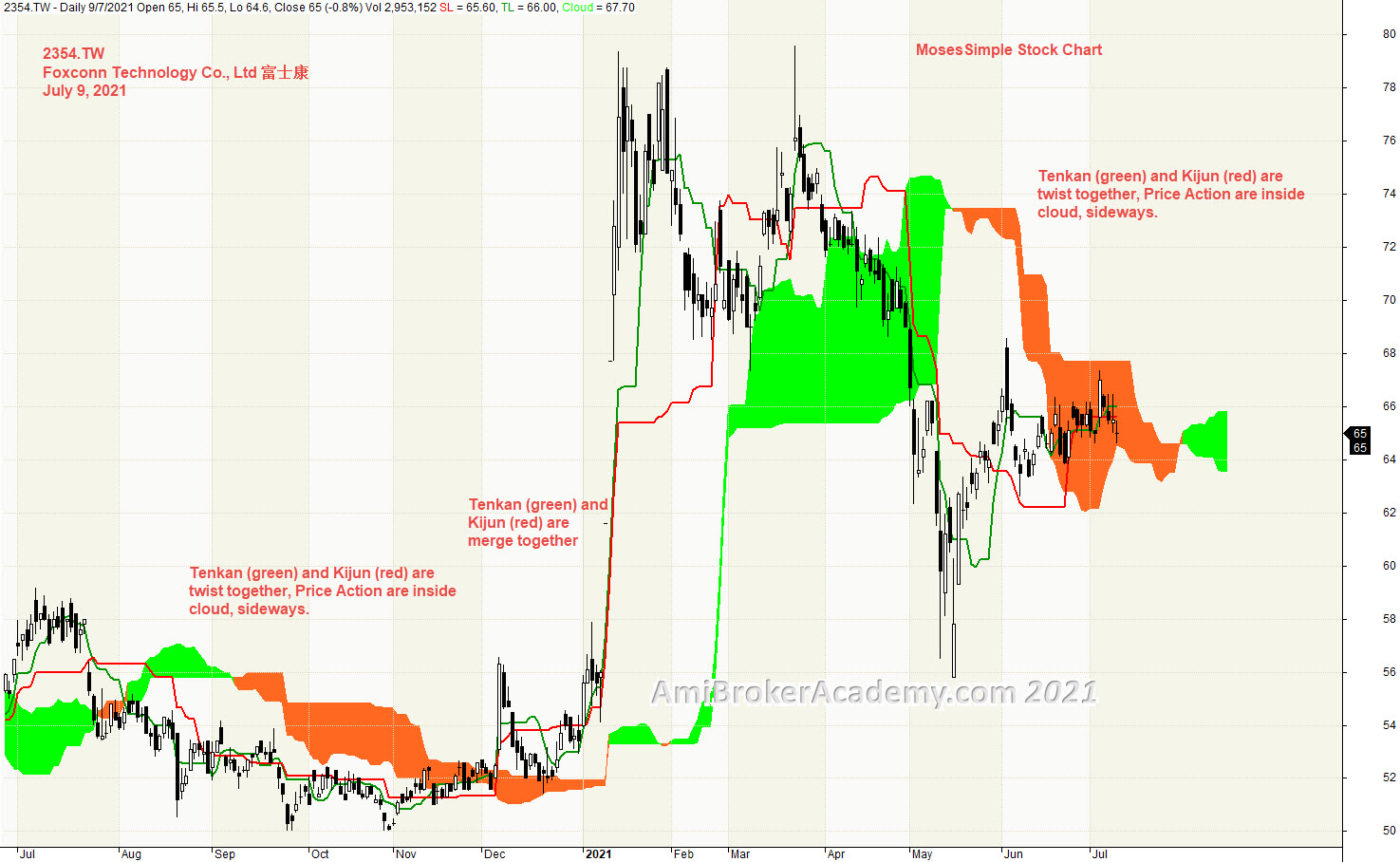
Ichimoku Cloud is a trend following strategy tool. We see Tenkan Sen and Kijun Sen from twist to trending up from January this year. But this do not last very long, after March, the price action begin to fail. Tenkan cross below Kijun and and twist. Price Action is now stay within clound
Ichimoku Cloud is a multi-dimensional indicator designed to offer support and resistance levels, trending, and entry and exit points. Besides that, Ichimoku is an indicator that gauges future price momentum and determine futures areas of support and resistance. Price Action seems to stay inside the cloud, sideways.
Trade what you see. See a potential support.
Manage risk is a key in trading.
Moses Free Charting
20210709 Foxconn Technology Co Ltd 富士康 and Ichimoku Cloud
2) Foxconn Technology Co Ltd 富士康 and Support Resistance
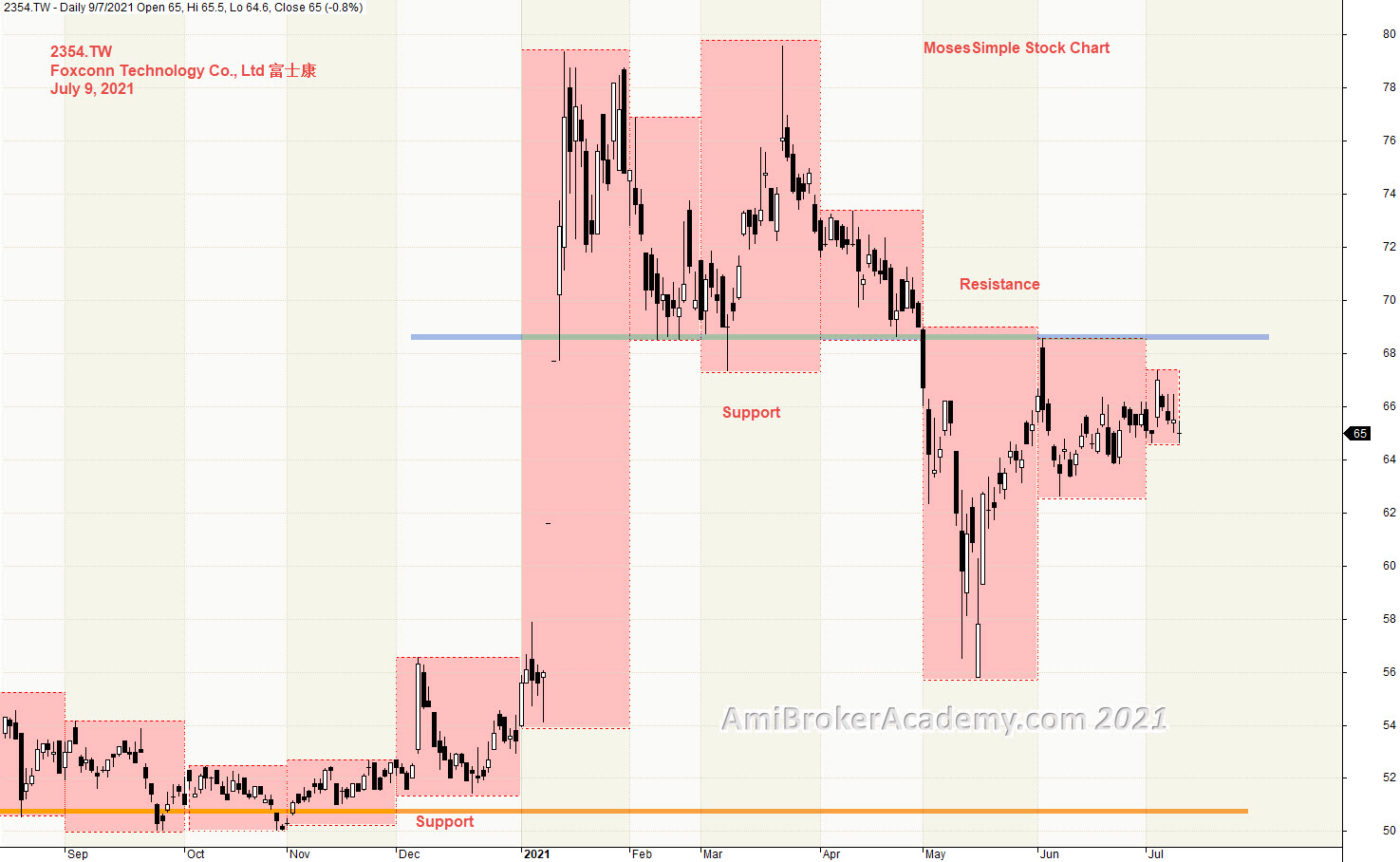
Price Action goes from low to high. You can see price action goes from bottom in last December to top in January. Price Action retest the same high a few times. Price Action breakout below support.
We use box to box month high low to find a key level. See chart. We have plotted two strong levels. We also find that January is the most volatile month, see the box size.
Trade what you see. Manage your risk.
20210709 Foxconn Technology Co Ltd 富士康 and Support Resistance
3) Foxconn Technology Co Ltd 富士康 and River
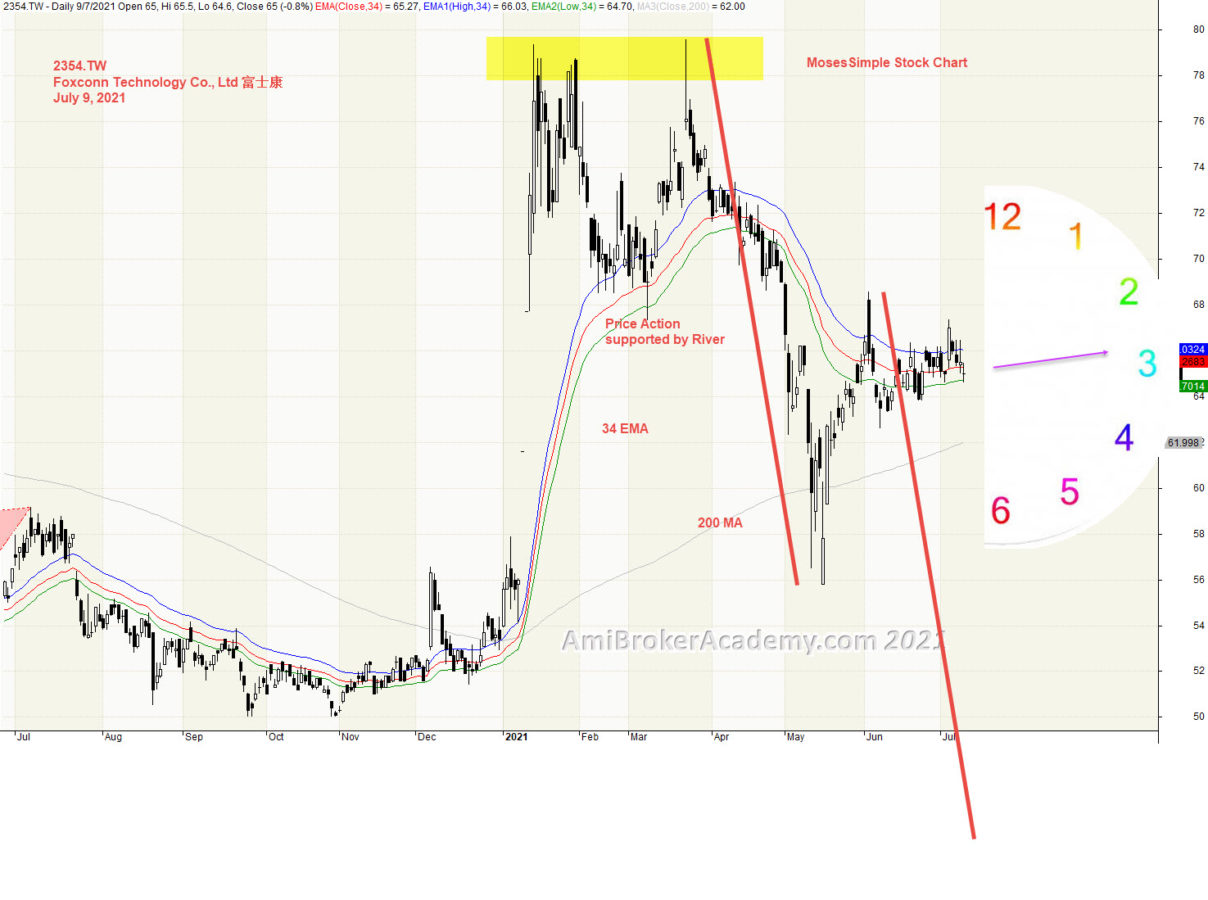
Moving Average is a great visual tool. Raghee uses high, low and close 34 EMA to form a band to determine the wave direction. Price action goes from below 34 EMA to above River, bull trend? Price Action fail and go south and test the resistance turns support.
Overall bull trend still remain, as 200 MA continues to slop up. Trade with eyes open.
Manage your risk.
20210709 Foxconn Technology Co Ltd 富士康 and River
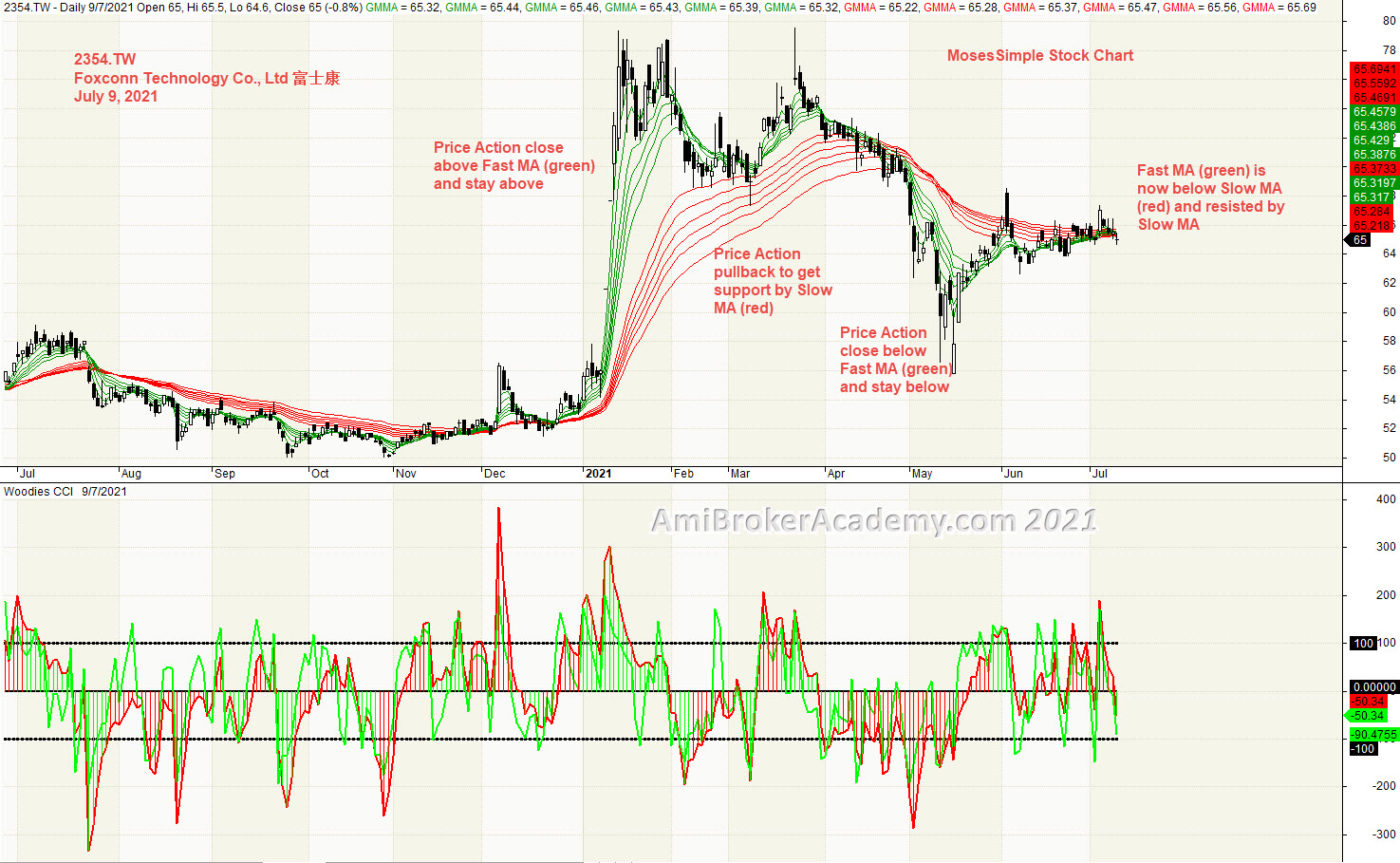
4) Foxconn Technology Co Ltd 富士康 and GMMA and Woodies CCI
Price Action and Fast MA (green) goes from under Slow MA (red) to above and below again. After February the price action and Fast MA (green) are slopping down. Finally, Fast MA are like crossing Slow MA, Dead Cross. Golden Cross is in progress.
Trade with eyes open.
20210709 Foxconn Technology Co Ltd 富士康 and GMMA and Woodies CCI
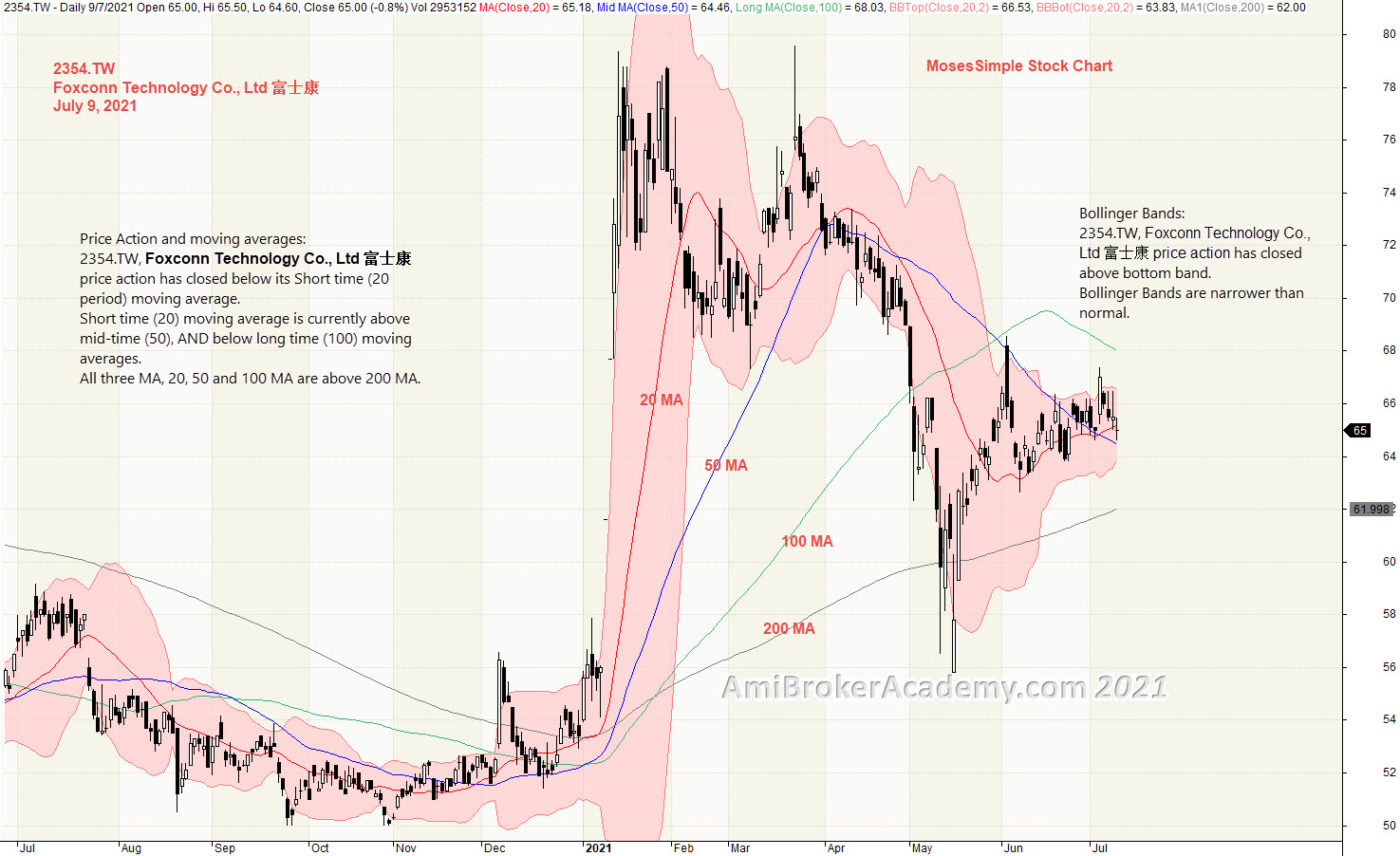
5) Foxconn Technology Co Ltd 富士康 and Bollinger Bands and Moving Averages
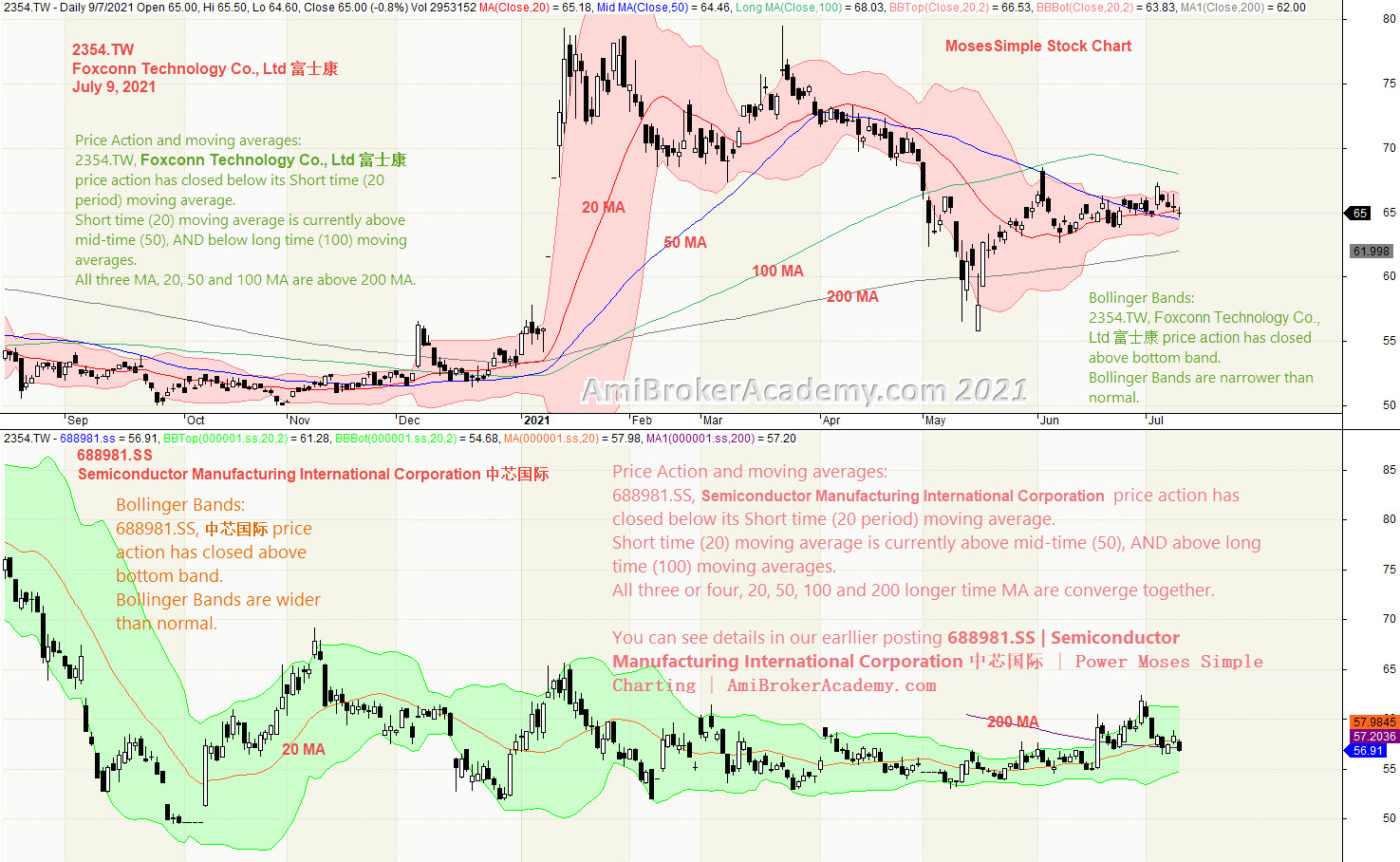
Price Action and moving averages: 2354.TW, Foxconn Technology Co., Ltd 富士康price action has closed below its Short time (20 period) moving average. Short time (20) moving average is currently above mid-time (50), AND below long time (100) moving averages. All three MA, 20, 50 and 100 MA are above 200 MA.
Bollinger Bands: 2354.TW, Foxconn Technology Co., Ltd 富士康 price action has closed above bottom band. Bollinger Bands are narrower than normal.
You may also sport a few ABCD patterns. See chart.
Manage your risk.
20210709 Foxconn Technology Co Ltd 富士康 and Bollinger Bands and Moving Averages
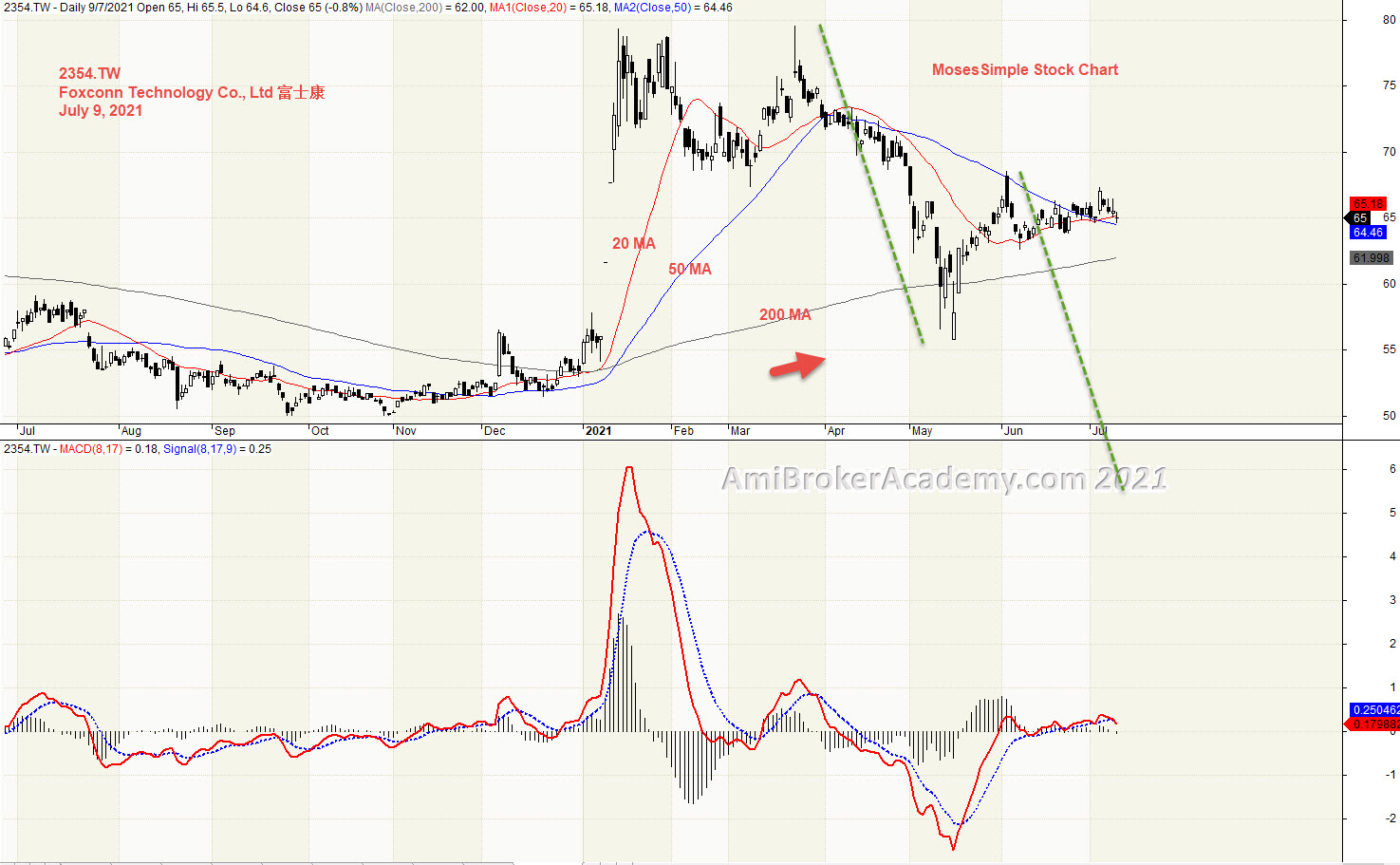
6) Foxconn Technology Co Ltd 富士康 and MACD
We see price action continues to go lower to high. 200 MA slopping up.
Don’t take MACD or MACD-H Divergence lightly. Don’t play play.
20210709 Foxconn Technology Co Ltd 富士康 and MACD
Moses Power Charting
Official AmiBrokerAcademy.com Charting
Disclaimer
The above result is for illustration purpose. It is not meant to be used for buy or sell decision. We do not recommend any particular stocks. If particular stocks of such are mentioned, they are meant as demonstration of Amibroker as a powerful charting software and MACD. Amibroker can program to scan the stocks for buy and sell signals.
These are script generated signals. Not all scan results are shown here. The MACD signal should use with price action. Users must understand what MACD and price action are all about before using them. If necessary you should attend a course to learn more on Technical Analysis (TA) and Moving Average Convergence Divergence, MACD.
Once again, the website does not guarantee any results or investment return based on the information and instruction you have read here. It should be used as learning aids only and if you decide to trade real money, all trading decision should be your own.
We learn from many past and present great traders. Kudo to these master.
Welcome to AmiBroker Academy dot com, amibrokeracademy.com.
We use such as 1) Ichimoku Cloud, 2) Support Resistance (using box), 3) River (moving average), 4) GMMA and Woodies CCI, 5) Bollinger Bands and Moving Averages, and 6) MACD to analyze price action. We also analyze crypto currency price action. See our posting for Bitcoin and other popular cryptocurries.
Our job here is to translate price action chart into layman language for you to understand, ie Picture worth a thousand words. You can learn this too. All analysis read the price action chart differently. It is just like an essay, all reader will have different conclusion.
Trade well.
1) 0981.HK | Semiconductor Manufacturing International Corporation SMIC and Ichimoku Cloud
Ichimoku Cloud is a trend following strategy tool. We see Tenkan Sen trending up to the peak and then trend down from last July to November. Finally Tenkan and Kijun are twisted together. Price Action goes sideways.
Ichimoku Cloud is a multi-dimensional indicator designed to offer support and resistance levels, trending, and entry and exit points. Besides that, Ichimoku is an indicator that gauges future price momentum and determine futures areas of support and resistance. Price Action is sink inside the cloud.
Trade what you see. See a potential support.
Manage risk is a key in trading.
Moses Free Charting
20210709 0981 Semiconductor Manufacturing International Corporation SMIC and Ichimoku Cloud
2) 688981.SS | Semiconductor Manufacturing International Corporation 中芯国际 and Support Resistance
SMIC is also listed in China, Shanghai Stock Exchange, as 688981.SS. Price Action was slopping down and down from July last year. Compare the two chart, the above and below, you can see a lot of similarity.
Trade what you see. Manage your risk.
July 9, 2021 Semiconductor Manufacturing International Corporation SMIC and Ichimoku Cloud
Moses Power Charting
Official AmiBrokerAcademy.com Charting
Disclaimer
The above result is for illustration purpose. It is not meant to be used for buy or sell decision. We do not recommend any particular stocks. If particular stocks of such are mentioned, they are meant as demonstration of Amibroker as a powerful charting software and MACD. Amibroker can program to scan the stocks for buy and sell signals.
These are script generated signals. Not all scan results are shown here. The MACD signal should use with price action. Users must understand what MACD and price action are all about before using them. If necessary you should attend a course to learn more on Technical Analysis (TA) and Moving Average Convergence Divergence, MACD.
Once again, the website does not guarantee any results or investment return based on the information and instruction you have read here. It should be used as learning aids only and if you decide to trade real money, all trading decision should be your own.
We learn from many past and present great traders. Kudo to these master.
Welcome to AmiBroker Academy. Thanks for visiting the site.
Besides we perform stock scan regularly. We also do stock analysis. What we do is translate the price action chart into simple layman language. We also use tools, such as indicators, Ichimoku cloud, MACD, River, Moving Averages, Boxes, GMMA and Woodies CCI. We do cryptocurrencies charting too. Have fun!
Moving Average Convergence Divergence, MACD Screener
MACD was developed by Gerald Appel in the late seventies.
MACD stands for Moving Average Convergence
Divergence, the MACD line (red line or called fast line) and MACD signal line
(blue line, or called slow line).
MACD
Bullish Signal Line Cross: MACD bullish signal when red line crosses above
the blue line or MACD line crosses above zero line.
MACD
Bearish Signal Line Cross: MACD bearish signal when blue line crosses below
red line or MACD line crosses below zero line.
MACD Scan
These are stocks picked for today.
Some of June 28 to July 2, 2021 AmiBroker AFL Script Generated Five-day China Stock MACD Signals
Ticker
Company
Date
Trend
Close
Vol.(K)
Screening Result
600753.SS
Fujian Oriental Silver Star Investment Co., Ltd
2/7/2021
Bullish
44.87
16727
MACD Cross-Up Signal
000001.SZ
Ping An Bank Co., Ltd
1/7/2021
Bearish
23.2
66483
MACD Cross-Down Signal
000001.SZ
Ping An Bank Co., Ltd
2/7/2021
Bearish
21.81
107068
MACD Cross-Down Signal
002230.SZ
iFLYTEK Co.,Ltd
29/6/2021
Bearish
63.46
26577
MACD Cross-Down Signal
002230.SZ
iFLYTEK Co.,Ltd
30/6/2021
Bearish
67.58
48929
MACD Cross-Down Signal
002230.SZ
iFLYTEK Co.,Ltd
2/7/2021
Bearish
62.97
32768
MACD Cross-Down Signal
0291.HK
China Resources Beer (Holdings) Company Limited
29/6/2021
Bearish
70.6
7375
MACD Cross-Down ZeroLine
0291.HK
China Resources Beer (Holdings) Company Limited
2/7/2021
Bearish
67.15
13593
MACD Cross-Down ZeroLine
0763.HK
ZTE Corporation
30/6/2021
Bearish
24.25
25811
MACD-H -ve Divergence
0763.HK
ZTE Corporation
2/7/2021
Bearish
23.5
9929
MACD-H -ve Divergence
0941.HK
China Mobile Limited
28/6/2021
Bearish
49.6
24241
MACD Cross-Down ZeroLine
0941.HK
China Mobile Limited
2/7/2021
Bearish
47.85
31572
MACD Cross-Down ZeroLine
0981.HK
Semiconductor Manufacturing International Corporation
30/6/2021
Bearish
23.9
88447
MACD Cross-Down Signal
0981.HK
Semiconductor Manufacturing International Corporation
2/7/2021
Bearish
23.25
58636
MACD Cross-Down Signal
1910.HK
Samsonite International S.A.
2/7/2021
Bearish
15.74
5545
MACD Cross-Down ZeroLine
2020.HK
ANTA Sports Products Limited
2/7/2021
Bearish
175.9
9737
MACD Cross-Down Signal
3690.HK
Meituan 美团
29/6/2021
Bearish
323.8
15304
MACD Cross-Down Signal
3690.HK
Meituan 美团
2/7/2021
Bearish
304
23363
MACD Cross-Down Signal
600893.SS
Aecc Aviation Power Co.,Ltd
2/7/2021
Bearish
46.36
57068
MACD Cross-Down ZeroLine
601788.SS
Everbright Securities Company Limited
29/6/2021
Bearish
17.62
84357
MACD Cross-Down ZeroLine
601788.SS
Everbright Securities Company Limited
1/7/2021
Bearish
16.64
90972
MACD Cross-Down ZeroLine
601788.SS
Everbright Securities Company Limited
2/7/2021
Bearish
15.82
71910
MACD Cross-Down ZeroLine
20210628 to 0702 China Stock Five-day MACD Signals
Moses Stock Scan
Free Power China Stock MACD Scan Signals AmiBroker Academy.com
Disclaimer: The above result is for illustration purpose. It is not meant to be used for buy or sell decision. We do not recommend any particular stocks on our website. If particular stocks of such are mentioned, they are meant as illustration or demonstration of Amibroker as a powerful charting software or MACD scanner. Amibroker can program to scan the stocks that have MACD buy or sell signals.
These are script generated signals. Not all scan results are shown here. The MACD signal should use with price action and confirmation. Users must understand what MACD and price action are all about before using them. If necessary you should attend a course to learn more about Technical Analysis (TA) and Moving Average Convergence Divergence, MACD.
Once again, the website does not guarantee any results or investment return based on the information and instruction you have read here. It should be used as learning aids only and if you decide to trade real money, all trading decision should be your own, and you should take your own responsibility.
Welcome to AmiBroker Academy dot com, amibrokeracademy.com.
We use such as 1) Ichimoku Cloud, 2) Support Resistance (using box), 3) River (moving average), 4) GMMA and Woodies CCI, 5) Bollinger Bands and Moving Averages, and 6) MACD to analyze price action. We also analyze crypto currency price action. See our posting for Bitcoin and other popular cryptocurries.
Our job here is to translate price action chart into layman language for you to understand, ie Picture worth a thousand words. You can learn this too. All analysis read the price action chart differently. It is just like an essay, all reader will have different conclusion.
Trade well.
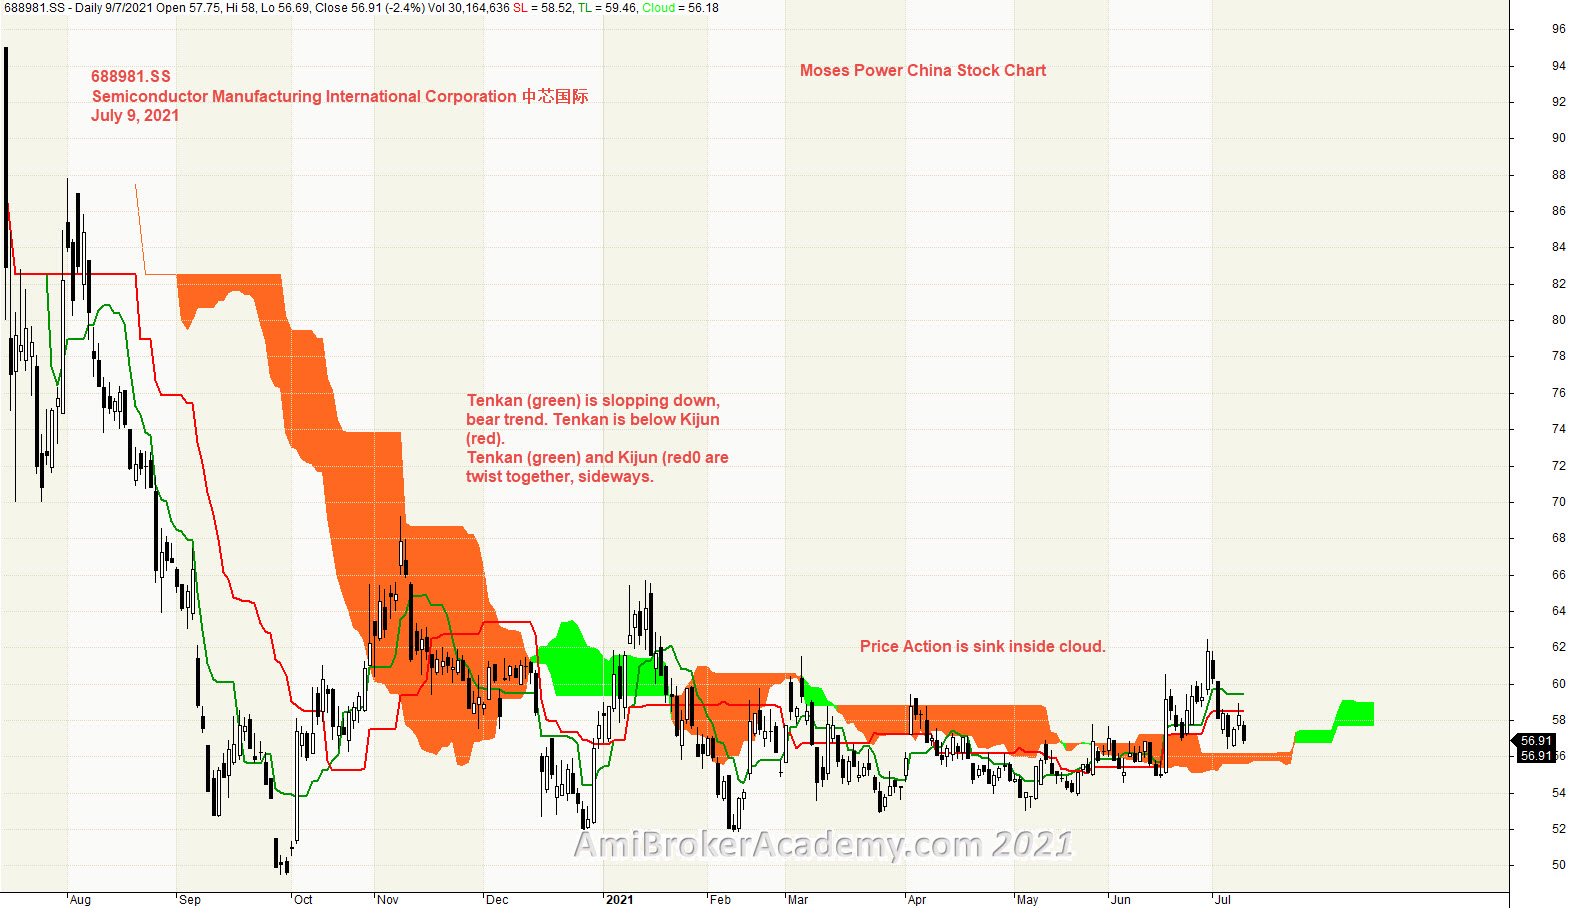
1) 688981.SS | Semiconductor Manufacturing International Corporation 中芯国际 and Ichimoku Cloud
Ichimoku Cloud is a trend following strategy tool. We see Tenkan Sen trending down from last July to November. In between, Tenkan and Kijun are twisted together. Price Action goes sideways.
Ichimoku Cloud is a multi-dimensional indicator designed to offer support and resistance levels, trending, and entry and exit points. Besides that, Ichimoku is an indicator that gauges future price momentum and determine futures areas of support and resistance. Price Action is sink inside the cloud.
Trade what you see. See a potential support.
Manage risk is a key in trading.
Moses Free Charting
20210709 Semiconductor Manufacturing International Corporation 中芯国际 and Ichimoku Cloud
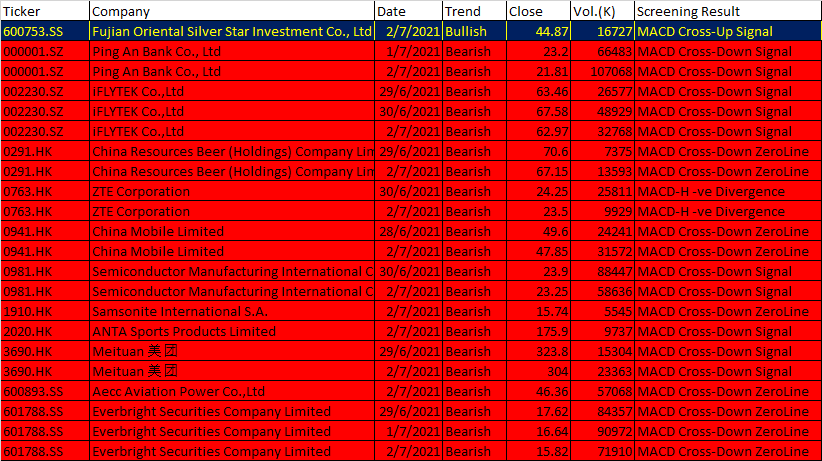
2) Semiconductor Manufacturing International Corporation 中芯国际 and Support Resistance
Price Action goes from high to low. You can see price action goes from top in last July to bottom in September. Next the price action is moving sideways. See chart.
We use box to box month high low to find a key level. See chart. We have plotted a strong level. Price Action is on Support. Can the support continue to hold the price action? Will see.
Trade what you see. Manage your risk.
20210709 Semiconductor Manufacturing International Corporation and Support Resistance
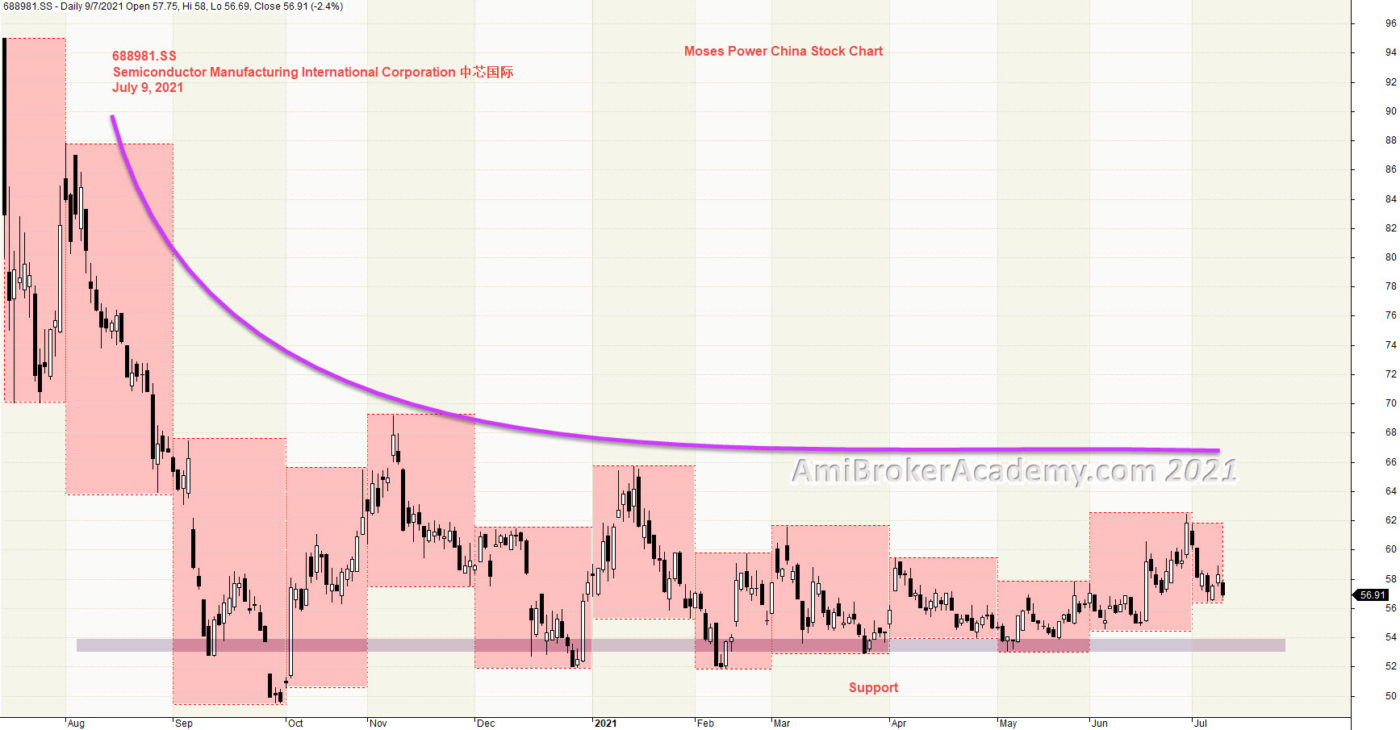
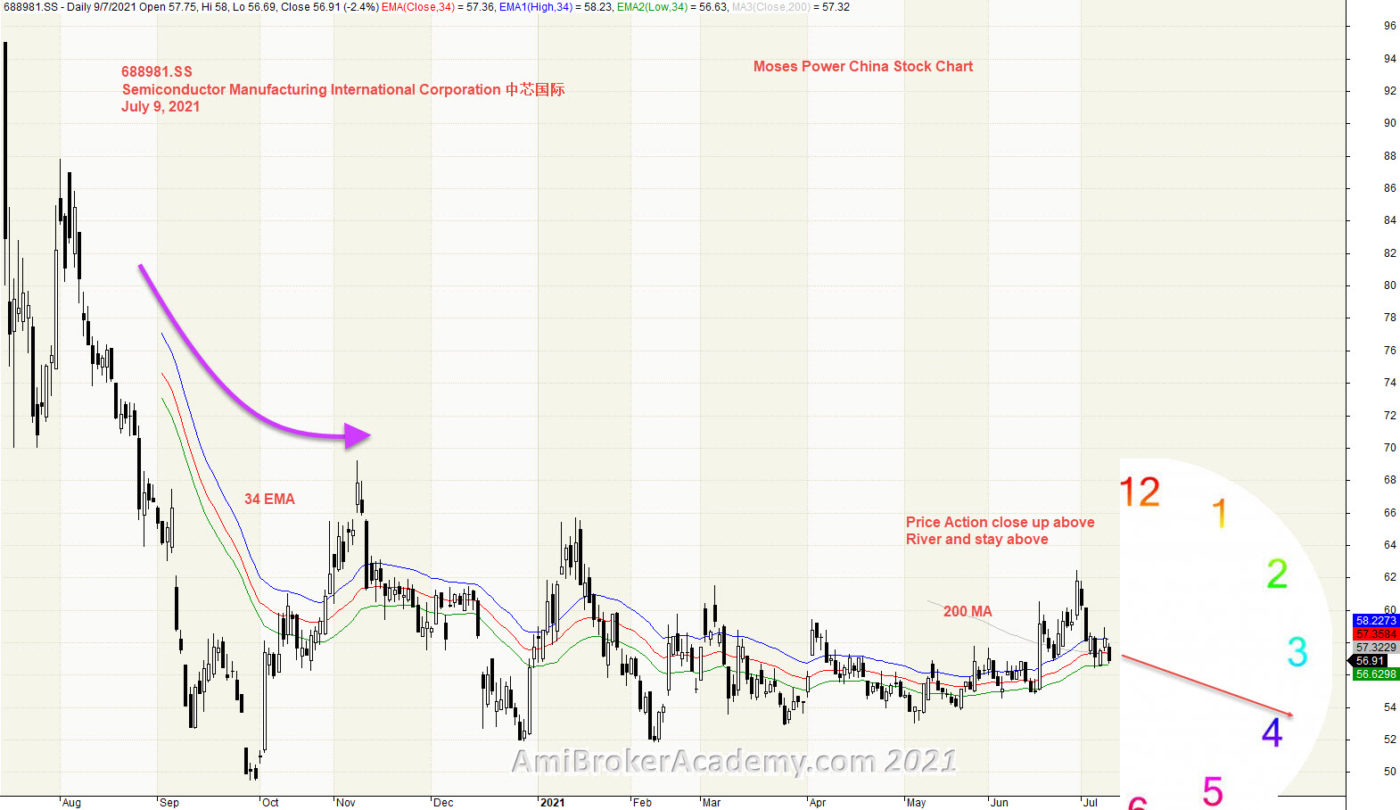
3) Semiconductor Manufacturing International Corporation and River
Moving Average is a great visual tool. Raghee uses high, low and close 34 EMA to form a band to determine the wave direction. Price action goes from below 34 EMA to above River, price action slowly reverse? Trade what you see.
Overall price action below 200 MA until last two months and 200 MA and 34 EMA are converging.
Manage your risk.
20210709 Semiconductor Manufacturing International Corporation and River
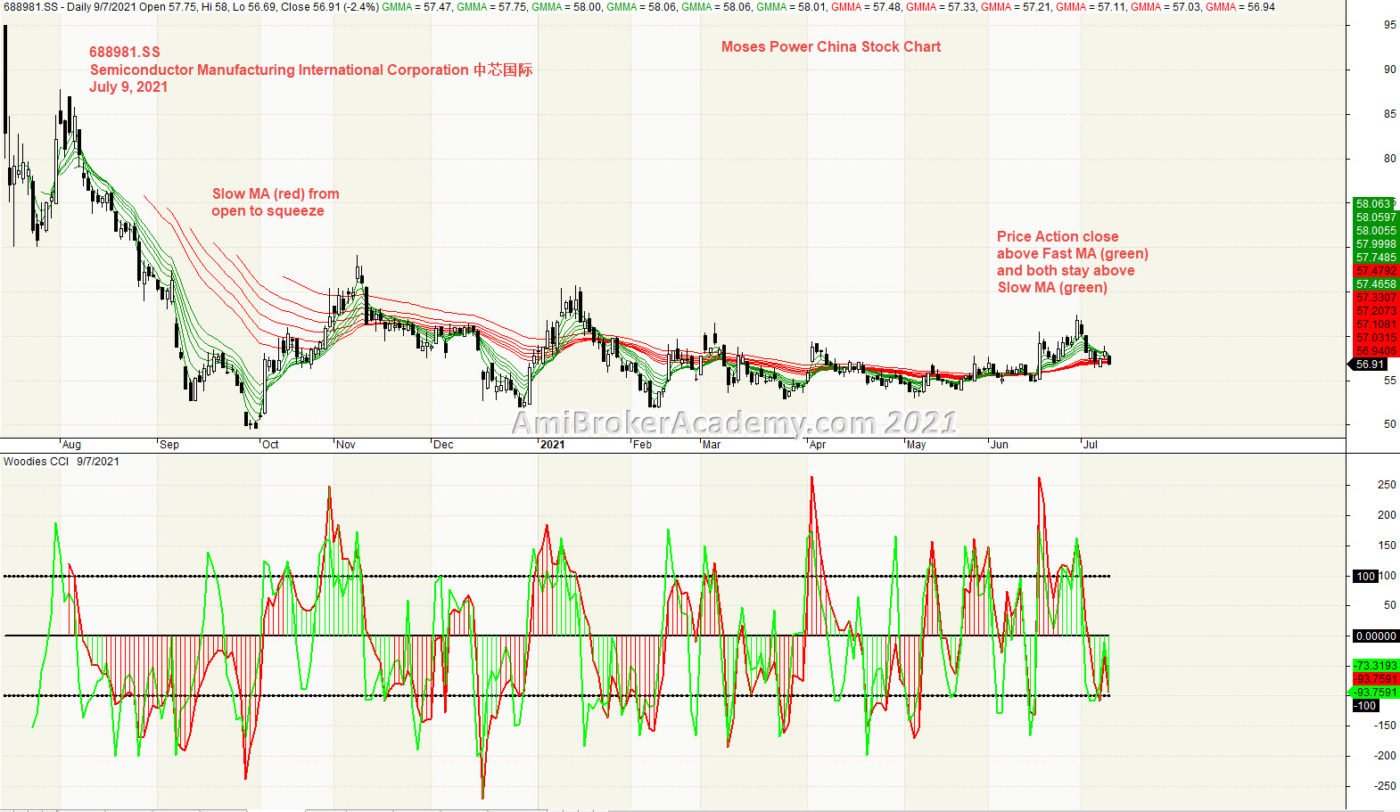
4) Semiconductor Manufacturing International Corporation 中芯国际 and GMMA and Woodies CCI
Slow MA (red) from open to squeeze, Slow MA (red) is above Fast MA (green). After January the price action and Fast MA (green) are zigzaging with Slow MA (red). Finally, Fast MA is above Slow MA after Golden Cross. Fast MA is pullback to above to cross below Slow MA (red), Is Dead Cross is in progress? Will see.
20210709 Semiconductor Manufacturing International Corporation 中芯国际 and GMMA and Woodies CCI
5) Semiconductor Manufacturing International Corporation 中芯国际 and Bollinger Bands and Moving Averages
Price Action and moving averages: 688981.SS, Semiconductor Manufacturing International Corporation price action has closed below its Short time (20 period) moving average. Short time (20) moving average is currently above mid-time (50), AND above long time (100) moving averages. All three or four, 20, 50, 100 and 200 longer time MA are converge together.
Bollinger Bands: 688981.SS, 中芯国际 price action has closed above bottom band. Bollinger Bands are wider than normal.
Manage your risk.
20210709 Semiconductor Manufacturing International Corporation 中芯国际 and Bollinger Bands and Moving Averages
6) Semiconductor Manufacturing International Corporation and MACD
We see price action begin to go higher. 200 MA slopping down still.
20210709 Semiconductor Manufacturing International Corporation and MACD
20210709 SMIC 中芯国际 and Shanghai Stock Exchange Composite Index Correlation
Moses Power Charting
Official AmiBrokerAcademy.com Charting
Disclaimer
The above result is for illustration purpose. It is not meant to be used for buy or sell decision. We do not recommend any particular stocks. If particular stocks of such are mentioned, they are meant as demonstration of Amibroker as a powerful charting software and MACD. Amibroker can program to scan the stocks for buy and sell signals.
These are script generated signals. Not all scan results are shown here. The MACD signal should use with price action. Users must understand what MACD and price action are all about before using them. If necessary you should attend a course to learn more on Technical Analysis (TA) and Moving Average Convergence Divergence, MACD.
Once again, the website does not guarantee any results or investment return based on the information and instruction you have read here. It should be used as learning aids only and if you decide to trade real money, all trading decision should be your own.
We learn from many past and present great traders. Kudo to these master.
Welcome to AmiBroker Academy dot com, amibrokeracademy.com.
We sometime bench mark stock price action with index such as Shanghai Stock Index. The following example, we benchmark SMIC a China chip maker and Shanghai Stock Exchange Composite Index. Semicon Manufacturing International Corporation is a major chip maker in China. Besides that we use other tools such as 1) Ichimoku Cloud, 2) Support Resistance (using box), 3) River (moving average), 4) GMMA and Woodies CCI, 5) Bollinger Bands and Moving Averages, and 6) MACD to analyze chart. See our simple reading of price action. We read Cryptocurrencies price action chart too.
We translate price action chart into layman language. This will help you in understand the financial instrument you are trading. We believe picture worth a thousand words. So, sometimes we use less words. You can learn the price action interpretation too. Give it a tray. You may not have the same view points as us. Remember all analysis read price action chart differently. It is just like reading an essay, we will have different conclusion.
Trade well.
Trade what you see. Manage your risk.
1) Semiconductor Manufacturing International Corporation aka SMIC 中芯国际 and Shanghai Stock Exchange Composite Index Correlation
We study price action, we see SMIC stock continue gliding very close to the “floor’, at the last part slightly close higher, but Shanghai Stock Exchange Composite Index was on the high and only pulling back from February this year.
Trade what you see.
SMIC has a lot of potential, as there is a rush in chips market worldwide. Besides that the shortage in China market since US trade war started way back in Donald Trump day.
Remember, we just read what the chart said. Have fun!
20210709 SMIC 中芯国际 and Shanghai Stock Exchange Composite Index Correlation
Moses Power Charting
Official AmiBrokerAcademy.com Charting
Disclaimer
The above result is for illustration purpose. It is not meant to be used for buy or sell decision. We do not recommend any particular stocks. If particular stocks of such are mentioned, they are meant as demonstration of Amibroker as a powerful charting software and MACD. Amibroker can program to scan the stocks for buy and sell signals.
These are script generated signals. Not all scan results are shown here. The MACD signal should use with price action. Users must understand what MACD and price action are all about before using them. If necessary you should attend a course to learn more on Technical Analysis (TA) and Moving Average Convergence Divergence, MACD.
Once again, the website does not guarantee any results or investment return based on the information and instruction you have read here. It should be used as learning aids only and if you decide to trade real money, all trading decision should be your own.
We learn from many past and present great traders. Kudo to these master.