Welcome to AmiBroker Academy dot com, amibrokeracademy.com.
Secret Code
The analysis is not for everyone.
This is not a site for those whom just want to find buy or sell signal. Because we don’t provide you any buy or sell information, we only provide you the thought you can decide and take responsibility.
Trading is all about observation, reading the price bar and not news. By the time you hear the news it is already old and become history. Why? It is very simple, remember where the news come from? It has first someone release to the news agency like CNBC, and so on. Next, someone has to read the news to you after some research and summarize. This will be few hours later, by then the price action has already done.
As for price bar, it is what the market supply and remand. When market feel that is over price, the price will drop. All this reflected on the price bar almost instantly.
Next is how to read our price bar plus using some tools, such as MACD.
Here, we simply translate price action chart into layman language. This will help you in understand the financial instrument you are trading. We believe picture worth a thousand words. So, sometimes we use less words. You can learn the price action interpretation too. Give it a tray. You may not have the same view points as us. Remember all analysis read price action chart differently. It is just like reading an essay, we will have different conclusion.
Trade well.
Trade what you see. Manage your risk.
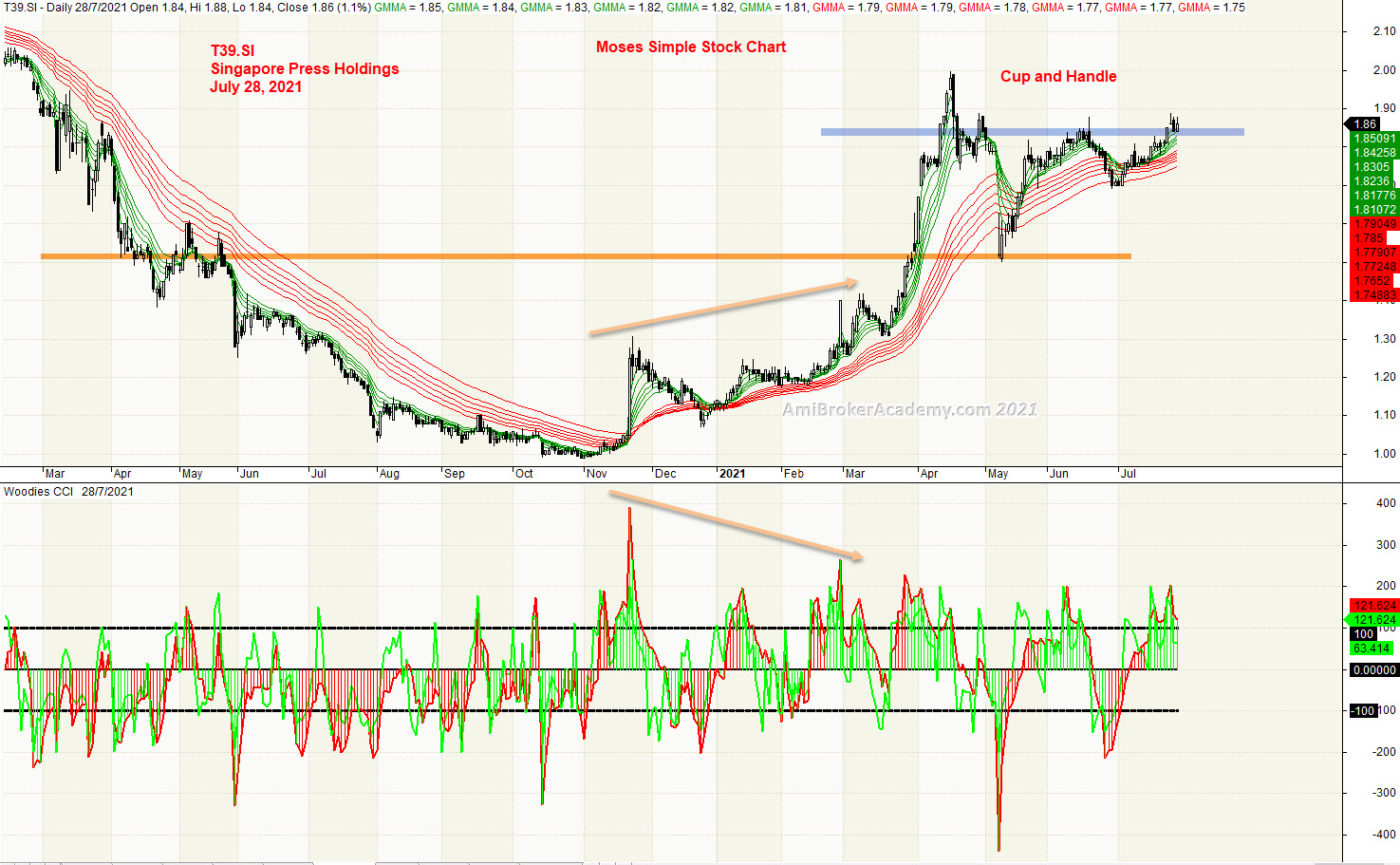
1) Singapore Press Holdings and GMMA and Woodies CCI
Price Action goes from top to bottom and top again. If you stand further, you can not miss the cup and handle pattern. From another view, it is a bullish pattern. Trade with care.
Moving Average is a great visual tool. Daryl Guppy, an Australian financial columnist developed a trading tactics using moving average. The aims is to aniticipate a potential breakout.
When both Fast (green) and Slow (red) MA squeeze and come together, look out for a price action change.
Overall, the price action shows a cup and handle chart pattern.
Manage your risk.
20210728 Singapore Press Holdings and GMMA and Woodies CCI
Moses Power Charting
Official AmiBrokerAcademy.com Charting
Disclaimer
The above result is for illustration purpose. It is not meant to be used for buy or sell decision. We do not recommend any particular stocks. If particular stocks of such are mentioned, they are meant as demonstration of Amibroker as a powerful charting software and MACD. Amibroker can program to scan the stocks for buy and sell signals.
These are script generated signals. Not all scan results are shown here. The MACD signal should use with price action. Users must understand what MACD and price action are all about before using them. If necessary you should attend a course to learn more on Technical Analysis (TA) and Moving Average Convergence Divergence, MACD.
Once again, the website does not guarantee any results or investment return based on the information and instruction you have read here. It should be used as learning aids only and if you decide to trade real money, all trading decision should be your own.
We learn from many past and present great traders. Kudo to these master.
Welcome to AmiBroker Academy. Thanks for visiting the site.
Moving Average Convergence Divergence, MACD Screener
MACD was developed by Gerald Appel in the late seventies.
MACD stands for Moving Average Convergence
Divergence, the MACD line (red line or called fast line) and MACD signal line
(blue line, or called slow line).
MACD
Bullish Signal Line Cross: MACD bullish signal when red line crosses above
the blue line or MACD line crosses above zero line.
MACD
Bearish Signal Line Cross: MACD bearish signal when blue line crosses below
red line or MACD line crosses below zero line.
MACD Scan
These are stocks picked for today.
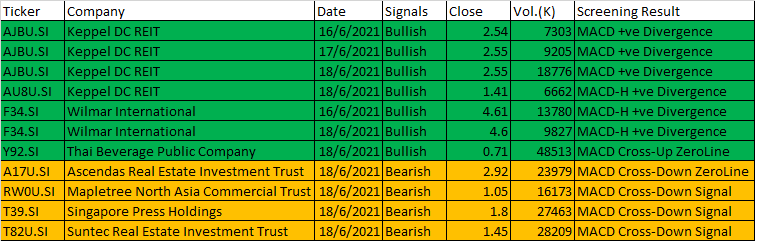
Some of 14 to 18 June, 2021 AmiBroker AFL Script Generated Five-day Singapore Stock MACD Signals
Ticker
Company
Date
Signals
Close
Vol.(K)
Screening Result
AJBU.SI
Keppel DC REIT
16/6/2021
Bullish
2.54
7303
MACD +ve Divergence
AJBU.SI
Keppel DC REIT
17/6/2021
Bullish
2.55
9205
MACD +ve Divergence
AJBU.SI
Keppel DC REIT
18/6/2021
Bullish
2.55
18776
MACD +ve Divergence
AU8U.SI
Keppel DC REIT
18/6/2021
Bullish
1.41
6662
MACD-H +ve Divergence
F34.SI
Wilmar International
16/6/2021
Bullish
4.61
13780
MACD-H +ve Divergence
F34.SI
Wilmar International
18/6/2021
Bullish
4.6
9827
MACD-H +ve Divergence
Y92.SI
Thai Beverage Public Company
18/6/2021
Bullish
0.71
48513
MACD Cross-Up ZeroLine
A17U.SI
Ascendas Real Estate Investment Trust
18/6/2021
Bearish
2.92
23979
MACD Cross-Down ZeroLine
RW0U.SI
Mapletree North Asia Commercial Trust
18/6/2021
Bearish
1.05
16173
MACD Cross-Down Signal
T39.SI
Singapore Press Holdings
18/6/2021
Bearish
1.8
27463
MACD Cross-Down Signal
T82U.SI
Suntec Real Estate Investment Trust
18/6/2021
Bearish
1.45
28209
MACD Cross-Down Signal
20210614 to 18 Singapore Stock Five-day MACD Signals
Moses Stock Scan
Power Free Singapore Stock MACD Scan Signals AmiBroker Academy.com
Disclaimer: The above result is for illustration purpose. It is not meant to be used for buy or sell decision. We do not recommend any particular stocks on our website. If particular stocks of such are mentioned, they are meant as illustration or demonstration of Amibroker as a powerful charting software or MACD scanner. Amibroker can program to scan the stocks that have MACD buy or sell signals.
These are script generated signals. Not all scan results are shown here. The MACD signal should use with price action and confirmation. Users must understand what MACD and price action are all about before using them. If necessary you should attend a course to learn more about Technical Analysis (TA) and Moving Average Convergence Divergence, MACD.
Once again, the website does not guarantee any results or investment return based on the information and instruction you have read here. It should be used as learning aids only and if you decide to trade real money, all trading decision should be your own, and you should take your own responsibility.
Welcome to AmiBroker Academy dot com, amibrokeracademy.com.
Secret Code
The analysis is not for everyone.
This is not a site for those whom just want to find buy or sell signal. Because we don’t provide you any buy or sell information, we only provide you the thought you can decide and take responsibility.
Trading is all about observation, reading the price bar and not news. By the time you hear the news it is already old and become history. Why? It is very simple, remember where the news come from? It has first someone release to the news agency like CNBC, and so on. Next, someone has to read the news to you after some research and summarize. This will be few hours later, by then the price action has already done.
As for price bar, it is what the market supply and remand. When market feel that is over price, the price will drop. All this reflected on the price bar almost instantly.
Next is how to read our price bar plus using some tools, such as MACD.
Here, we simply translate price action chart into layman language. This will help you in understand the financial instrument you are trading. We believe picture worth a thousand words. So, sometimes we use less words. You can learn the price action interpretation too. Give it a tray. You may not have the same view points as us. Remember all analysis read price action chart differently. It is just like reading an essay, we will have different conclusion.
Trade well.
Trade what you see. Manage your risk.
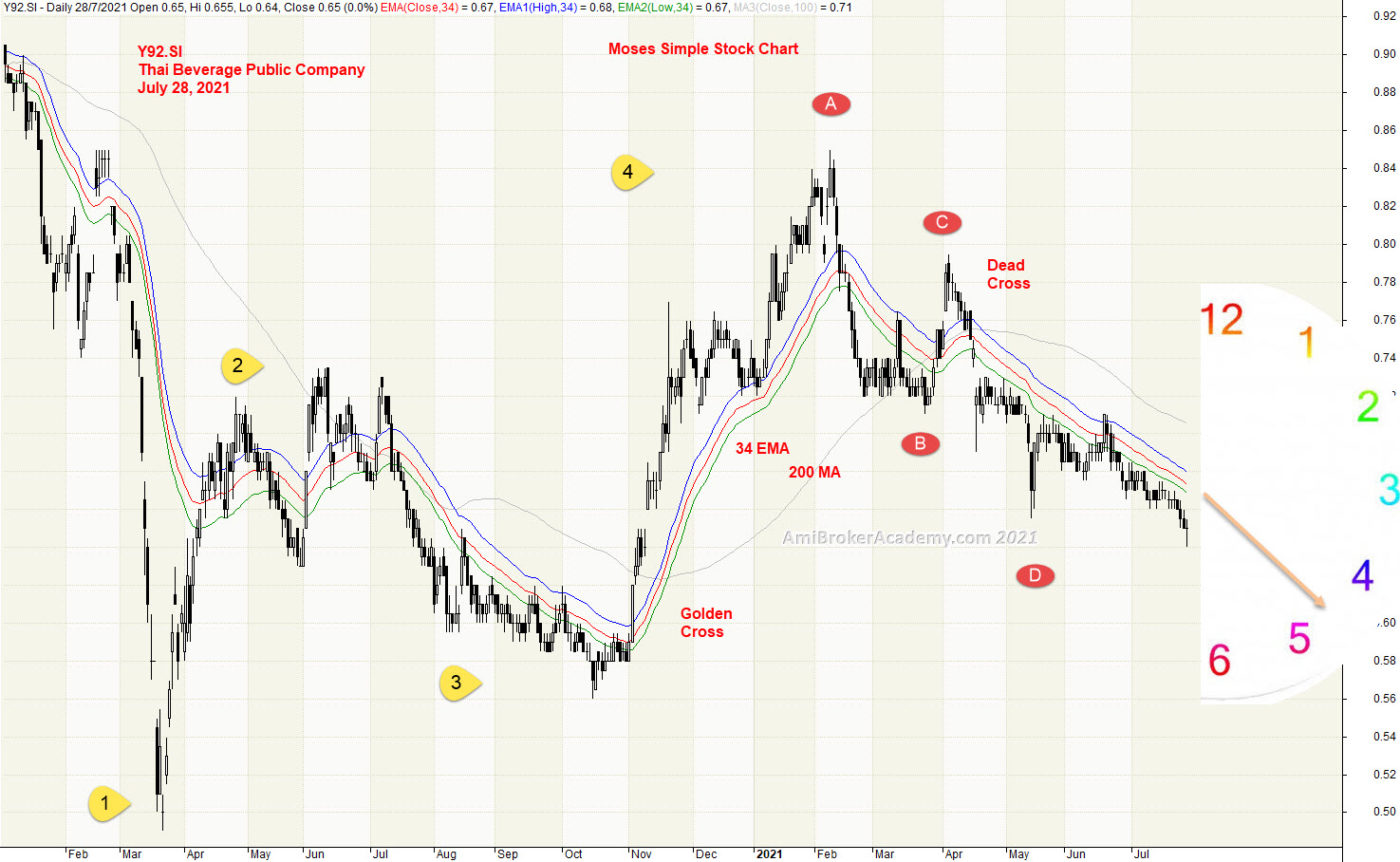
3) Thai Beverage Public Company and River
Price Action is pointing to between four and five o’clock direction, price action is bear bias. See chart, we see River is slopping down.
Moving Average is a great visual tool. Raghee uses high, low and close of 34 EMA to form a band, we called it River to determine the wave direction. Price action goes from below 34 EMA to above River and below again.
River is a great support resistance tool too. Catch the support to find the entry. Remember to reduce risk by buy support and take profit to sell resistance.
For H M Gartley’s fan, you probably spot ABCD patterns.
Manage your risk.
20210728 Thai Beverage Public Company and River
Moses Power Charting
Official AmiBrokerAcademy.com Charting
Disclaimer
The above result is for illustration purpose. It is not meant to be used for buy or sell decision. We do not recommend any particular stocks. If particular stocks of such are mentioned, they are meant as demonstration of Amibroker as a powerful charting software and MACD. Amibroker can program to scan the stocks for buy and sell signals.
These are script generated signals. Not all scan results are shown here. The MACD signal should use with price action. Users must understand what MACD and price action are all about before using them. If necessary you should attend a course to learn more on Technical Analysis (TA) and Moving Average Convergence Divergence, MACD.
Once again, the website does not guarantee any results or investment return based on the information and instruction you have read here. It should be used as learning aids only and if you decide to trade real money, all trading decision should be your own.
We learn from many past and present great traders. Kudo to these master.
Welcome to AmiBroker Academy. Thanks for visiting the site.
Moving Average Convergence Divergence, MACD Screener
MACD was developed by Gerald Appel in the late seventies.
MACD stands for Moving Average Convergence
Divergence, the MACD line (red line or called fast line) and MACD signal line
(blue line, or called slow line).
MACD
Bullish Signal Line Cross: MACD bullish signal when red line crosses above
the blue line or MACD line crosses above zero line.
MACD
Bearish Signal Line Cross: MACD bearish signal when blue line crosses below
red line or MACD line crosses below zero line.
MACD Scan
These are stocks picked for today.
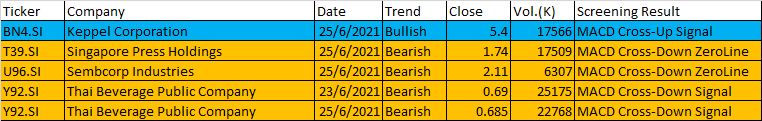
Some of 21 to 25 June, 2021 AmiBroker AFL Script Generated Five-day Singapore Stock MACD Signals
Ticker
Company
Date
Trend
Close
Vol.(K)
Screening Result
BN4.SI
Keppel Corporation
25/6/2021
Bullish
5.4
17566
MACD Cross-Up Signal
T39.SI
Singapore Press Holdings
25/6/2021
Bearish
1.74
17509
MACD Cross-Down ZeroLine
U96.SI
Sembcorp Industries
25/6/2021
Bearish
2.11
6307
MACD Cross-Down ZeroLine
Y92.SI
Thai Beverage Public Company
23/6/2021
Bearish
0.69
25175
MACD Cross-Down Signal
Y92.SI
Thai Beverage Public Company
25/6/2021
Bearish
0.685
22768
MACD Cross-Down Signal
20210621 to 25 Singapore Stock Five-day MACD Signals
Moses Stock Scan
Power Free Singapore Stock MACD Scan Signals AmiBroker Academy.com
Disclaimer: The above result is for illustration purpose. It is not meant to be used for buy or sell decision. We do not recommend any particular stocks on our website. If particular stocks of such are mentioned, they are meant as illustration or demonstration of Amibroker as a powerful charting software or MACD scanner. Amibroker can program to scan the stocks that have MACD buy or sell signals.
These are script generated signals. Not all scan results are shown here. The MACD signal should use with price action and confirmation. Users must understand what MACD and price action are all about before using them. If necessary you should attend a course to learn more about Technical Analysis (TA) and Moving Average Convergence Divergence, MACD.
Once again, the website does not guarantee any results or investment return based on the information and instruction you have read here. It should be used as learning aids only and if you decide to trade real money, all trading decision should be your own, and you should take your own responsibility.
Welcome to AmiBroker Academy. Thanks for visiting the site.
Besides we post simple chart using different indicator to read price action, we do MACD scan too. Instead of checking stock by stock, we use MACD to screen near eight hundred stock to spot stock that have MACD signals. Have fun!
Moving Average Convergence Divergence, MACD Screener
MACD was developed by Gerald Appel in the late seventies.
MACD stands for Moving Average Convergence
Divergence, the MACD line (red line or called fast line) and MACD signal line
(blue line, or called slow line).
MACD
Bullish Signal Line Cross: MACD bullish signal when red line crosses above
the blue line or MACD line crosses above zero line.
MACD
Bearish Signal Line Cross: MACD bearish signal when blue line crosses below
red line or MACD line crosses below zero line.
MACD Scan
These are stocks picked for today.
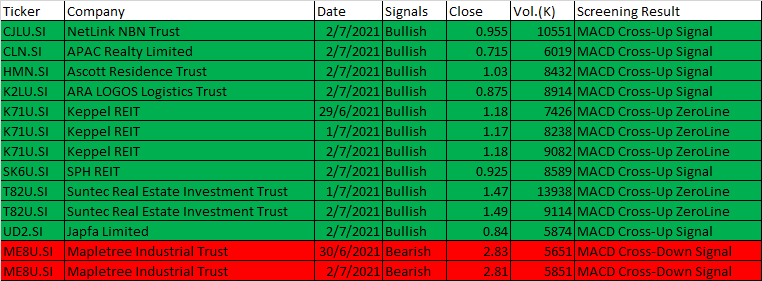
Some of 28 June to 2 July, 2021 AmiBroker AFL Script Generated Five-day Singapore Stock MACD Signals
In the five screener, you can find some stock have signal for two or more days. pay attention. Trade with eyes open.
Ticker
Company
Date
Signals
Close
Vol.(K)
Screening Result
CJLU.SI
NetLink NBN Trust
2/7/2021
Bullish
0.955
10551
MACD Cross-Up Signal
CLN.SI
APAC Realty Limited
2/7/2021
Bullish
0.715
6019
MACD Cross-Up Signal
HMN.SI
Ascott Residence Trust
2/7/2021
Bullish
1.03
8432
MACD Cross-Up Signal
K2LU.SI
ARA LOGOS Logistics Trust
2/7/2021
Bullish
0.875
8914
MACD Cross-Up Signal
K71U.SI
Keppel REIT
29/6/2021
Bullish
1.18
7426
MACD Cross-Up ZeroLine
K71U.SI
Keppel REIT
1/7/2021
Bullish
1.17
8238
MACD Cross-Up ZeroLine
K71U.SI
Keppel REIT
2/7/2021
Bullish
1.18
9082
MACD Cross-Up ZeroLine
SK6U.SI
SPH REIT
2/7/2021
Bullish
0.925
8589
MACD Cross-Up Signal
T82U.SI
Suntec Real Estate Investment Trust
1/7/2021
Bullish
1.47
13938
MACD Cross-Up ZeroLine
T82U.SI
Suntec Real Estate Investment Trust
2/7/2021
Bullish
1.49
9114
MACD Cross-Up ZeroLine
UD2.SI
Japfa Limited
2/7/2021
Bullish
0.84
5874
MACD Cross-Up Signal
ME8U.SI
Mapletree Industrial Trust
30/6/2021
Bearish
2.83
5651
MACD Cross-Down Signal
ME8U.SI
Mapletree Industrial Trust
2/7/2021
Bearish
2.81
5851
MACD Cross-Down Signal
20210628 to 0702 Singapore Stock Five (5)-Day MACD Signals
Moses Stock Scan
Power Free Singapore Stock MACD Scan Signals AmiBroker Academy.com
Disclaimer: The above result is for illustration purpose. It is not meant to be used for buy or sell decision. We do not recommend any particular stocks on our website. If particular stocks of such are mentioned, they are meant as illustration or demonstration of Amibroker as a powerful charting software or MACD scanner. Amibroker can program to scan the stocks that have MACD buy or sell signals.
These are script generated signals. Not all scan results are shown here. The MACD signal should use with price action and confirmation. Users must understand what MACD and price action are all about before using them. If necessary you should attend a course to learn more about Technical Analysis (TA) and Moving Average Convergence Divergence, MACD.
Once again, the website does not guarantee any results or investment return based on the information and instruction you have read here. It should be used as learning aids only and if you decide to trade real money, all trading decision should be your own, and you should take your own responsibility.
Welcome to AmiBroker Academy dot com, amibrokeracademy.com.
We sometime bench mark two stock price action or stock price with index, but this time we benchmark three stocks. The following example, we benchmark three local banks, DBS, OCBC and UOB. They are the local financial key players. Besides correlation we use other tools such as 1) Ichimoku Cloud, 2) Support Resistance (using box), 3) River (moving average), 4) GMMA and Woodies CCI, 5) Bollinger Bands and Moving Averages, and 6) MACD to analyze chart. See our simple reading of price action.
We also apply wave theory onto chart. Such as well know Elliott Waves. Just in case you are not familiar with Elliott Waves. Elliott was from Ralph Nelson Elliott.
Otherwise, we like to use pattern, such as ABCD pattern. Checkout our posting here for more.
We translate price action chart into layman language. This will help you in understand the financial instrument you are trading. We believe picture worth a thousand words. So, sometimes we use less words. You can learn the price action interpretation too. Give it a tray. You may not have the same view points as us. Remember all analysis read price action chart differently. It is just like reading an essay, we will have different conclusion.
Trade what you see. Manage your risk. Trade well.
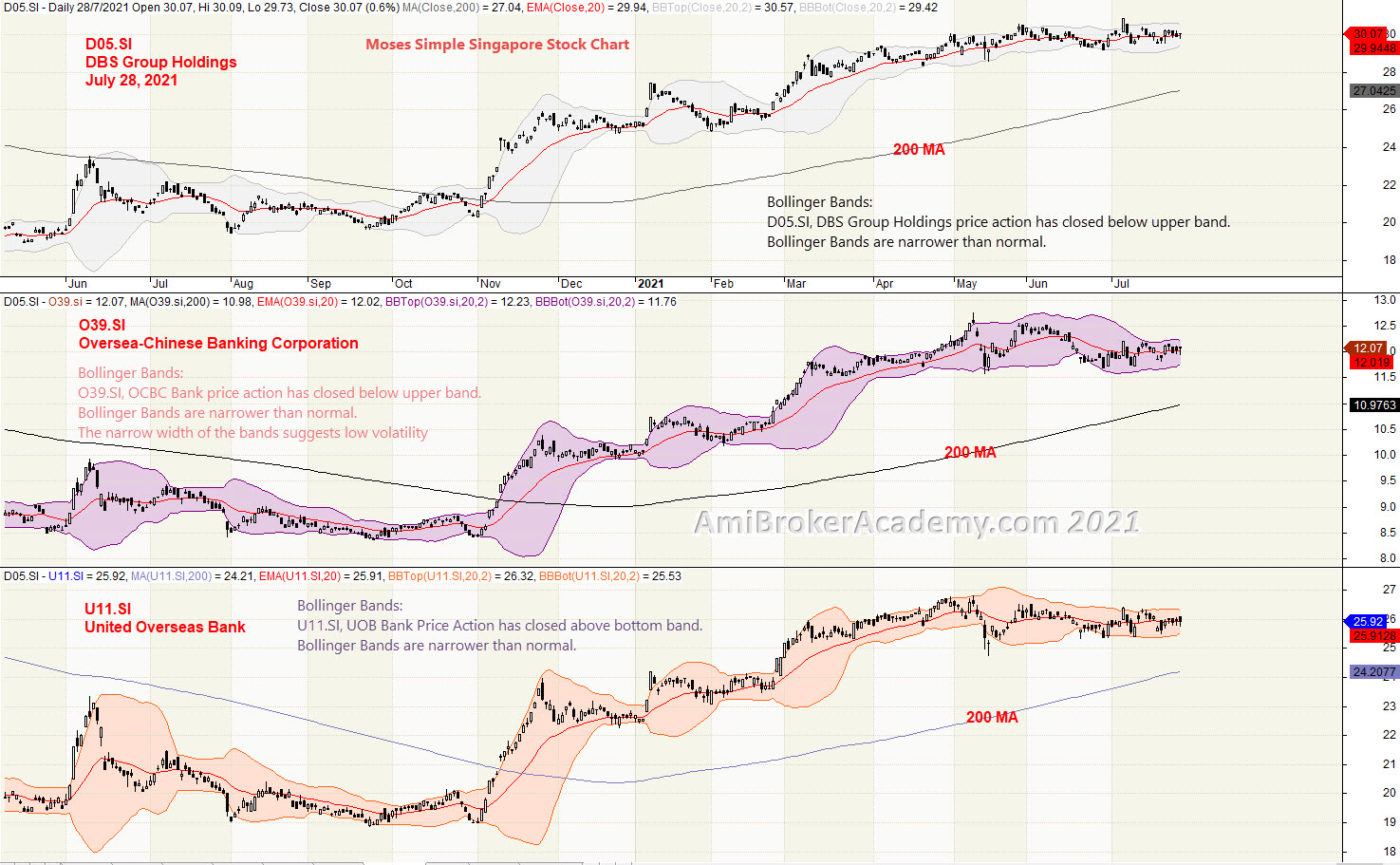
1) DBS Bank and OCBC Bank and UOB Bank Correlation
Most of the time, we benchmark two stocks. This time, we decided to benchmark three, three local bank stocks. They are DBS, OCBC and UOB. These are the three major local banks.
DBS price has continue to go higher, from bottom left to top right. In fact, this is true for the other two banks too. Price Action goes from bottom to top. The only different are different degree of high. Remember we are not talking about the dollar value. The stock price for the three banks are different.
A simple observation is the bollinger bands are narrow. So, the volatility is reduce at this moment. On the other hand, the price action can breakout and become volatile anytime. Trade with eyes open.
Remember, we just read what the chart said. Have fun!
20210728 DBS Bank and OCBC Bank and UOB Bank Correlation
Moses Power Charting
Official AmiBrokerAcademy.com Charting
Disclaimer
The above result is for illustration purpose. It is not meant to be used for buy or sell decision. We do not recommend any particular stocks. If particular stocks of such are mentioned, they are meant as demonstration of Amibroker as a powerful charting software and MACD. Amibroker can program to scan the stocks for buy and sell signals.
These are script generated signals. Not all scan results are shown here. The MACD signal should use with price action. Users must understand what MACD and price action are all about before using them. If necessary you should attend a course to learn more on Technical Analysis (TA) and Moving Average Convergence Divergence, MACD.
Once again, the website does not guarantee any results or investment return based on the information and instruction you have read here. It should be used as learning aids only and if you decide to trade real money, all trading decision should be your own.
We learn from many past and present great traders. Kudo to these master.
Welcome to AmiBroker Academy dot com, amibrokeracademy.com.
Secret Code
The analysis is not for everyone. One key in trading is to how to manage your emotion. You thought could change your trading results. Manage your risk.
This not a site for those just want to know, buy or sell. We don’t provide you the buy or sell information, we provide you the thought you can decide and take responsibility.
Trading is all about observation, reading the price bar and not news. By the time you hear the news it is already old and become history. Why? It is very simple, remember where the news come from? It has first someone release to the news agency like CNBC, and so on. Next, someone has to read the news to you after some research and summarize. This will be few hours later, by then the price action has already done.
As for price bar, it is what the market supply and remand. When market feel that is over price, the price will drop. All this reflected on the price bar almost instantly.
Next is how to read our price bar plus using some tools, such as MACD.
Here, we simply translate price action chart into layman language. This will help you in understand the financial instrument you are trading. We believe picture worth a thousand words. So, sometimes we use less words. You can learn the price action interpretation too. Give it a tray. You may not have the same view points as us. Remember all analysis read price action chart differently. It is just like reading an essay, we will have different conclusion.
Trade well.
Trade what you see. Manage your risk.
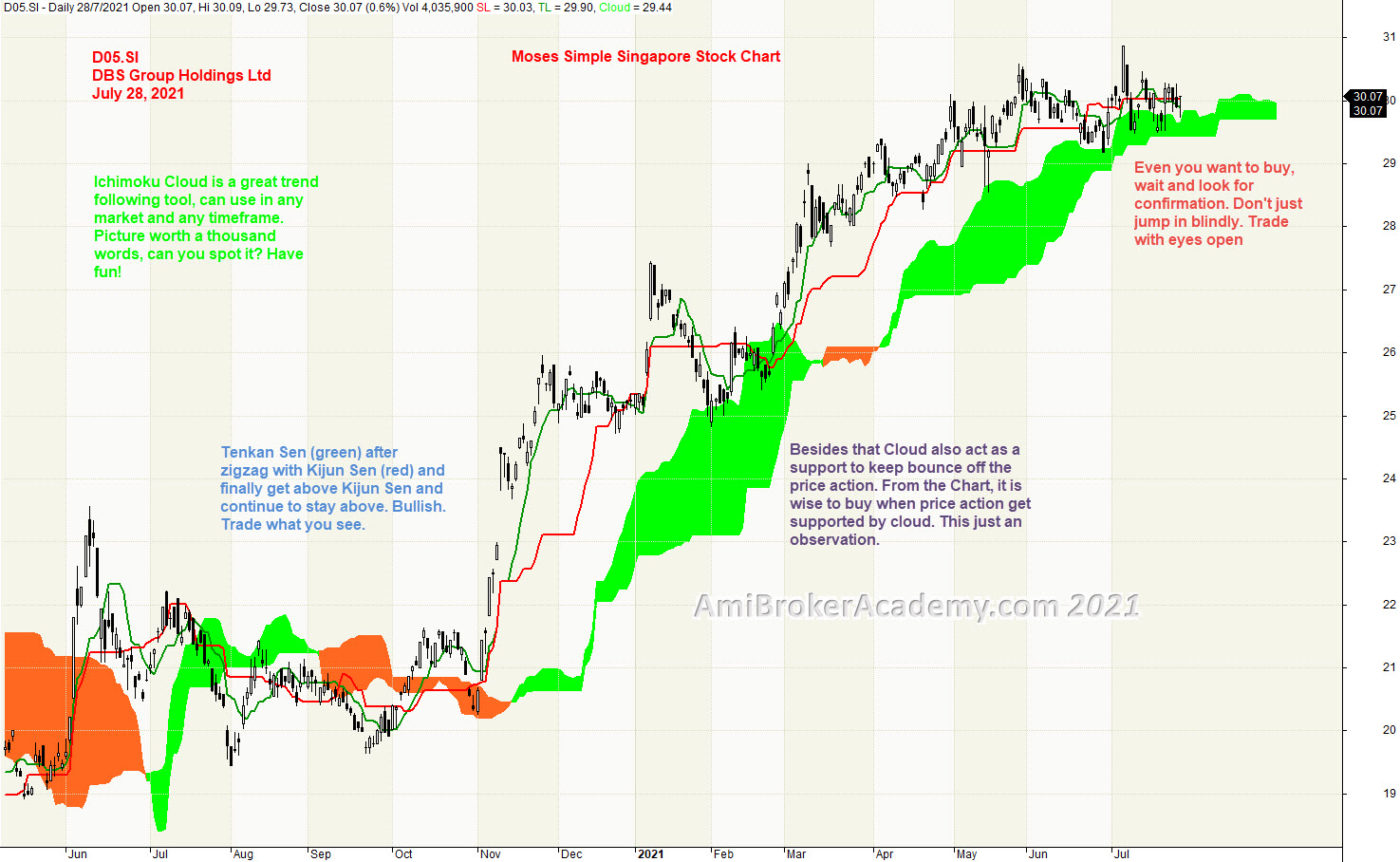
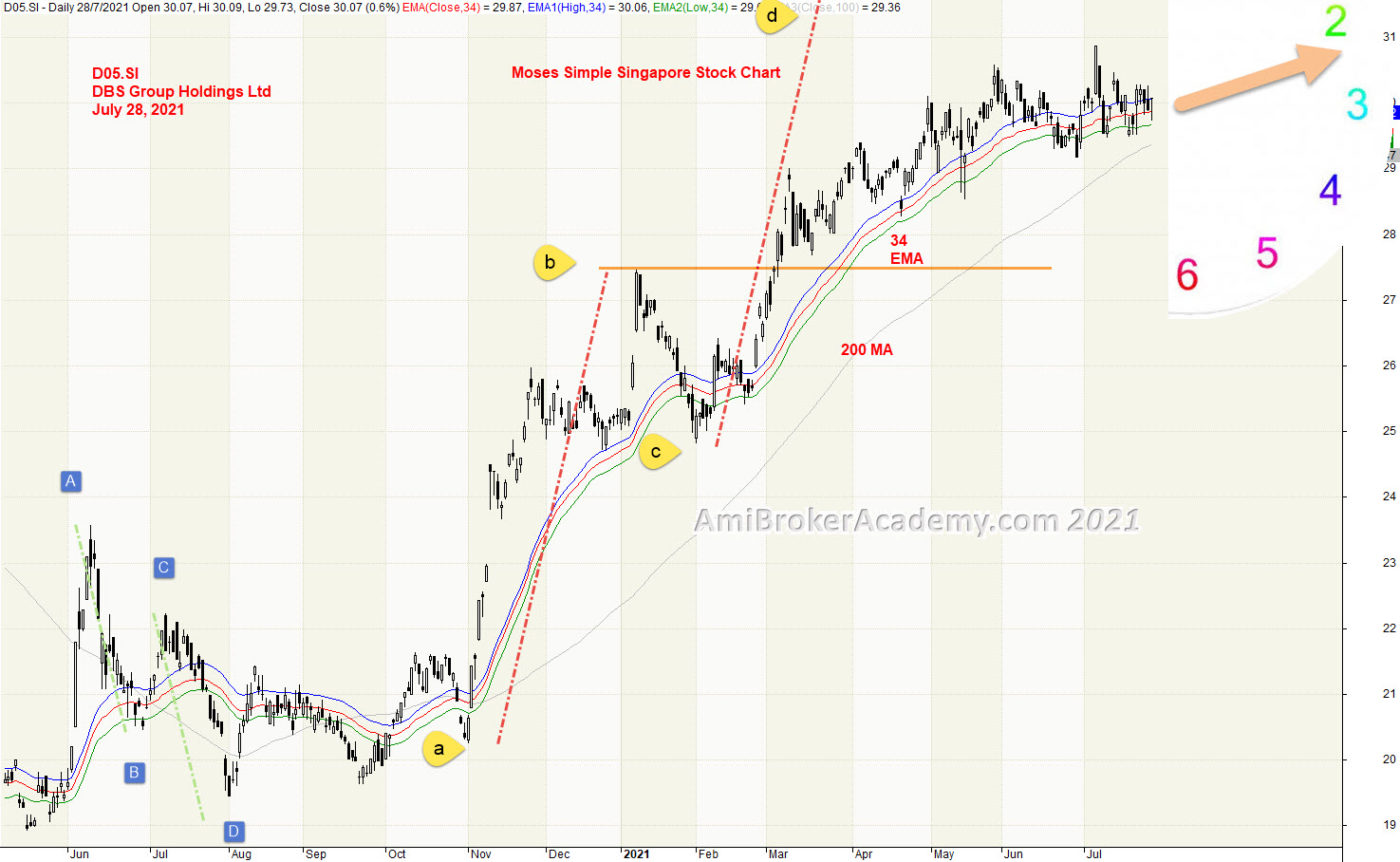
1) DBS Group Holdings and Ichimoku Cloud
Ichimoku Cloud is a great trend following strategy tool. It can be used in any market, any timeframe and any financial instrument. Ichimoku indicator suggest to trade in the trend direction. But, as you know, in trading, there are many ways to make money. There are traders, professional trader trading trend reversal. So, choice which side you are standing.
We see price action emerge from the cloud and stay above. Bull trend. Price action goes from bottom left below the cloud to the top to the right and above cloud. Price action has used the cloud as support. Remember, buy support sell resistance. It is wise to wait for price action to draw near the cloud and get supported by you buy.
Price Action now is supported again. Remember to wait for confirmation before take action. And when we are not sure, our practice is stand aside and wait. We see Tenkan Sen (green) again zigzag with Kijun Sen (red). Trade what you see.
Picture worth a thousand words.
Remember, we just read what the chart said. We do not and can not personalize the price action to your liking. Have fun!
Don’t play play with Ichimoku indicator. Very simple. Yet powerful. AmiBrokerAcademy provides you simple yet easy to understand stock chart. Check out Moses power stock chart.
20210728 DBS Group Holdings and Ichimoku Cloud
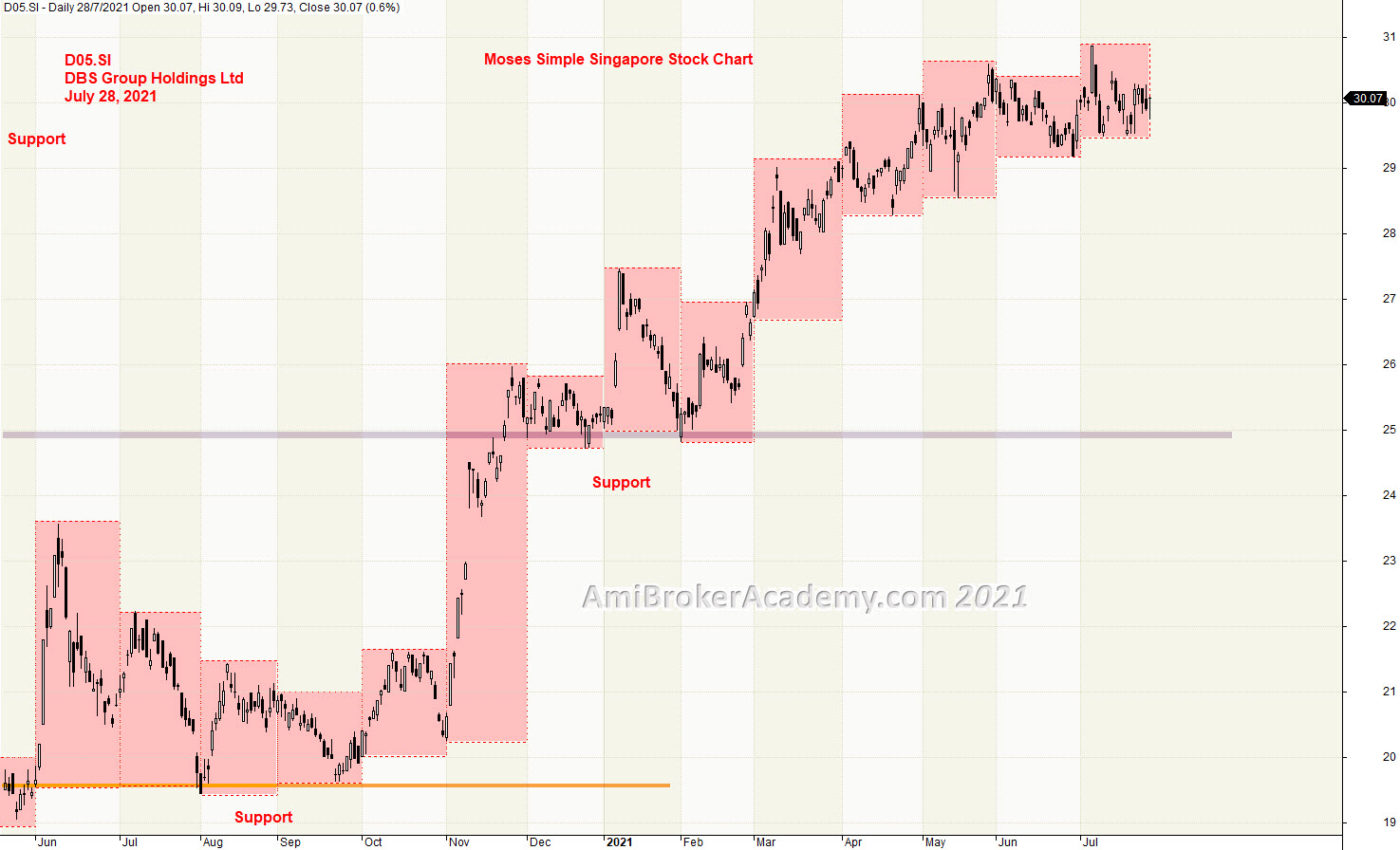
2) DBS Group Holdings and Support Resistance
Study D05 price action, price action goes from low to high, from bottom left to top right. If we use the month high low to help in finding good or strong support resistance. We will find a key level, or zone price action has been supported.
Price Action has jumped from one support level to the next one. The first one is very strong, as it was four months low. The second only has three months low. Trade what you see. Mange your risk.
20210728 DBS Group Holdings and Support Resistance
3) DBS Group Holdings and River
Price Action is pointing to between two and three o’clock direction, price action is bull bias. See chart, we see the trend is slopping up and up.
Moving Average is a great visual tool. Raghee uses high, low and close of 34 EMA to form a band, we called it River to determine the wave direction. Price action goes from below 34 EMA to above River.
River is a great support resistance tool too. Catch the support to find the entry. Remember to reduce risk by buy support and take profit to sell resistance.
For H M Gartley’s fan, you probably spot ABCD patterns.
Manage your risk.
20210728 DBS Group Holdings and River
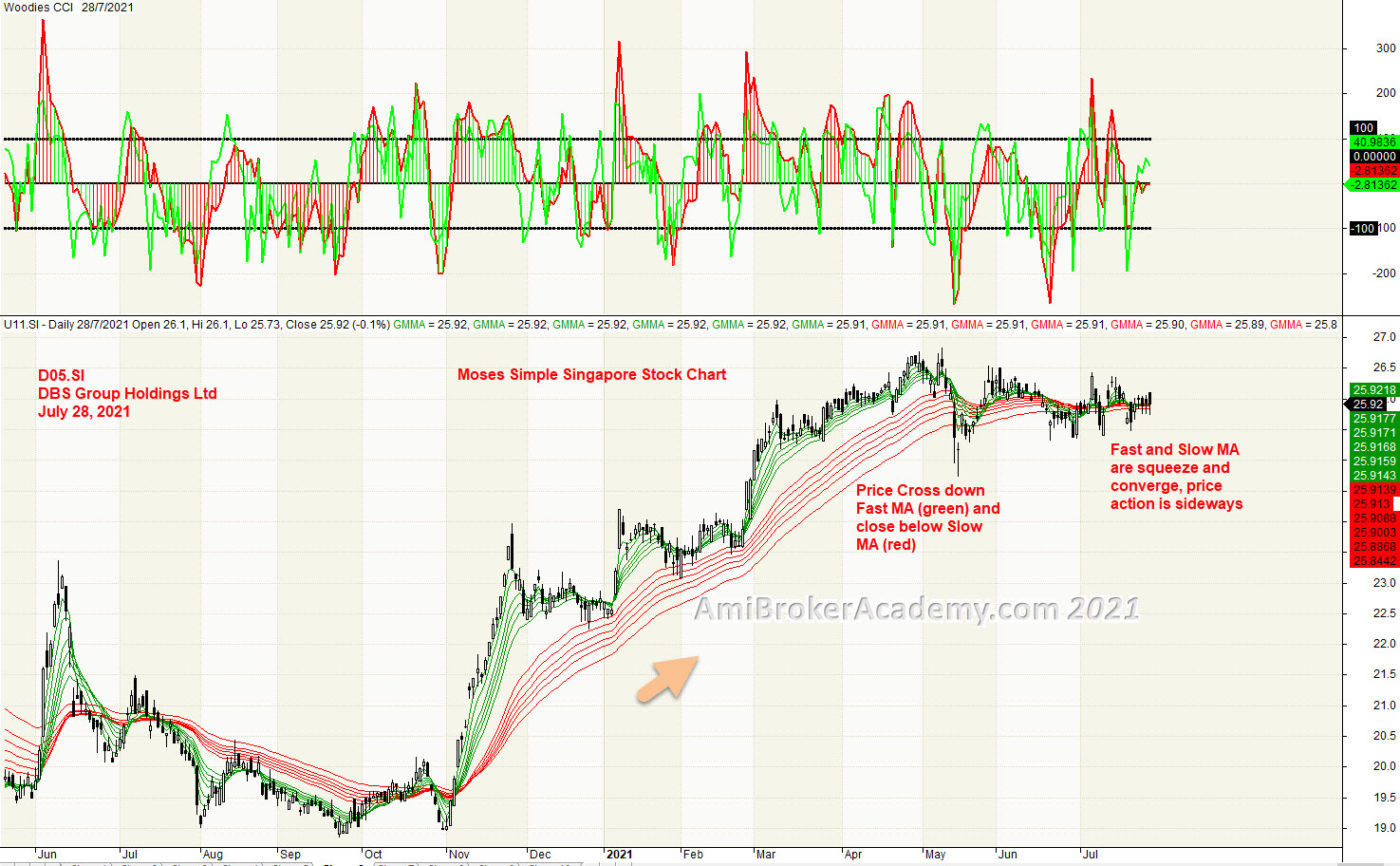
4) DBS Group Holdings and GMMA and Woodies CCI
Study D05 price action with GMMA and Woodies. Price action goes from low to high, from bottom left to top right.
It starts from price action and Fast MA (green) from below to above Slow MA (red) and stay above.
From Woodies CCI, price action continues to go higher. But, Woodies CCi is forming lower high. Divergence. Price Action might be topping. Trade with eyes open.
Mange your risk.
20210728 DBS Group Holdings and GMMA and Woodies CCI
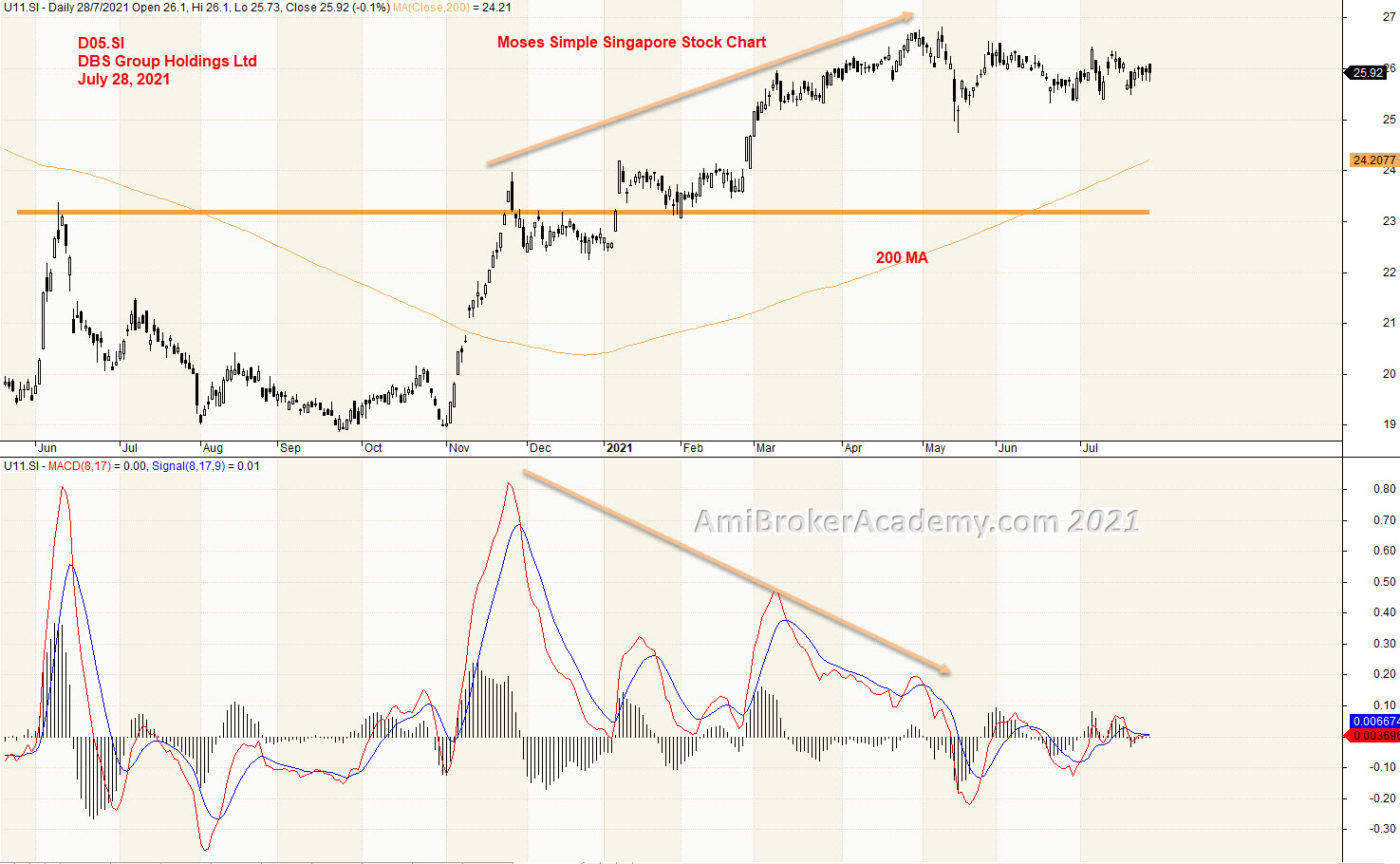
5) DBS Group Holdings and MACD Divergence
We study price action we see MACD Divergence, price action continues to go higher, but MACD begin to form lower high and MACD Histogram to form lower high. So we expect a reversal is going to happen. But by now everyone has learnt that MACD Divergence is like a traffic light, you don’t stop at every traffic light. So, be the MACD Divergence. The price action may not pullback. But topping signal has now showed.
Trade what you see. We are looking for bear signal, and confirmation. MACD cross signal is a good indication to lookout for.
So, read the information you can get from the chart.
Remember, we just read what the chart said. Have fun!
Don’t play play with MACD indicator. Very simple yet powerful.
20210728 DBS Group Holdings and MACD Divergence
Moses Power Charting
Official AmiBrokerAcademy.com Charting
Disclaimer
The above result is for illustration purpose. It is not meant to be used for buy or sell decision. We do not recommend any particular stocks. If particular stocks of such are mentioned, they are meant as demonstration of Amibroker as a powerful charting software and MACD. Amibroker can program to scan the stocks for buy and sell signals.
These are script generated signals. Not all scan results are shown here. The MACD signal should use with price action. Users must understand what MACD and price action are all about before using them. If necessary you should attend a course to learn more on Technical Analysis (TA) and Moving Average Convergence Divergence, MACD.
Once again, the website does not guarantee any results or investment return based on the information and instruction you have read here. It should be used as learning aids only and if you decide to trade real money, all trading decision should be your own.
We learn from many past and present great traders. Kudo to these master.
Welcome to AmiBroker Academy dot com, amibrokeracademy.com.
Here, we simply translate price action chart into layman language. This will help you in understand the financial instrument you are trading. We believe picture worth a thousand words. So, sometimes we use less words. You can learn the price action interpretation too. Give it a tray. You may not have the same view points as us. Remember all analysis read price action chart differently. It is just like reading an essay, we will have different conclusion.
Trade well.
Trade what you see. Manage your risk.
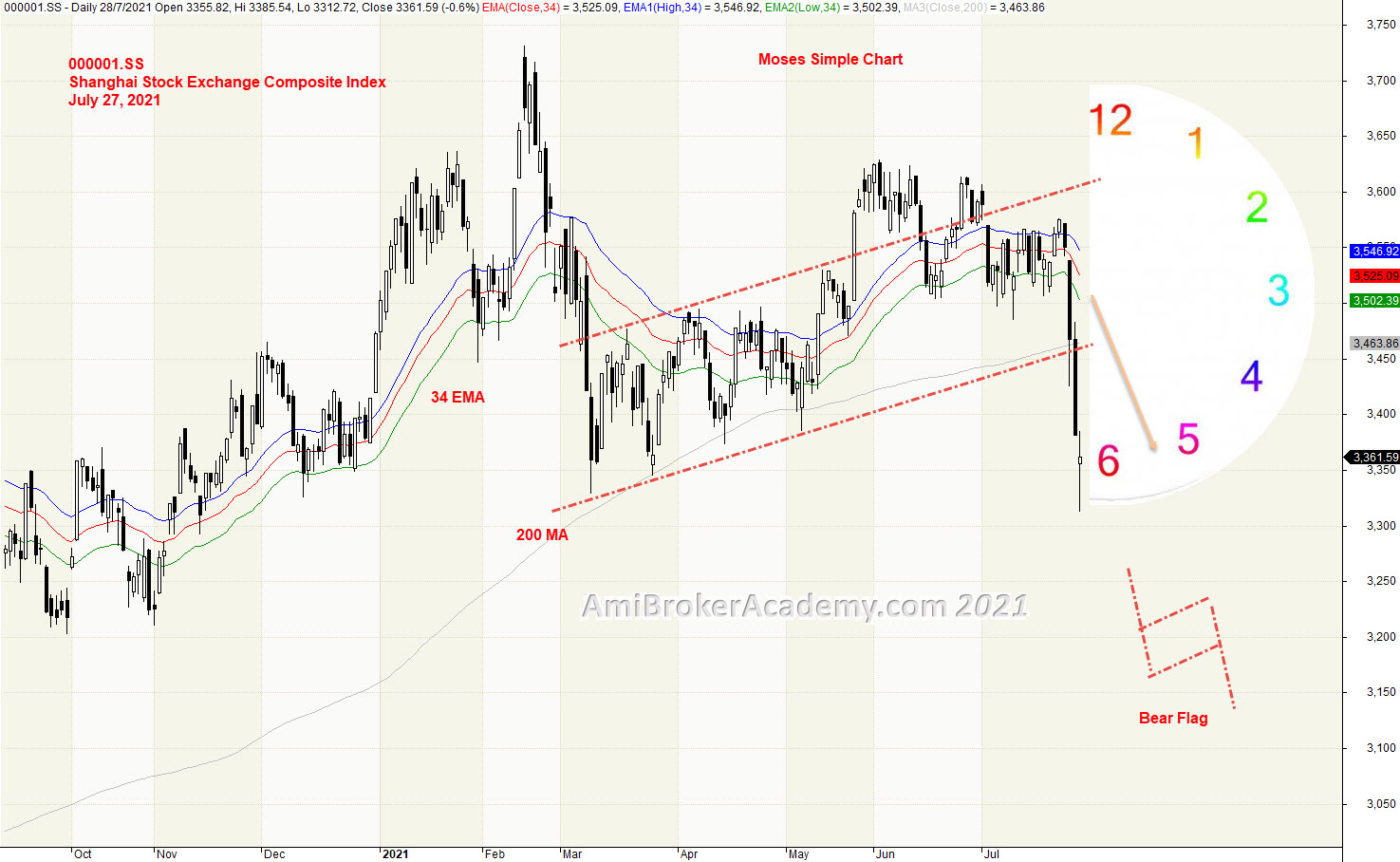
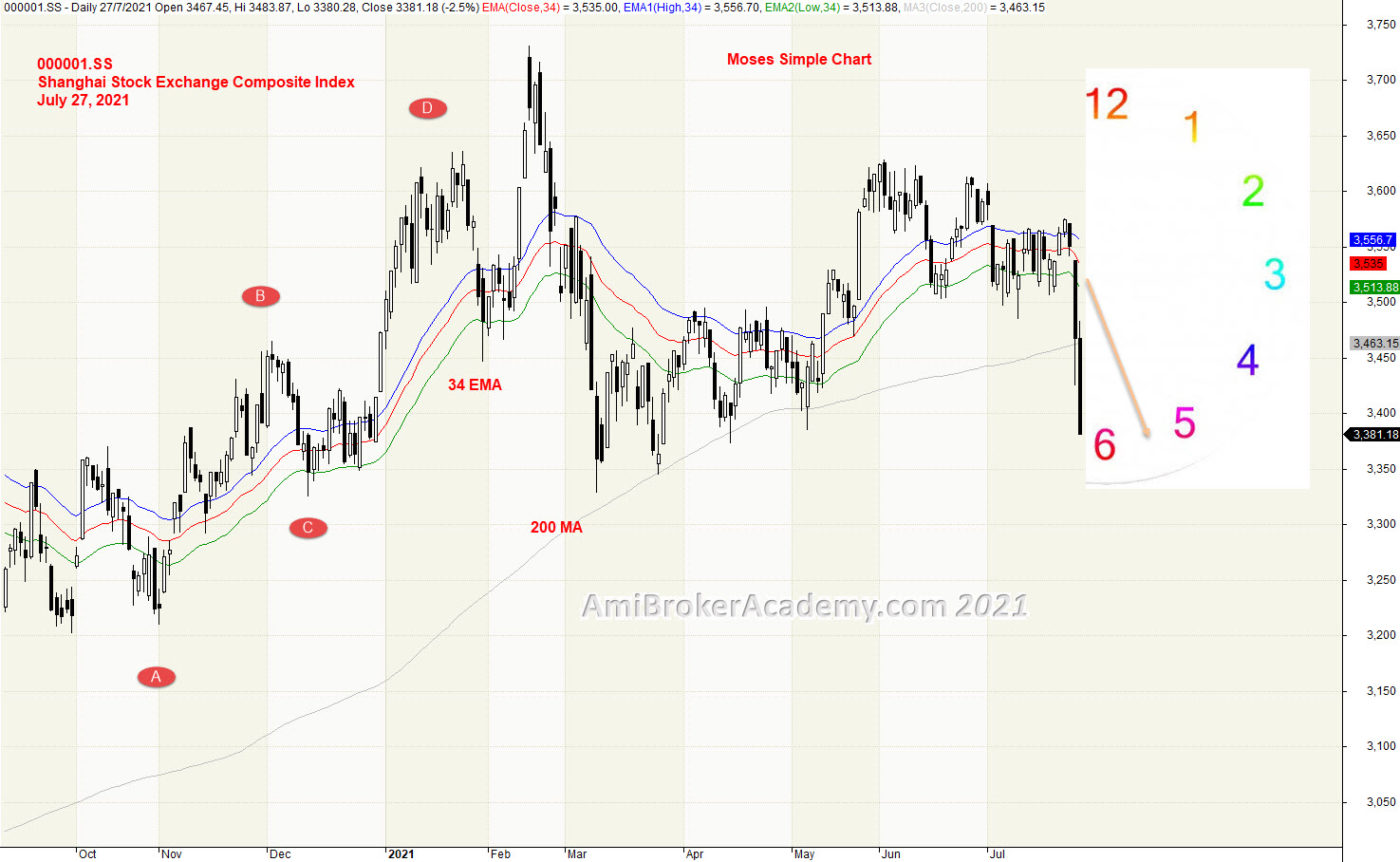
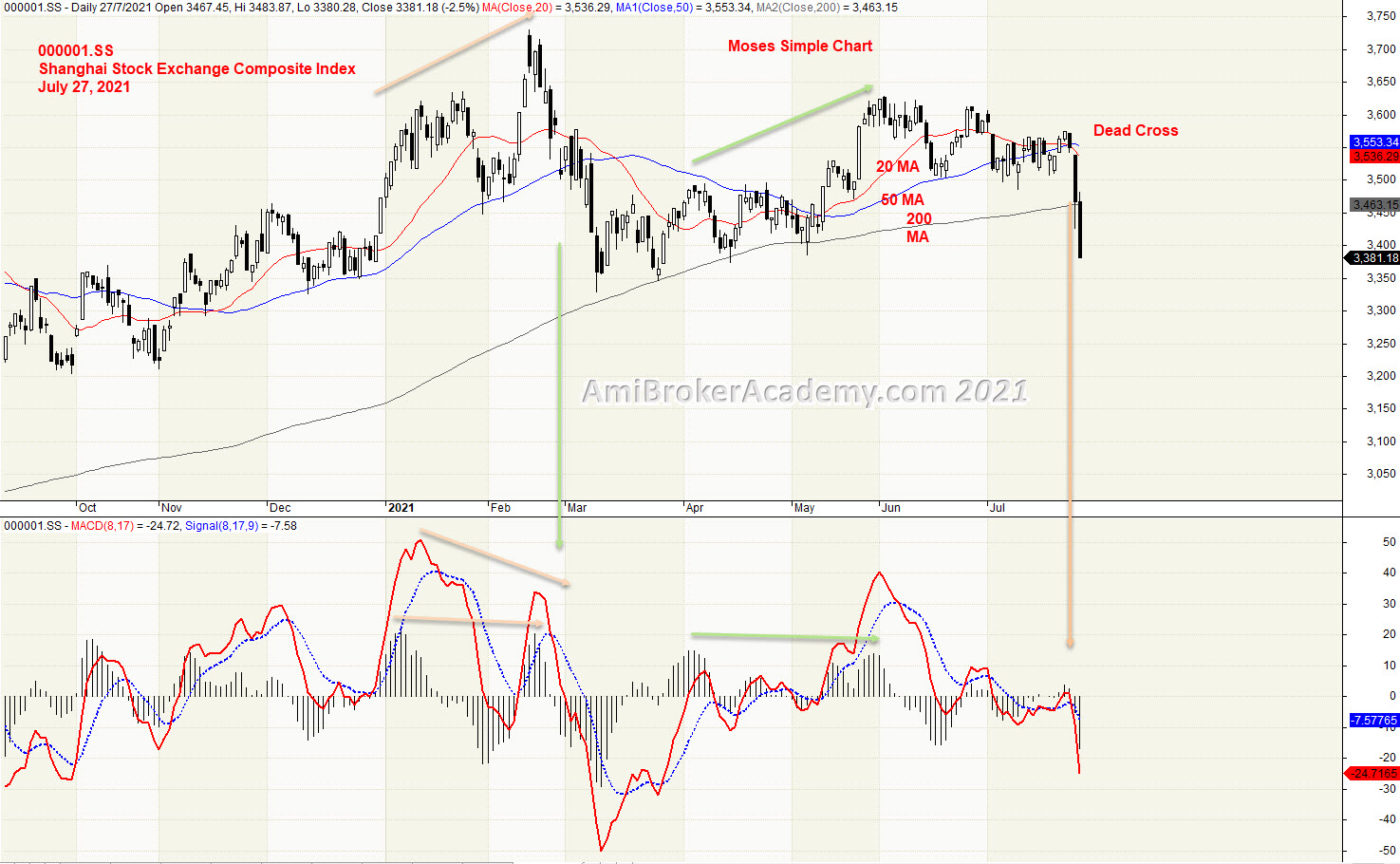
1) Shanghai Stock Exchange Composite Index and River
After two long big bear bars or candlesticks. Now, Doji, indecision. From a chart pattern, you can see a bear flag chart pattern.
Trade with eyes open.
20210727 Shanghai Stock Exchance Composite Index and River
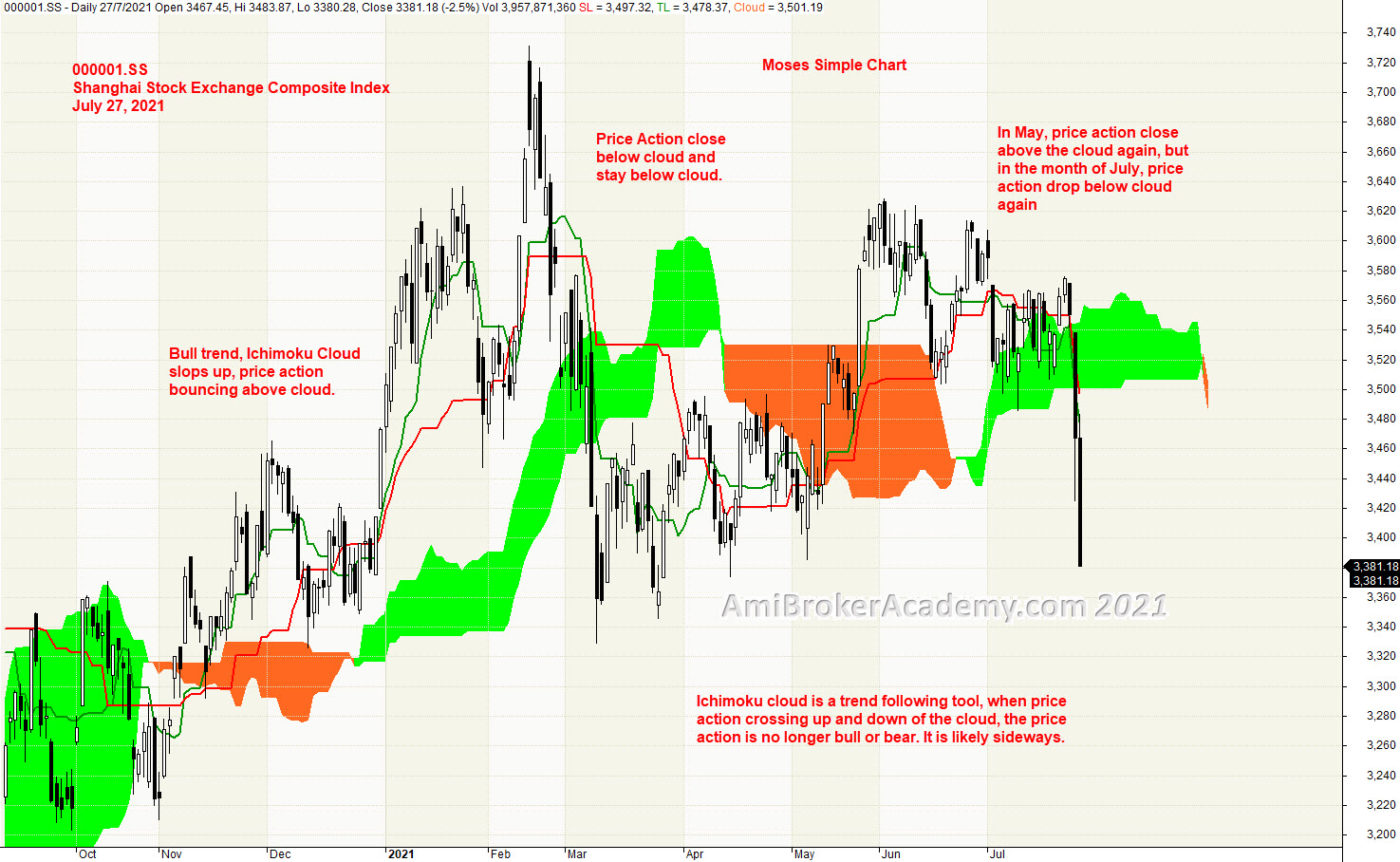
2) Shanghai Stock Exchange Composite Index and River
34 EMA slops up and above 200 MA, bull trend. Price Action should also stay above the River at this point. Raghee uses 34 EMA, high, low and close to see the wave direction,
Price Action crosses and closes below River, in March. Price Action try to breakout River but fail. Only until May price action breakout above River. But, shortly after the price breakout below River. River begin to go flat.
20210727 Shanghai Stock Exchange Composite Index and River
Moses Power Charting
Official AmiBrokerAcademy.com Charting
Disclaimer
The above result is for illustration purpose. It is not meant to be used for buy or sell decision. We do not recommend any particular stocks. If particular stocks of such are mentioned, they are meant as demonstration of Amibroker as a powerful charting software and MACD. Amibroker can program to scan the stocks for buy and sell signals.
These are script generated signals. Not all scan results are shown here. The MACD signal should use with price action. Users must understand what MACD and price action are all about before using them. If necessary you should attend a course to learn more on Technical Analysis (TA) and Moving Average Convergence Divergence, MACD.
Once again, the website does not guarantee any results or investment return based on the information and instruction you have read here. It should be used as learning aids only and if you decide to trade real money, all trading decision should be your own.
We learn from many past and present great traders. Kudo to these master.
Welcome to AmiBroker Academy dot com, amibrokeracademy.com.
Trading is all probability. You buy or sell from our observation.
Trading is all about observation, reading the price bar and not news. By the time you hear the news it is already old and become history. Why? It is very simple, remember where the news come from? It has first someone release to the news agency like CNBC, and so on. Next, someone has to read the news to you after some research and summarize. This will be few hours later, by then the price action has already done.
As for price bar, it is what the market supply and remand. When market feel that is over price, the price will drop. All this reflected on the price bar almost instantly.
Next is how to read our price bar plus using some tools, such as MACD.
Here, we simply translate price action chart into layman language. This will help you in understand the financial instrument you are trading. We believe picture worth a thousand words. So, sometimes we use less words. You can learn the price action interpretation too. Give it a tray. You may not have the same view points as us. Remember all analysis read price action chart differently. It is just like reading an essay, we will have different conclusion.
Trade well.
Trade what you see. Manage your risk.
1) Shanghai Stock Exchange Composite Index and Ichimoku Cloud
Ichimoku Cloud is a good trend following strategy tool, can use in any market and any timeframe. You can also apply Ichimoku cloud on cryptocurrency chart. Ichimoku indicator emphasize to trade in the trend direction.
Price action goes from bottom left to the top of the chart. After February, the price action begin to pullback and sink into cloud and stay inside cloud. Remember, Ichimoku is a trend following tool, look like the current price action has broken Ichimoku capable off. So, when not sure, stand aside, wait for clearer trend.
Don’t play play with Ichimoku indicator. Very simple. Very powerful. AmiBrokerAcademy provides you simple and easy to understand charting. Check out more on Moses power stock chart.
20210727 Shanghai Stock Exchange Composite Index and Ichimoku Cloud
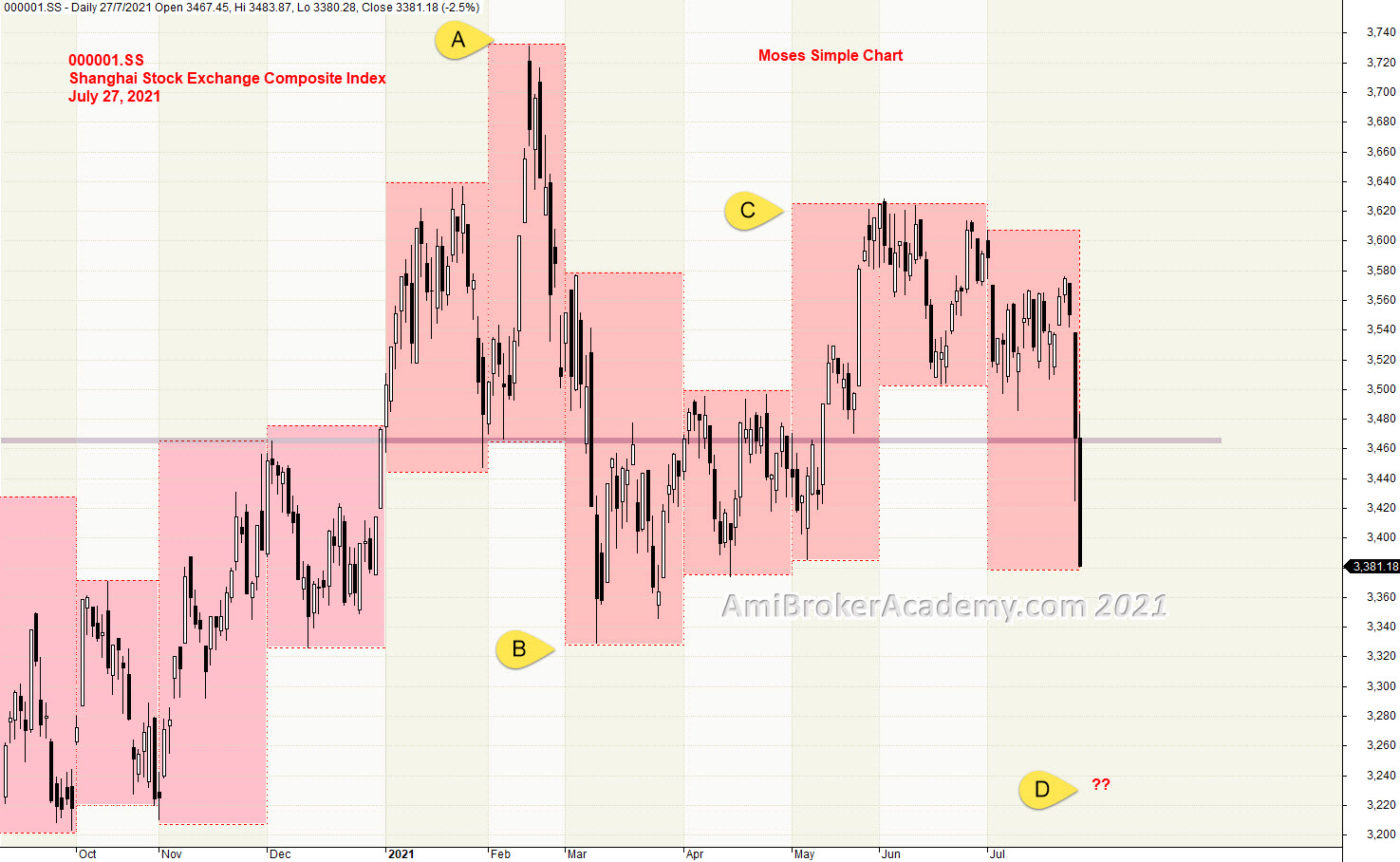
2) Shanghai Stock Exchange Composite Index and Support Resistance
Price Action goes from low to high and pullback. We use month high low to find a solid strong support resistance level. From box, and price action we see 3460 level is a strong level.
We could spot a potential ABCD patter. Now is in CD leg.
Have fun!
20210727 Shanghai Stock Exchange Composite Index and Support Resistance
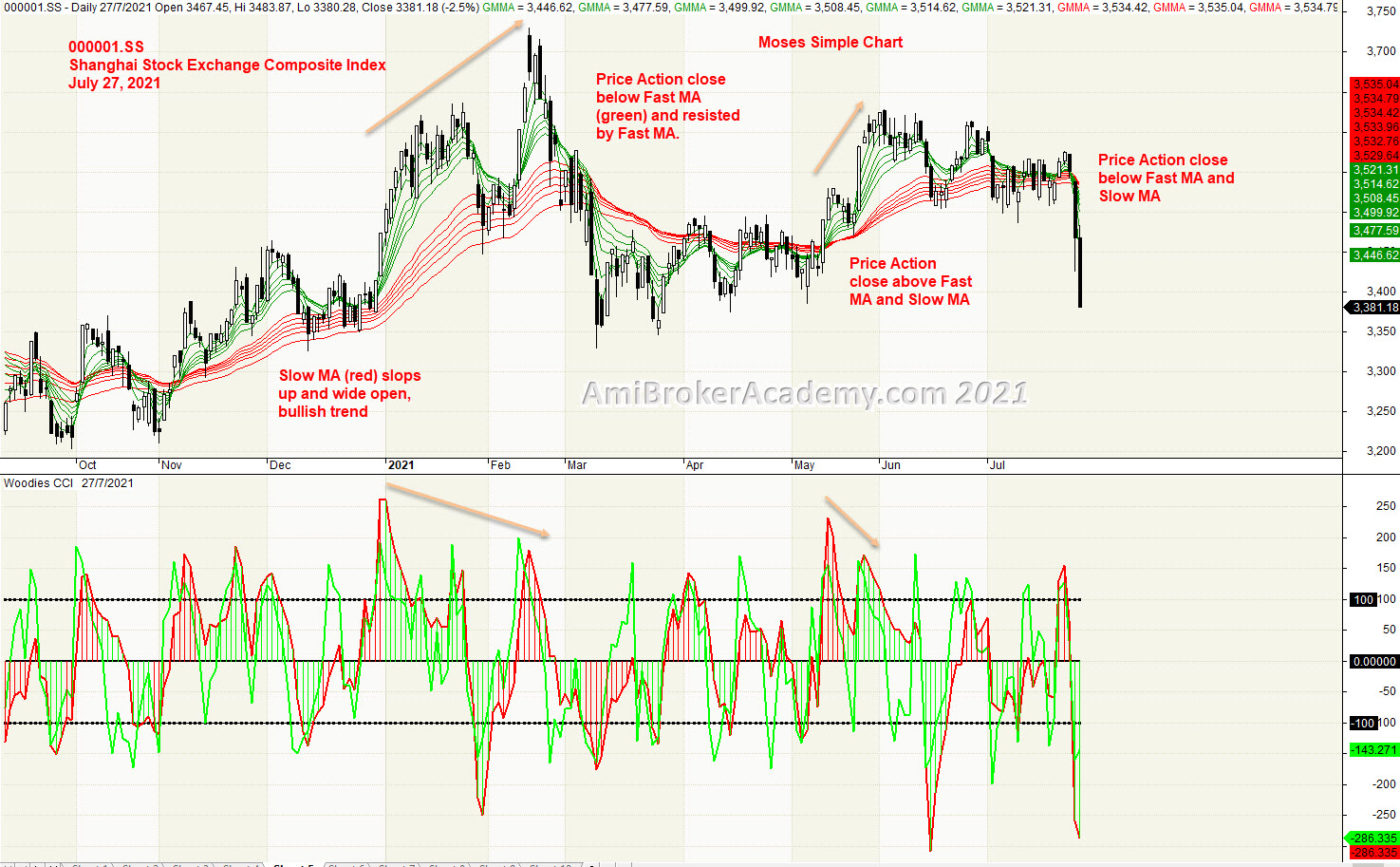
3) Shanghai Stock Exchange Composite Index and GMMA and Woodies CCI
When add GMMA, you could find the green belt go on top of red belt, and green belt start to sink below red in March. Green stay below red. Next, green goes above red. In July price action breakout below both Green and Red band. This is the beauty of GMMA, help you to find the bull and the bear trend.
Find low to buy when bull trend. Taking profit when price action get resisted.
Trade with eyes open.
20210727 Shanghai Stock Exchange Composite Index and GMMA and Woodies CCI
4) Shanghai Stock Exchange Composite Index and River
34 EMA slops up and above 200 MA, bull trend. Price Action should also stay above the River at this point. Raghee uses 34 EMA, high, low and close to see the wave direction,
Price Action crosses and closes below River, in March. Price Action try to breakout River but fail. Only until May price action breakout above River. But, shortly after the price breakout below River. River begin to go flat.
20210727 Shanghai Stock Exchange Composite Index and River
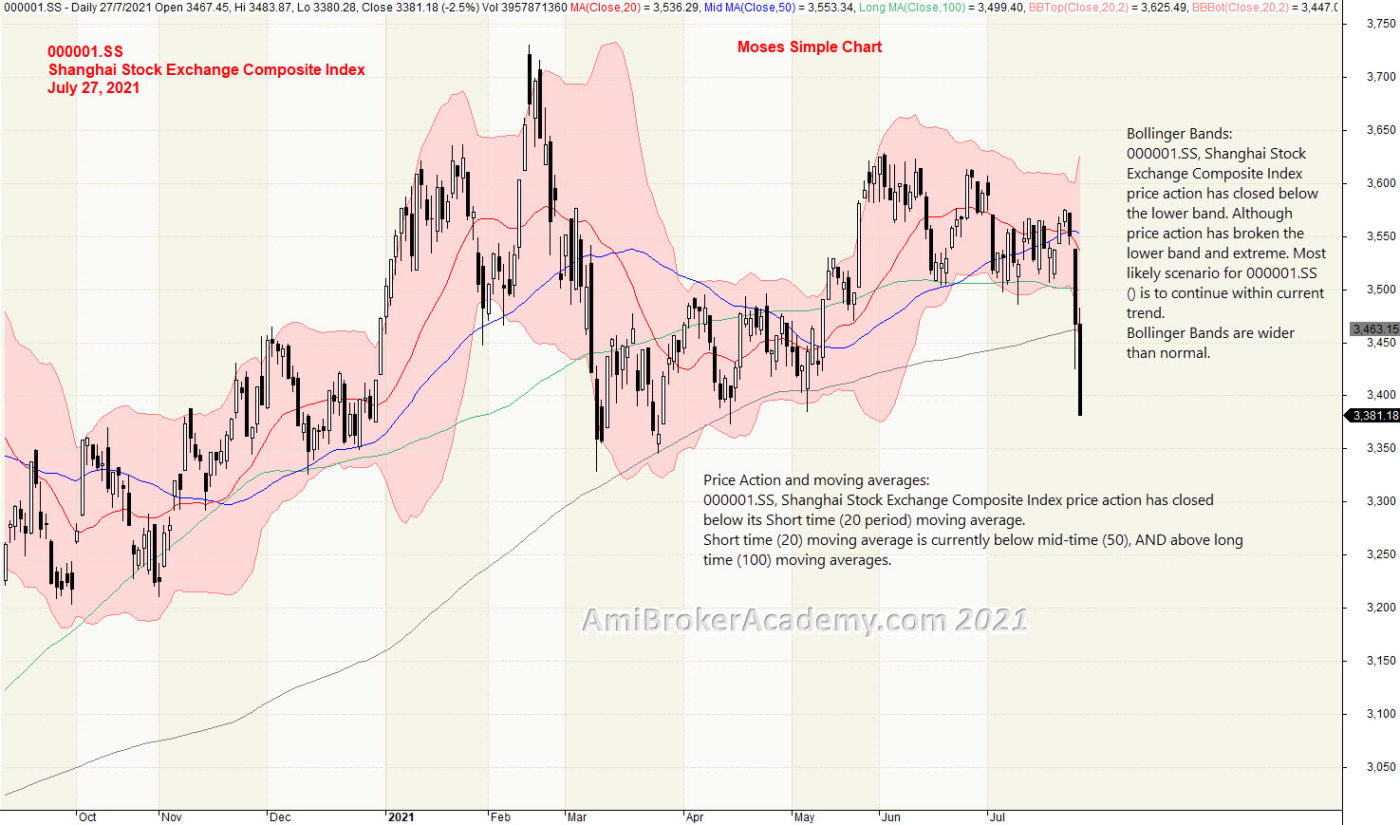
5) Shanghai Stock Exchange Composite Index and Bollinger Bands and Moving Averages
20210727 Shanghai Stock Exchange Composite Index and Bollinger Bands and Moving Averages
6) Shanghai Stock Exchange Composite Index and MACD
MACD is a simple yet powerful indicator. See price action react to MACD Divergence, MACD Cross Up or Down Signal. Don’t play play.
20210727 Shanghai Stock Exchange Composite Index and MACD
Moses Power Charting
Official AmiBrokerAcademy.com Charting
Disclaimer
The above result is for illustration purpose. It is not meant to be used for buy or sell decision. We do not recommend any particular stocks. If particular stocks of such are mentioned, they are meant as demonstration of Amibroker as a powerful charting software and MACD. Amibroker can program to scan the stocks for buy and sell signals.
These are script generated signals. Not all scan results are shown here. The MACD signal should use with price action. Users must understand what MACD and price action are all about before using them. If necessary you should attend a course to learn more on Technical Analysis (TA) and Moving Average Convergence Divergence, MACD.
Once again, the website does not guarantee any results or investment return based on the information and instruction you have read here. It should be used as learning aids only and if you decide to trade real money, all trading decision should be your own.
We learn from many past and present great traders. Kudo to these master.
Welcome to AmiBroker Academy dot com, amibrokeracademy.com.
Trading is all probability. You buy or sell from your observation.
Saw a very famous training company live talking about organizing a cryptocurrency trading training. Just wonder, how much will the course be. If Bitcoin is around 37,000 dollars. A simple training course for trading cryptocurrency could easily price ten thousand dollars. Think think got more things. Is the price action chart of Crypto different from other stock chart. You say lah. Price Action is price action, indicator is indicator.
We are going to post all the cryptocurrencies we capture so far.
Remember trading is all about observation, reading the price bar and not news.
As for price bar, it is what the market supply and remand. When market feel that is over price, the price will drop. All this reflected on the price bar almost instantly.
Next is how to read our price bar plus using some tools, such as MACD.
Here, we simply translate price action chart into layman language. This will help you in understand the financial instrument you are trading. We believe picture worth a thousand words. So, sometimes we use less words. You can learn the price action interpretation too. Give it a tray. You may not have the same view points as us. Remember all analysis read price action chart differently. It is just like reading an essay, we will have different conclusion.
Trade well.
Trade what you see. Manage your risk.
Picture worth a thousand words. We are not going to explain any more. Just see the picture. …
USDCoin USDC
Polkadot DOT1
Bitcoin
XRP
Ethereum
Cardnano
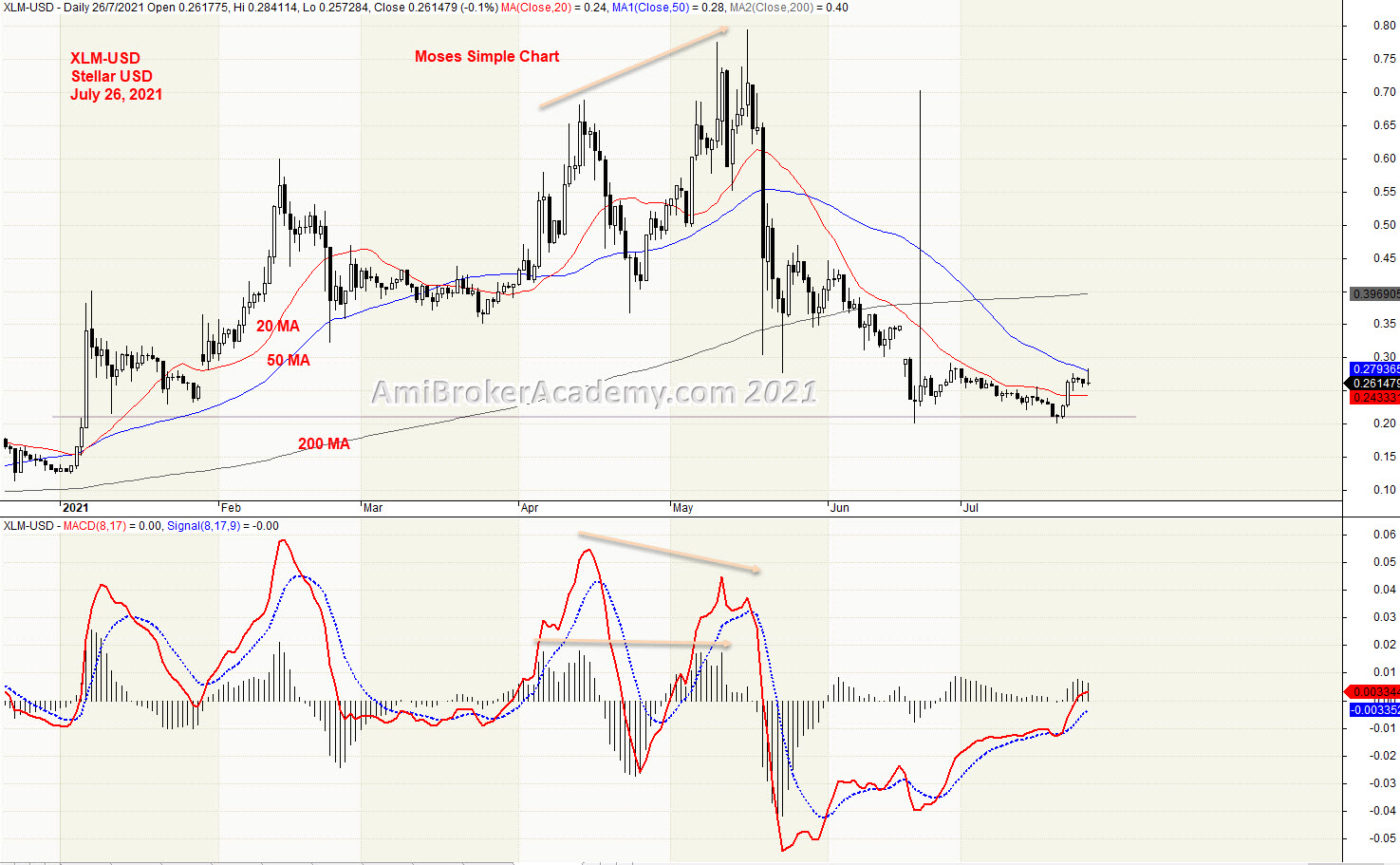
Stellar
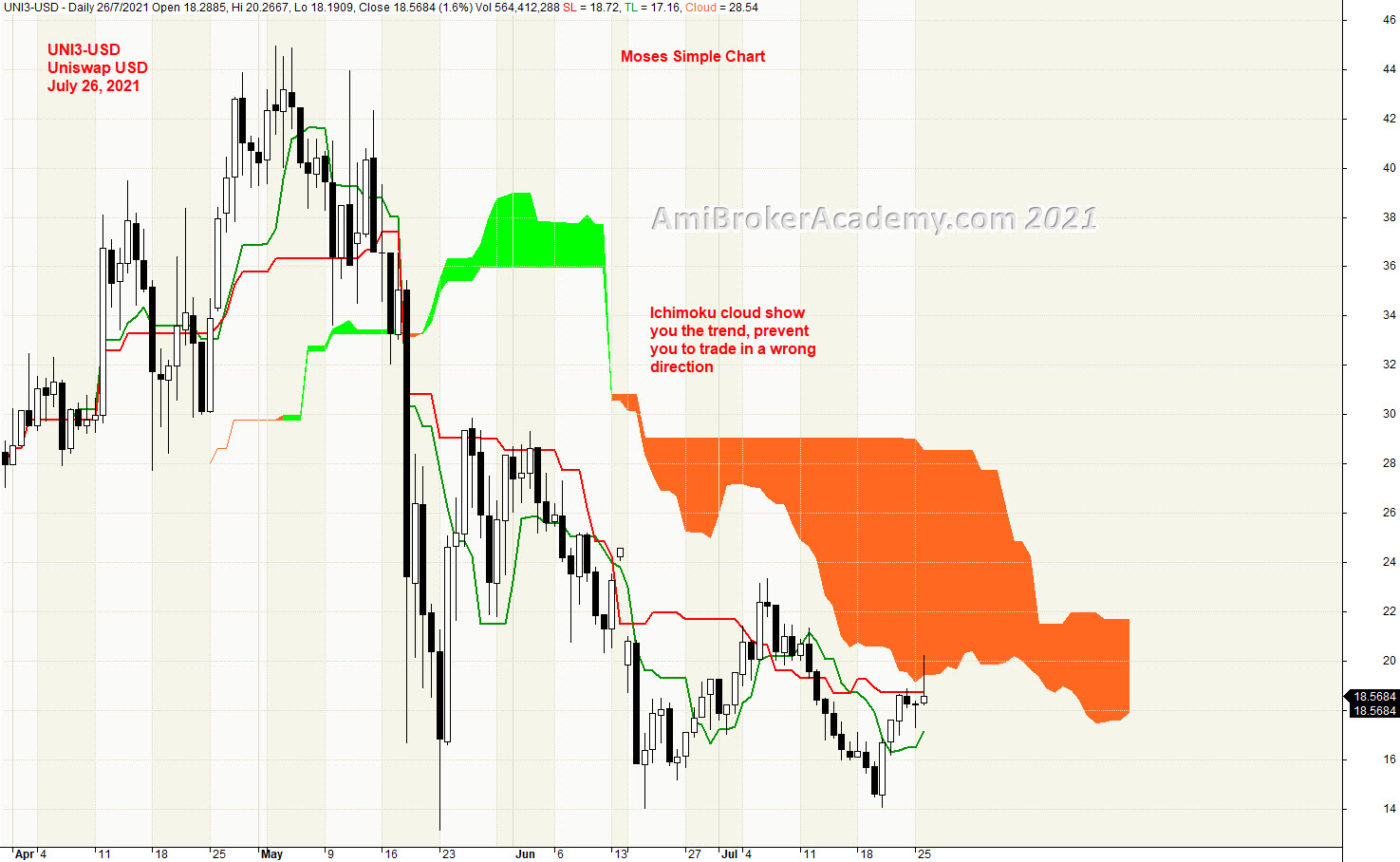
Uniswap
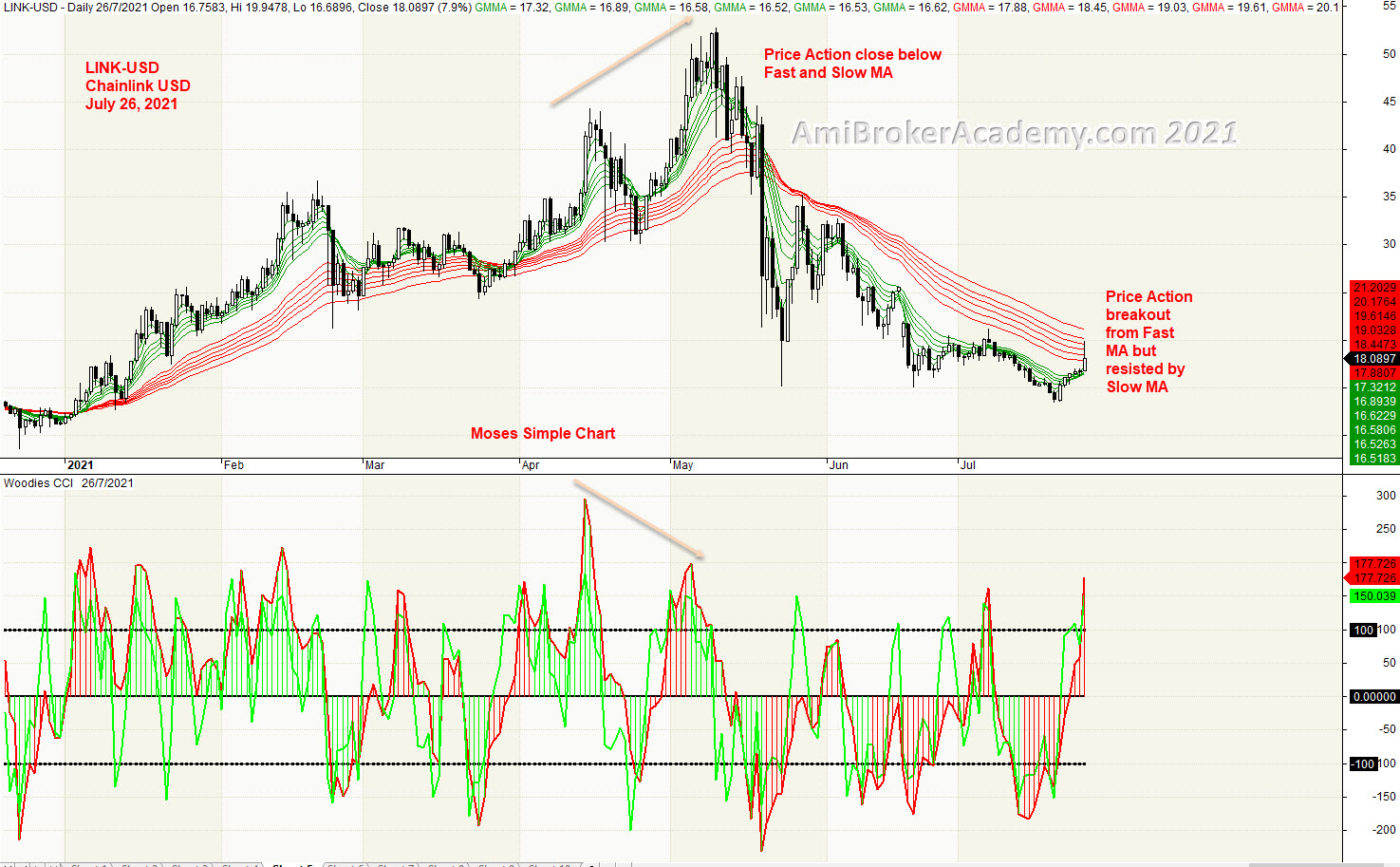
Chainlink
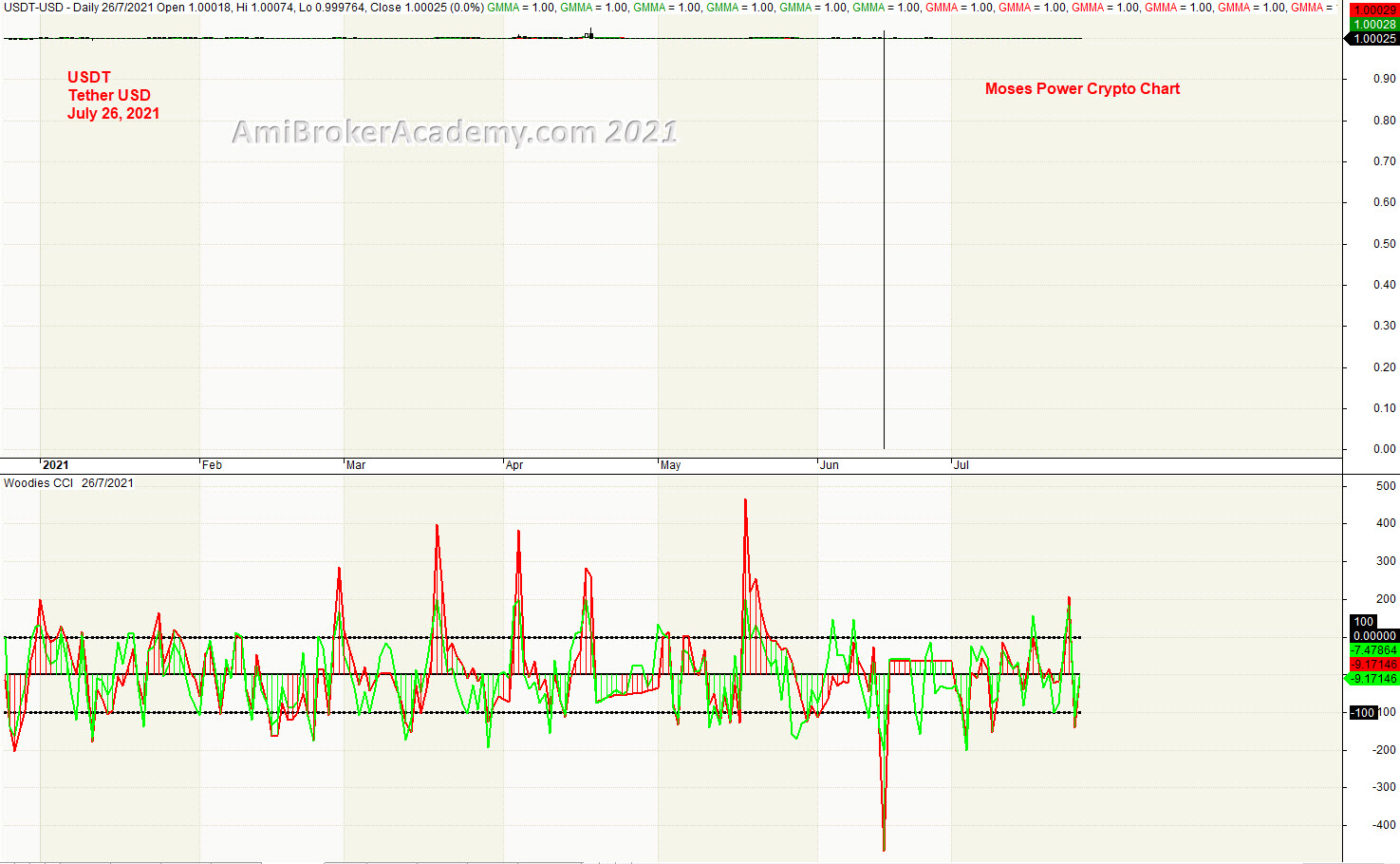
Tether
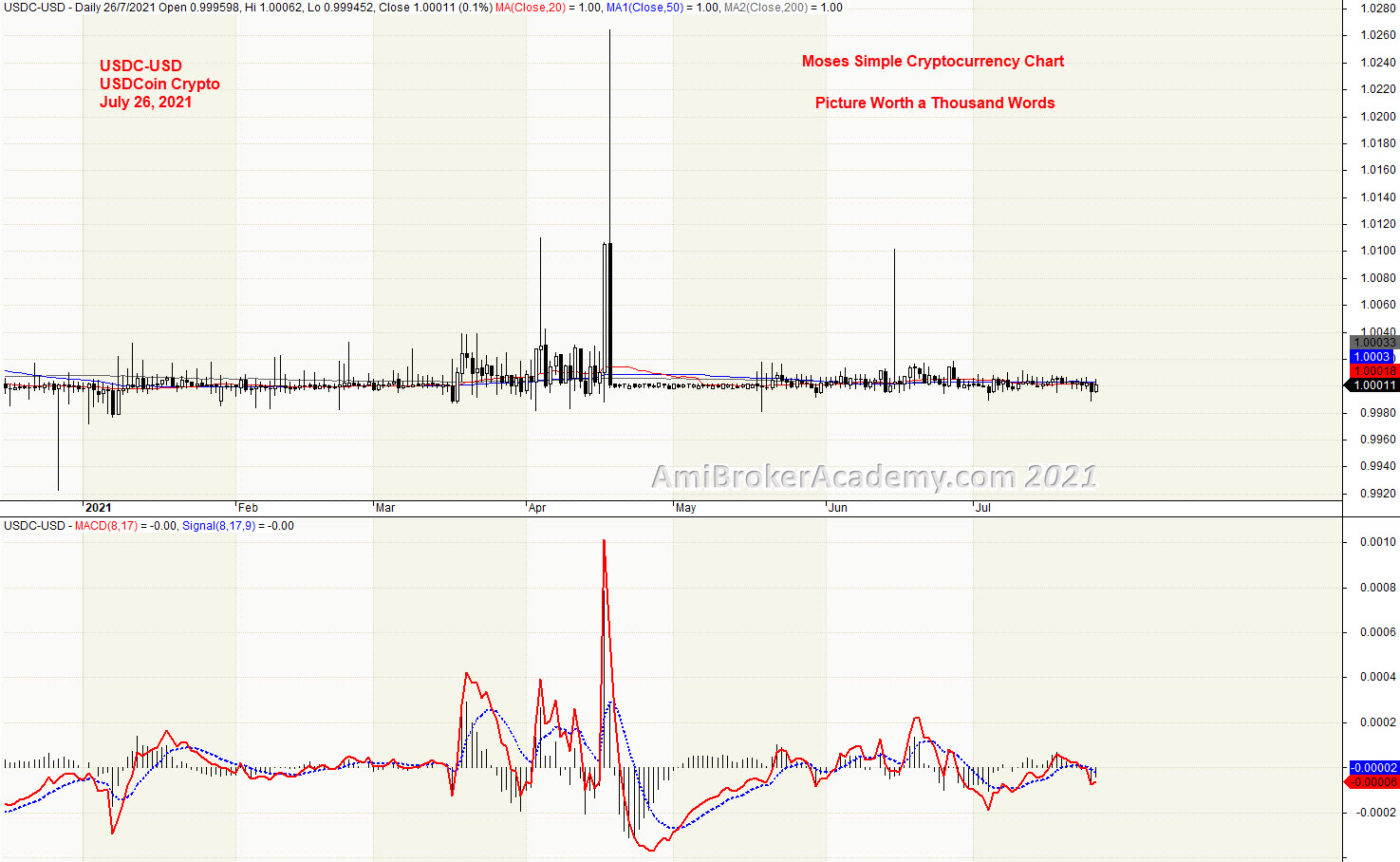
1) USDCoin Crypto and MACD
20210726 USDCoin Crypto and MACD
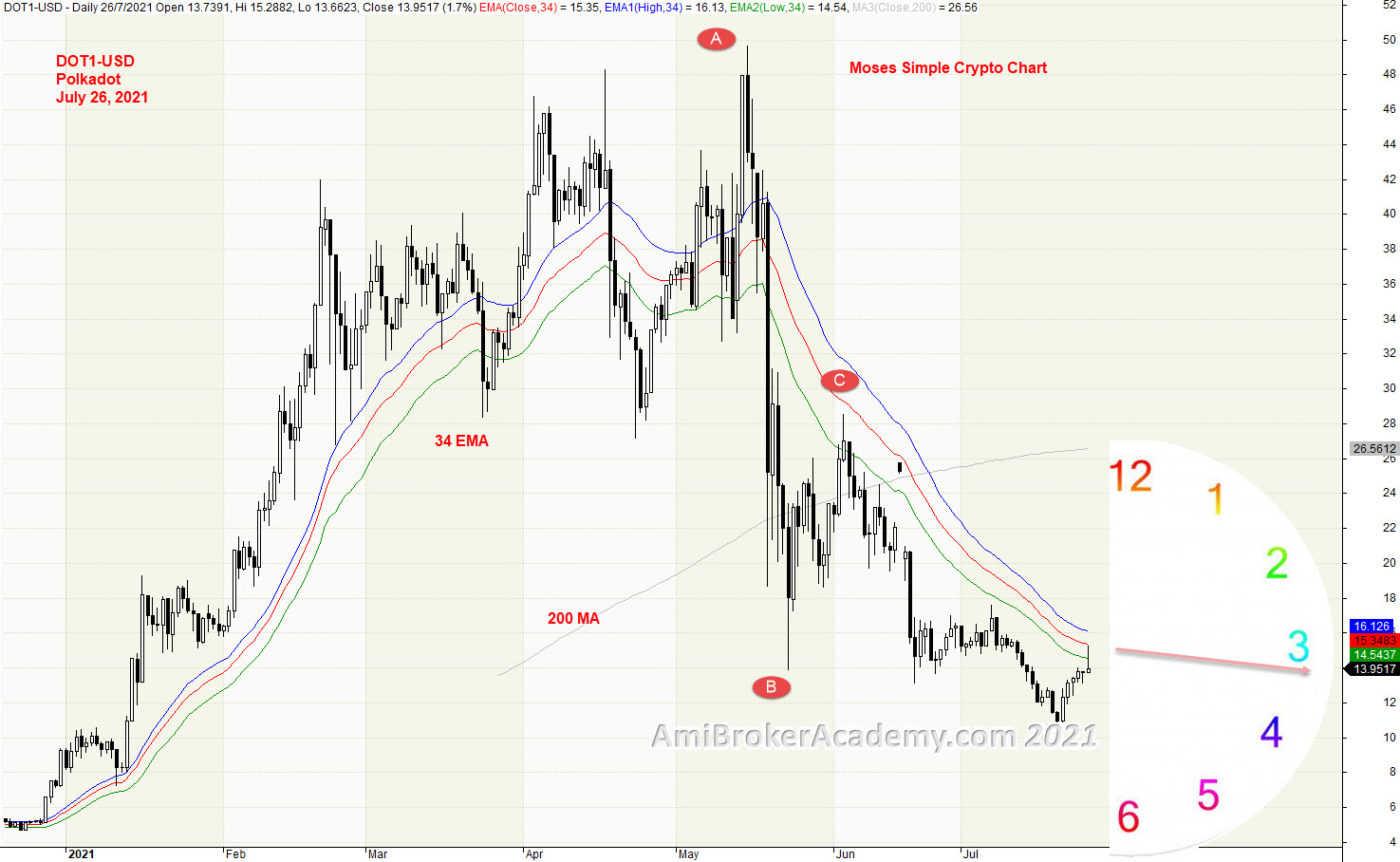
2) Polkadot
20210726 Polkadot and River
3) Bitcoin and Ichimoku Cloud
20210726 Bitcoin and Ichimoku Cloud
4) XRP and Ichimoku Cloud
20210726 XRP Crypto and Ichimoky Cloud
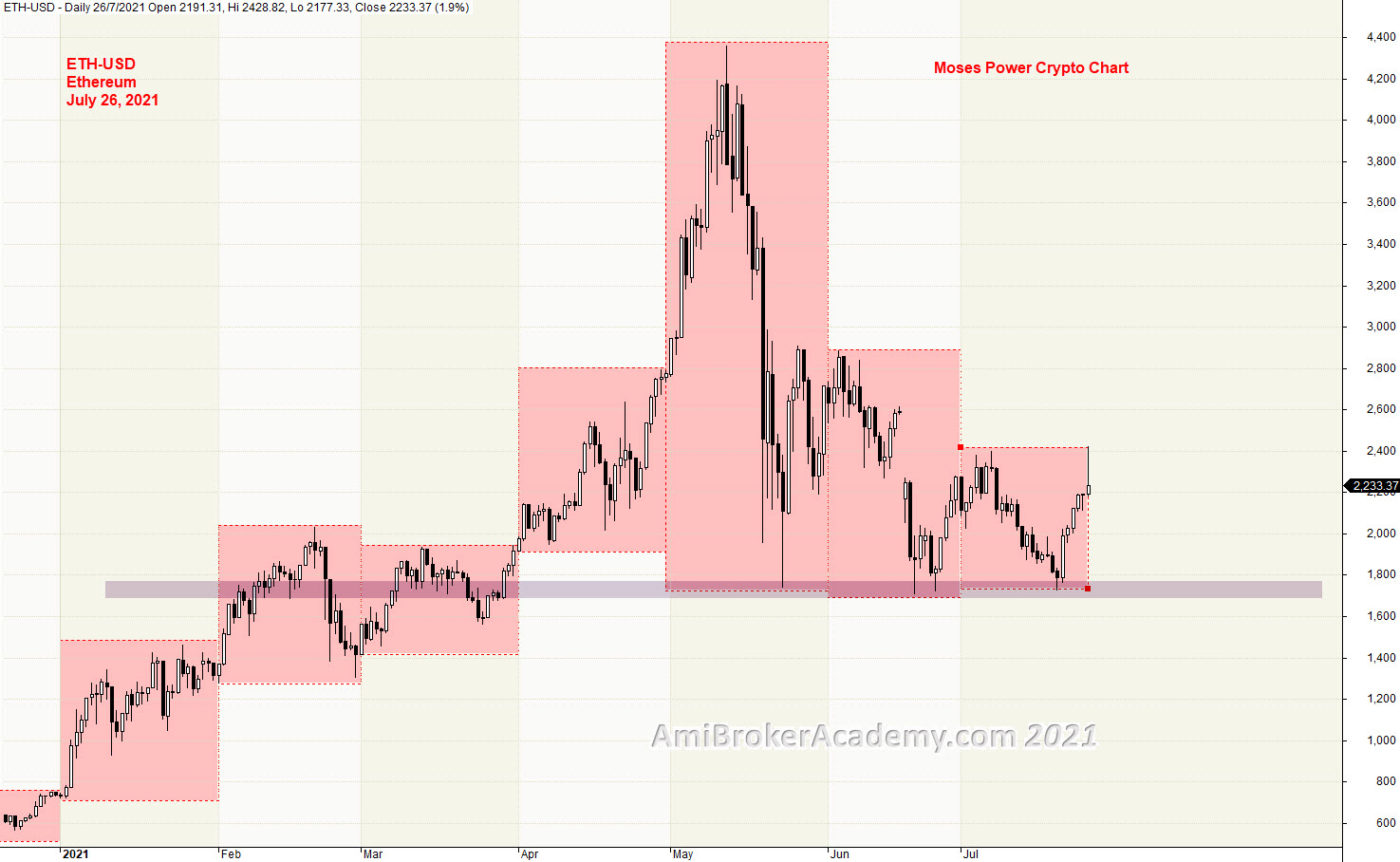
5) Ethereum and support resistance
20210726 Ethereum and support resistance
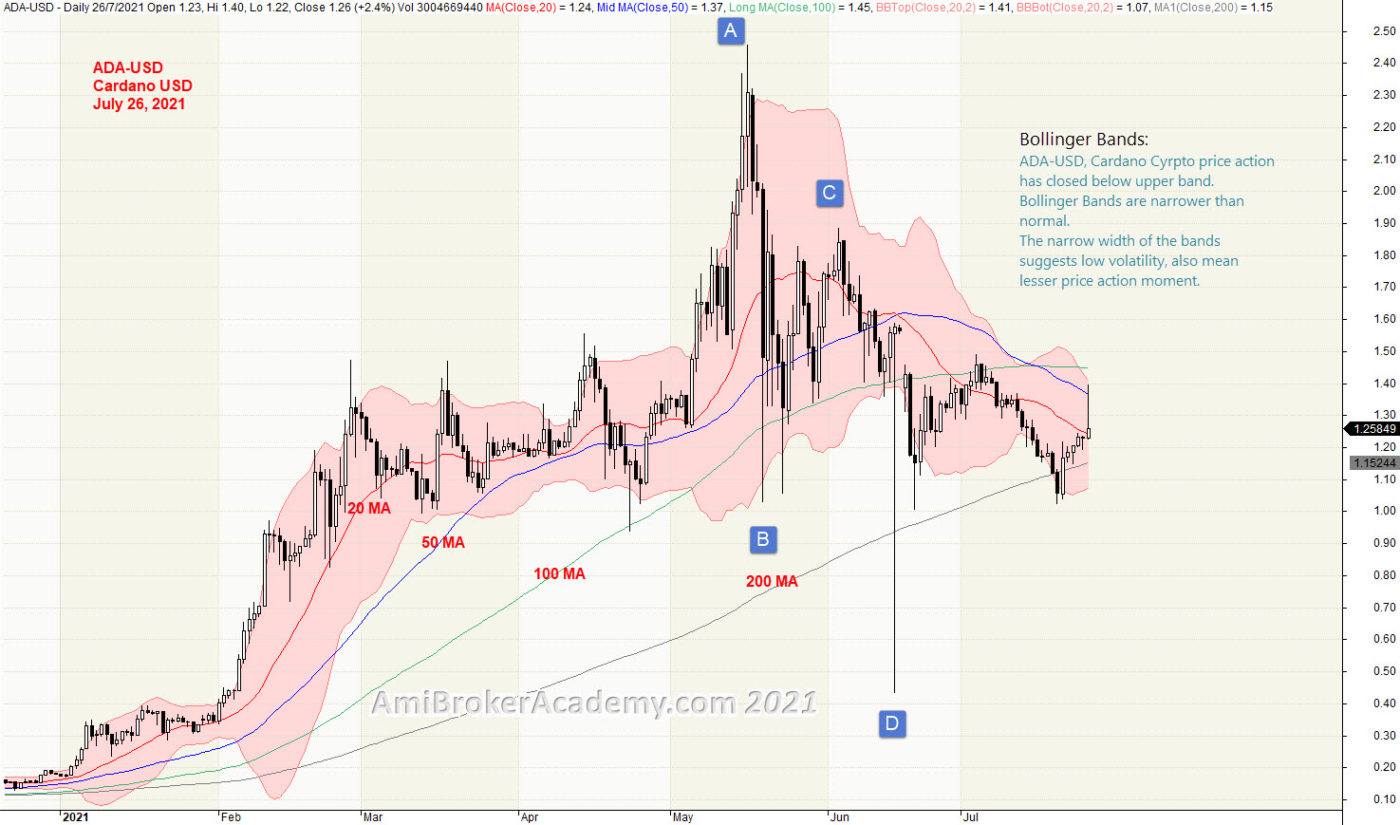
6) Cardano Crypto and Bollinger Bands and Moving Averages
20210726 Cardano Crypto and Bollinger Bands and Moving Averages
7) Stellar USD
20210726 Stellar Crypto and MACD Divergence
8) Uniswap USD
20210726 Uniswap Crypto and Ichimoku
9) Chainlink Crypto and GMMA and Woodies CCI
20210726 Chainlink Crypto and GMMA and Woodies CCI
10) Tether USD
20210726 Tether Crypto and GMMA and Woodies CCI
Moses Power Charting
Official AmiBrokerAcademy.com Charting
Disclaimer
The above result is for illustration purpose. It is not meant to be used for buy or sell decision. We do not recommend any particular stocks. If particular stocks of such are mentioned, they are meant as demonstration of Amibroker as a powerful charting software and MACD. Amibroker can program to scan the stocks for buy and sell signals.
These are script generated signals. Not all scan results are shown here. The MACD signal should use with price action. Users must understand what MACD and price action are all about before using them. If necessary you should attend a course to learn more on Technical Analysis (TA) and Moving Average Convergence Divergence, MACD.
Once again, the website does not guarantee any results or investment return based on the information and instruction you have read here. It should be used as learning aids only and if you decide to trade real money, all trading decision should be your own.
We learn from many past and present great traders. Kudo to these master.
Welcome to AmiBroker Academy dot com, amibrokeracademy.com.
Trading is all probability. You buy or sell from our observation.
Trading is all about observation, reading the price bar and not news. By the time you hear the news it is already old and become history. Why? It is very simple, remember where the news come from? It has first someone release to the news agency like CNBC, and so on. Next, someone has to read the news to you after some research and summarize. This will be few hours later, by then the price action has already done.
As for price bar, it is what the market supply and remand. When market feel that is over price, the price will drop. All this reflected on the price bar almost instantly.
Next is how to read our price bar plus using some tools, such as MACD.
Here, we simply translate price action chart into layman language. This will help you in understand the financial instrument you are trading. We believe picture worth a thousand words. So, sometimes we use less words. You can learn the price action interpretation too. Give it a tray. You may not have the same view points as us. Remember all analysis read price action chart differently. It is just like reading an essay, we will have different conclusion.
Trade well.
Trade what you see. Manage your risk.
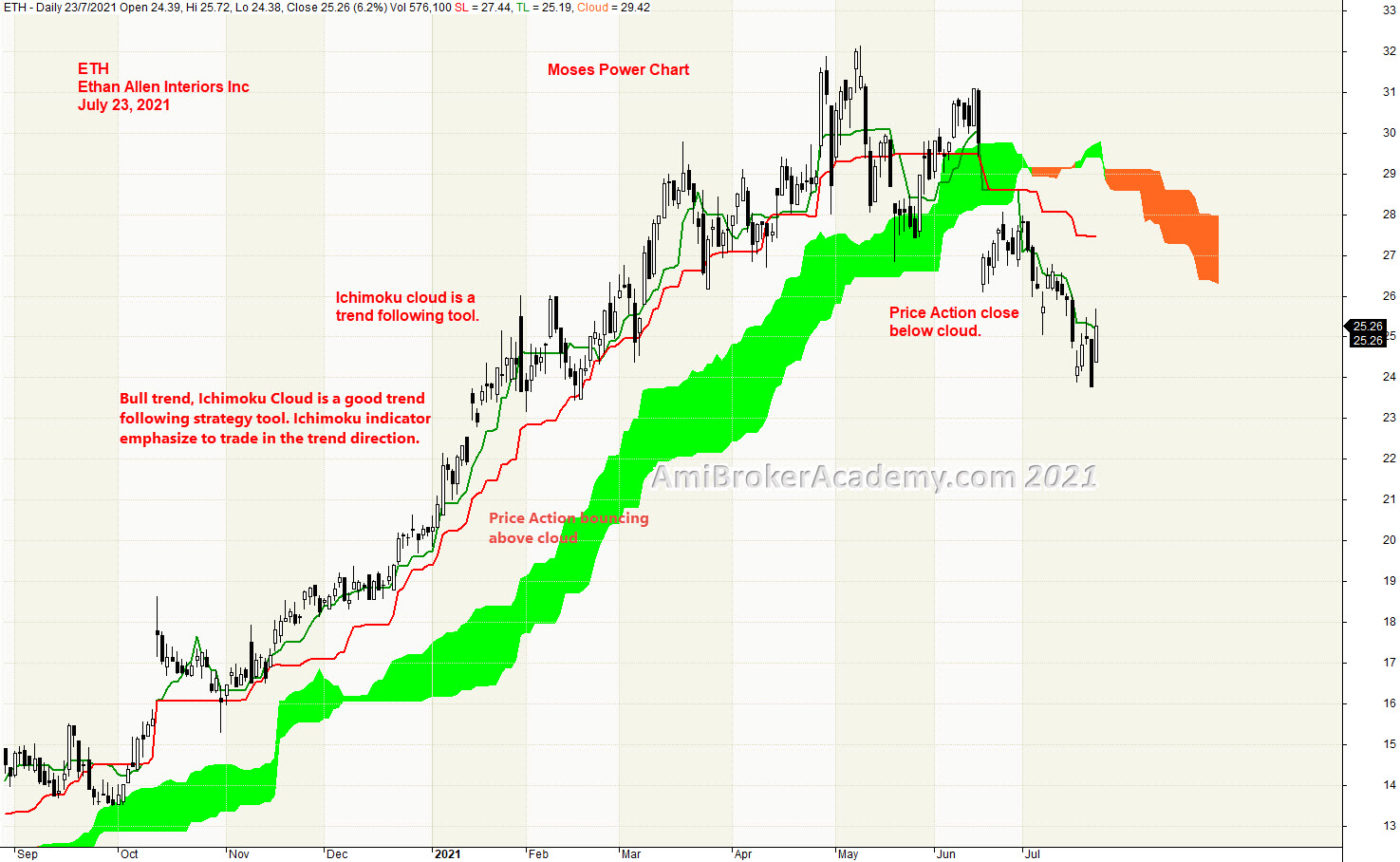
1) Ethan Allen Interiors Inc and Ichimoku Cloud
Ichimoku Cloud is a good trend following strategy tool, can use in any market and any timeframe, cryptocurrency is one of them. Ichimoku indicator emphasize to trade in the trend direction. We see price action stay above the cloud and only pullback after peak in May. Now, price action is below cloud.
Read the price action, price action goes from bottom left to the top of the chart. After May, the price action follow the ABCD pattern begin to pullback and sink below the cloud. Remember, buy support sell resistance. You can use cloud as support or resistance. Now price action get resisted by cloud. Trade what you see.
Ichimoku is a great visual tool to prevent you from trading in the wrong direction. So, Ethan Allen Interiors price action has gone from bull to bear. For those not trading the quick in quick out approach, now is not to buy hold.
Just to recap, Ichimoku Cloud is a multi-dimensional indicator designed to offer support and resistance levels, trending, and entry and exit points. Ichimoku is an indicator that gauges future price momentum and determine futures areas of support and resistance. Price Action is currently sink below and resisted by cloud.
Remember, we just read what the chart said and think. Think think got more things. We do not and can not personalize the price action to your liking. Have fun!
Don’t play play with Ichimoku indicator. Very simple. Very powerful. AmiBrokerAcademy provides you simple and easy to understand charting. Check out more on Moses power stock chart.
20210723 Ethan Allen Interiors Inc and Ichimoku Cloud
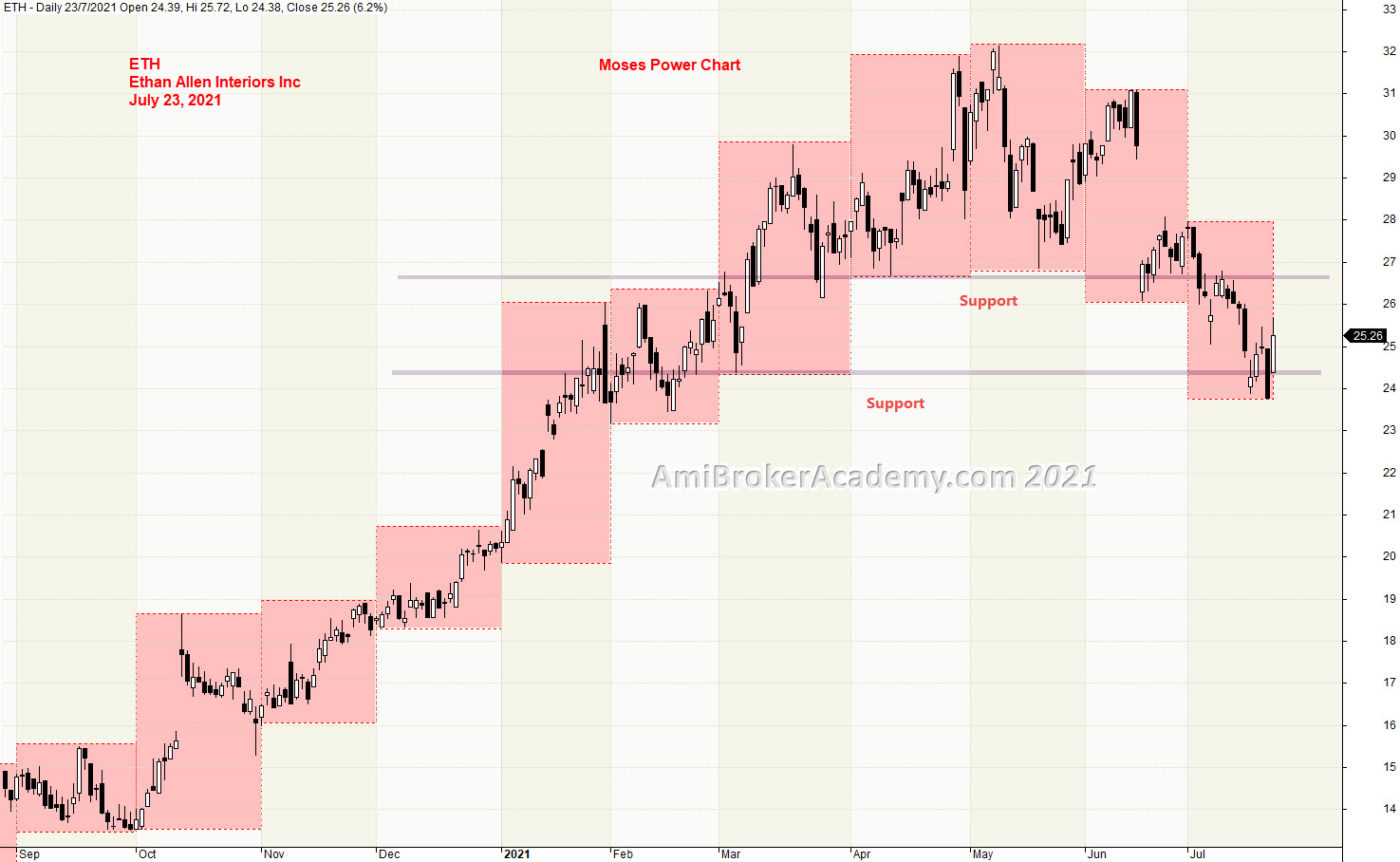
2) Ethan Allen Interiors Inc and Support Resistance
Price Action goes from low to high to low again, here we use month high low to find a solid strong support resistance level. See price action get good support between 24 and 27 dollars level.
From chart, those whom they thought they miss they rush and buy at 27 dollars they got trapped. Trade with eyes open. One secret is when unsure, stand aside a wait. Always reduce risk by buy low sell high, or technically, buy support and sell resistance.
Have fun!
20210723 Ethan Allen Interiors Inc and Support Resistance
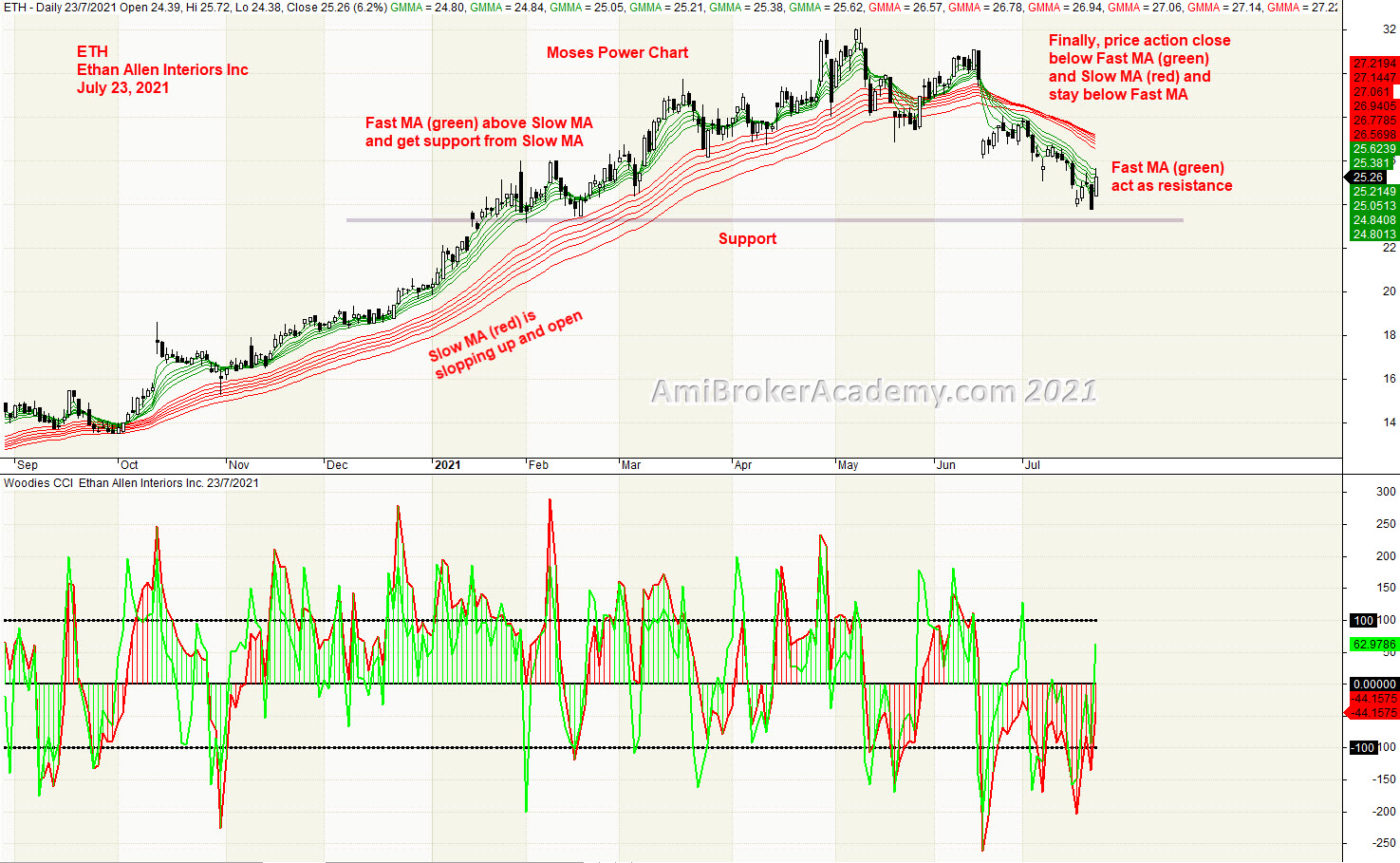
3) Ethan Allen Interiors Inc and GMMA and Woodies CCI
When add GMMA, you could find the green belt go on top of red belt, and green belt start to sink below red in May. Since then the green stay below red. This is the beauty of GMMA, help you to find the bull and the bear trend.
Continue to find low to buy when bull trend. Taking profit when price action get resisted.
Slow MA (red) slops up, bull. Fast MA (green) slops down and go below Slow MA is bear. Trade what you see. Manage your risk.
20210723 Ethan Allen Interiors Inc and GMMA and MA
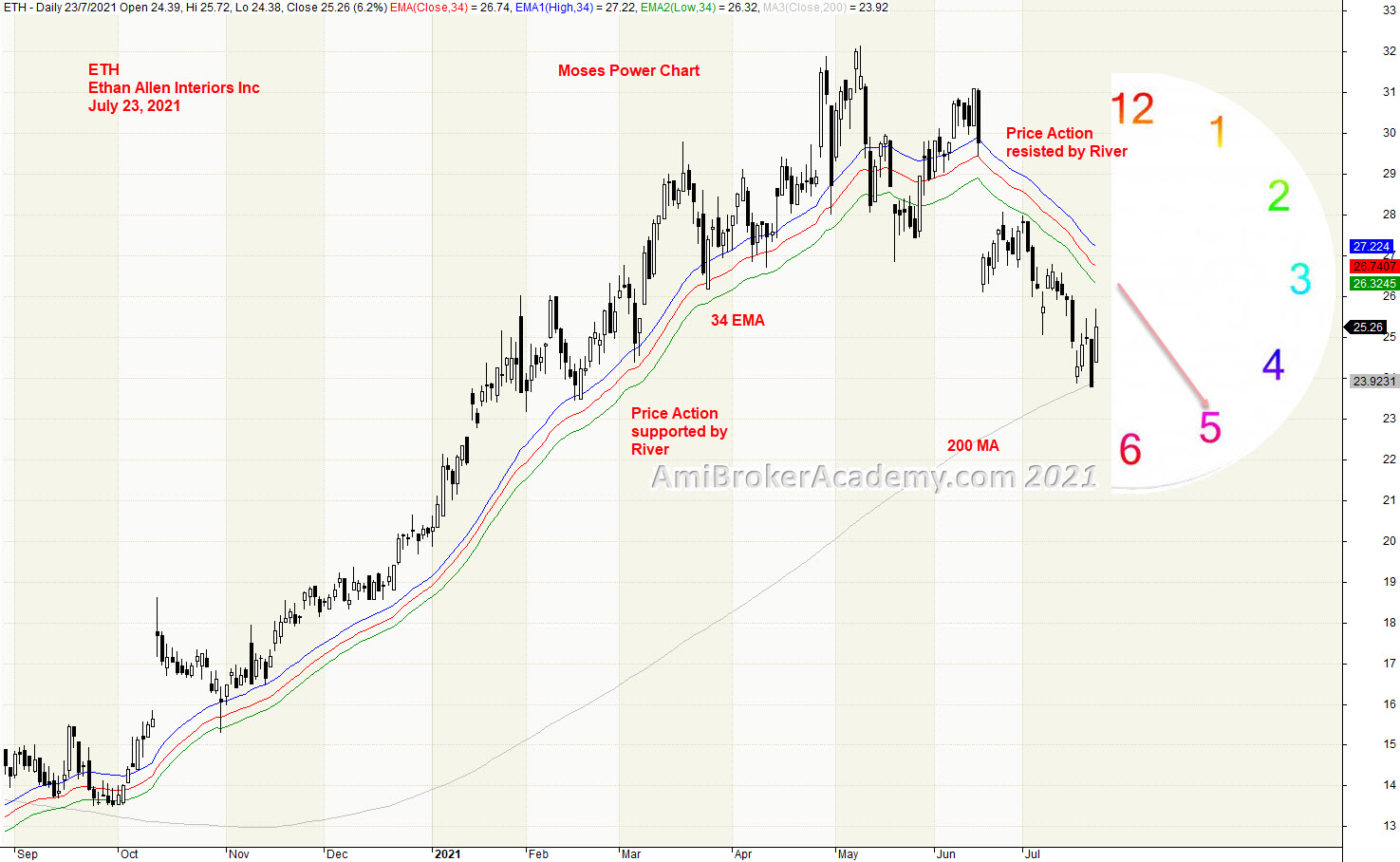
4) Ethan Allen Interiors Inc and River
34 EMA slops up and above 200 MA, bull trend. Price Action should also stay above the River at this point. Raghee uses 34 EMA, high, low and close to see the wave direction,
Price Action crosses and closes below River, in May. Price Action try to breakout River but fail. River act as resistance to keep the price action at bay. Price Action has tested the resistance, River a few times. River is slopping down, bear. Bear trending at the moment. Trade with eyes open.
20210723 Ethan Allen Interiors Inc and River
Moses Power Charting
Official AmiBrokerAcademy.com Charting
Disclaimer
The above result is for illustration purpose. It is not meant to be used for buy or sell decision. We do not recommend any particular stocks. If particular stocks of such are mentioned, they are meant as demonstration of Amibroker as a powerful charting software and MACD. Amibroker can program to scan the stocks for buy and sell signals.
These are script generated signals. Not all scan results are shown here. The MACD signal should use with price action. Users must understand what MACD and price action are all about before using them. If necessary you should attend a course to learn more on Technical Analysis (TA) and Moving Average Convergence Divergence, MACD.
Once again, the website does not guarantee any results or investment return based on the information and instruction you have read here. It should be used as learning aids only and if you decide to trade real money, all trading decision should be your own.
We learn from many past and present great traders. Kudo to these master.
Welcome to AmiBroker Academy dot com, amibrokeracademy.com.
Trading is all probability. You buy or sell from our observation.
Trading is all about observation, reading the price bar and not news. By the time you hear the news it is already old and become history. Why? It is very simple, remember where the news come from? It has first someone release to the news agency like CNBC, and so on. Next, someone has to read the news to you after some research and summarize. This will be few hours later, by then the price action has already done.
As for price bar, it is what the market supply and remand. When market feel that is over price, the price will drop. All this reflected on the price bar almost instantly.
Next is how to read our price bar plus using some tools, such as MACD.
Here, we simply translate price action chart into layman language. This will help you in understand the financial instrument you are trading. We believe picture worth a thousand words. So, sometimes we use less words. You can learn the price action interpretation too. Give it a tray. You may not have the same view points as us. Remember all analysis read price action chart differently. It is just like reading an essay, we will have different conclusion.
Trade well.
Trade what you see. Manage your risk.
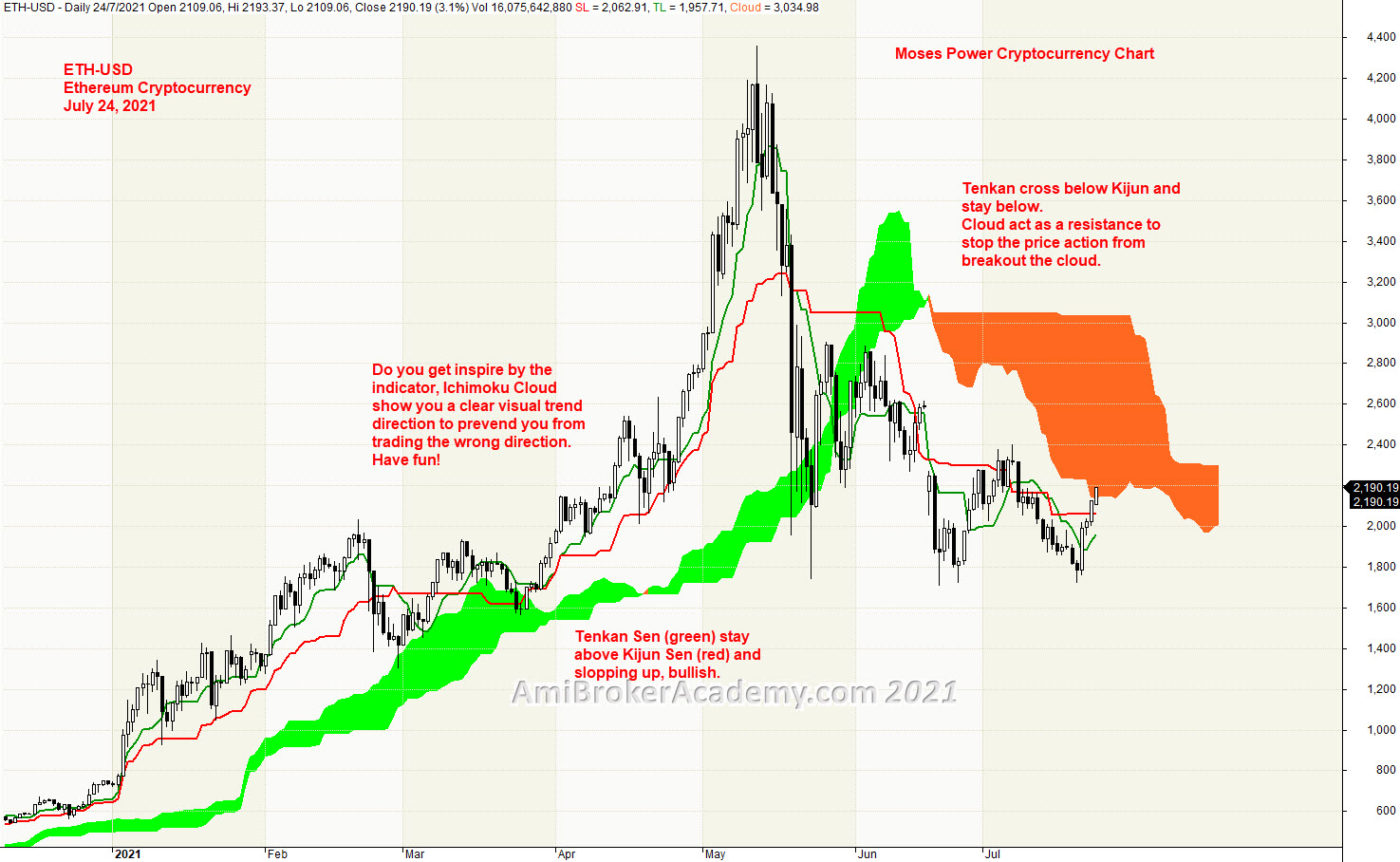
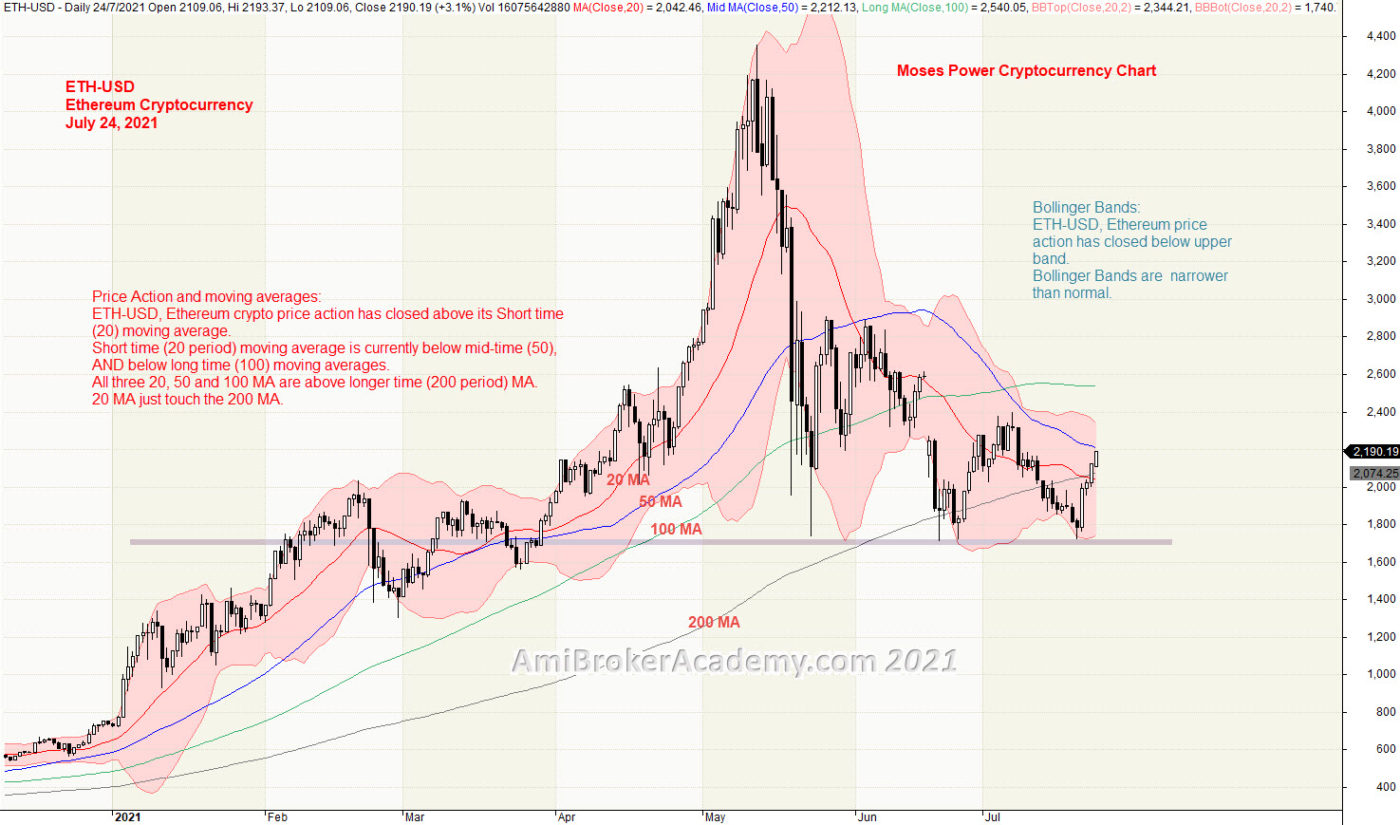
1) Ethereum Cryptocurrency and Ichimoku Cloud
Ichimoku Cloud is a good trend following strategy tool, can use in any market and any timeframe, cryptocurrency is one of them. Ichimoku indicator emphasize to trade in the trend direction. We see price action stay above the cloud and only pullback after peak in May. Now, price action is below cloud.
Read the price action, price action goes from bottom left to the top of the chart. After May, the price action begin to pullback and sink below the cloud. Remember one thing, buy support sell resistance. You can use cloud as resistance when it is in a bear trending. Trade what you see.
Ichimoku is a great visual tool too, to help keep you not trading in the wrong direction. So, Ethereum Crypto has gone from bull to bear. For those not trading the quick in quick out approach, now is not the time to buy hold.
Just to recap, Ichimoku Cloud is a multi-dimensional indicator designed to offer support and resistance levels, trending, and entry and exit points. Ichimoku is an indicator that gauges future price momentum and determine futures areas of support and resistance. Price Action is currently sink below and resisted by cloud.
Remember, we just read what the chart said and think. Think think got more things. We do not and can not personalize the price action to your liking. Have fun!
Don’t play play with Ichimoku indicator. Very simple. Very powerful. AmiBrokerAcademy provides you simple and easy to understand charting. Check out more on Moses power stock chart.
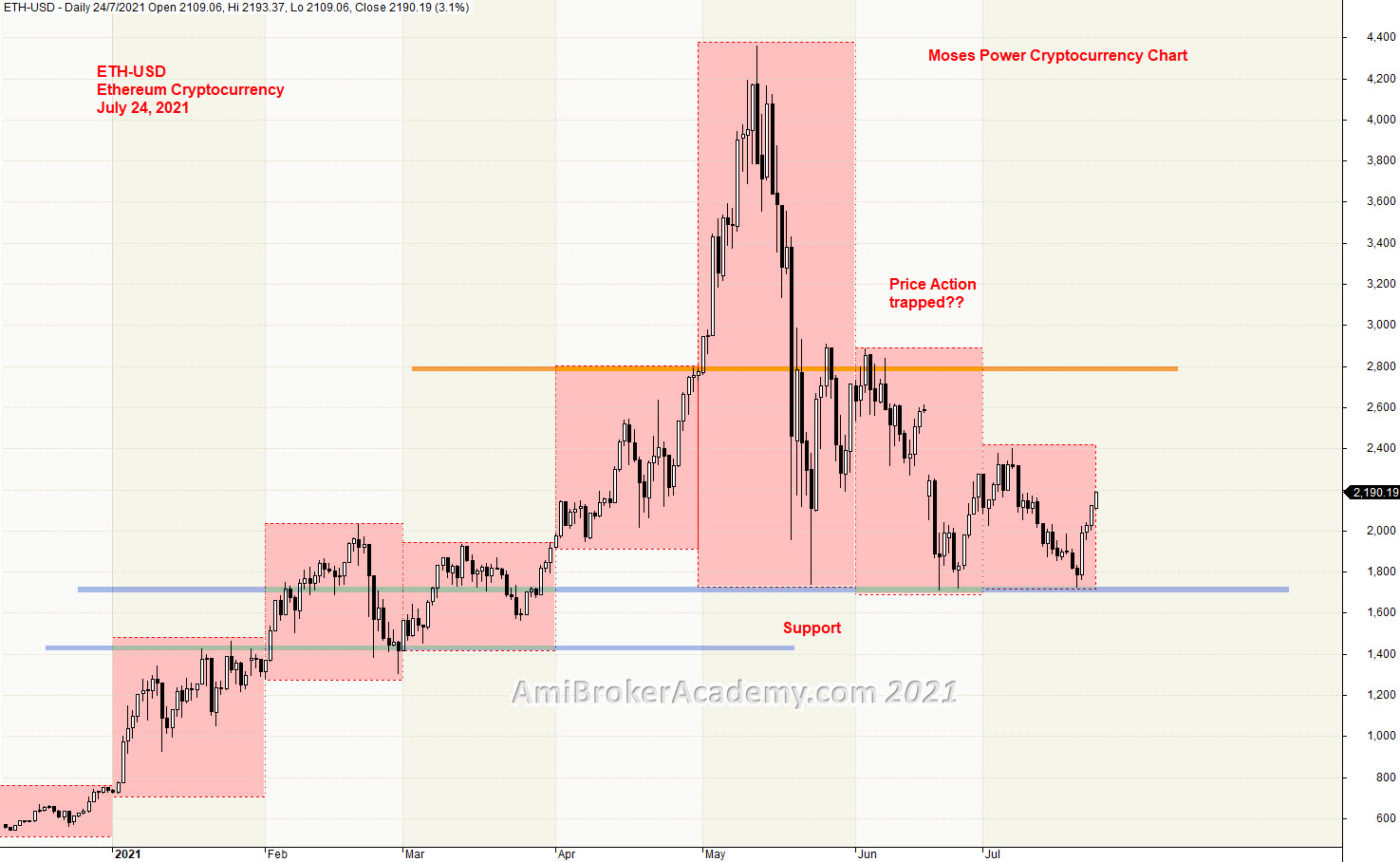
2) Ethereum Cryptocurrency and Support Resistance
Price Action goes from low to high to low again, here use month high low to find a solid strong support resistance level. See price action get good support between 1,600 and 1,800 dollars level.
From chart, those whom they thought they miss the buy and rush in to buy at 2,800 dollars they got trapped. Trade with eyes open. When unsure, stand aside a wait. Always reduce risk by buy low sell high, or technically, buy support and sell resistance.
Have fun!
20210724 Ethereum Cryptocurrency and Support Resistance
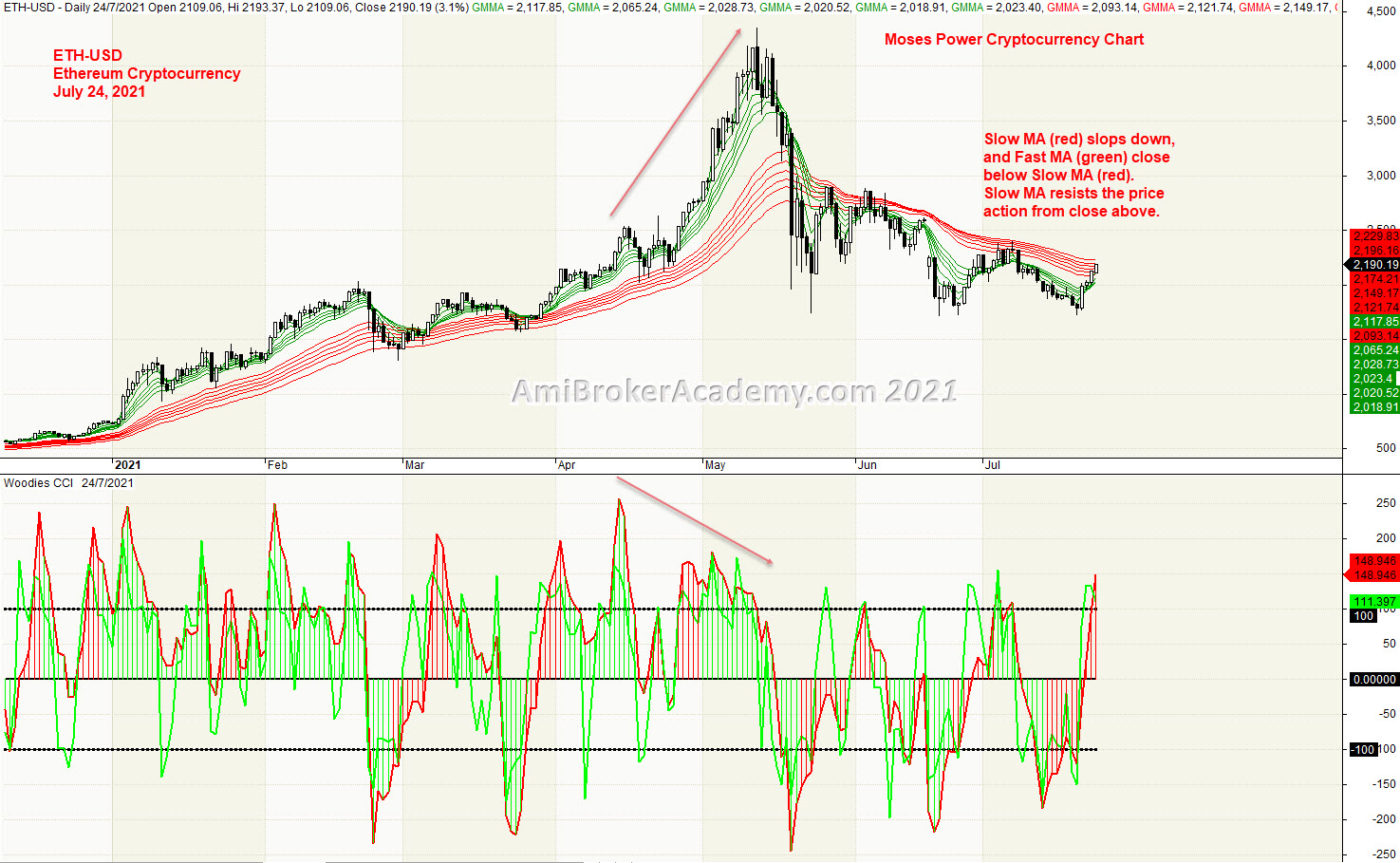
3) Ethereum Cryptocurrency and GMMA and Woodies CCI
When add GMMA, you could find the green belt go on top of red belt, and green belt sink below red in May. Since then the green stay below red. This is the beauty of GMMA, help you to find the bull and the bear trend.
Slow MA (red) slops up and stay below, bull. Fast MA (green) slops down and go below Slow MA is bear. Trade what you see. Manage your risk.
20210724 Ethereum Cryptocurrency and GMMA and Woodies CCI
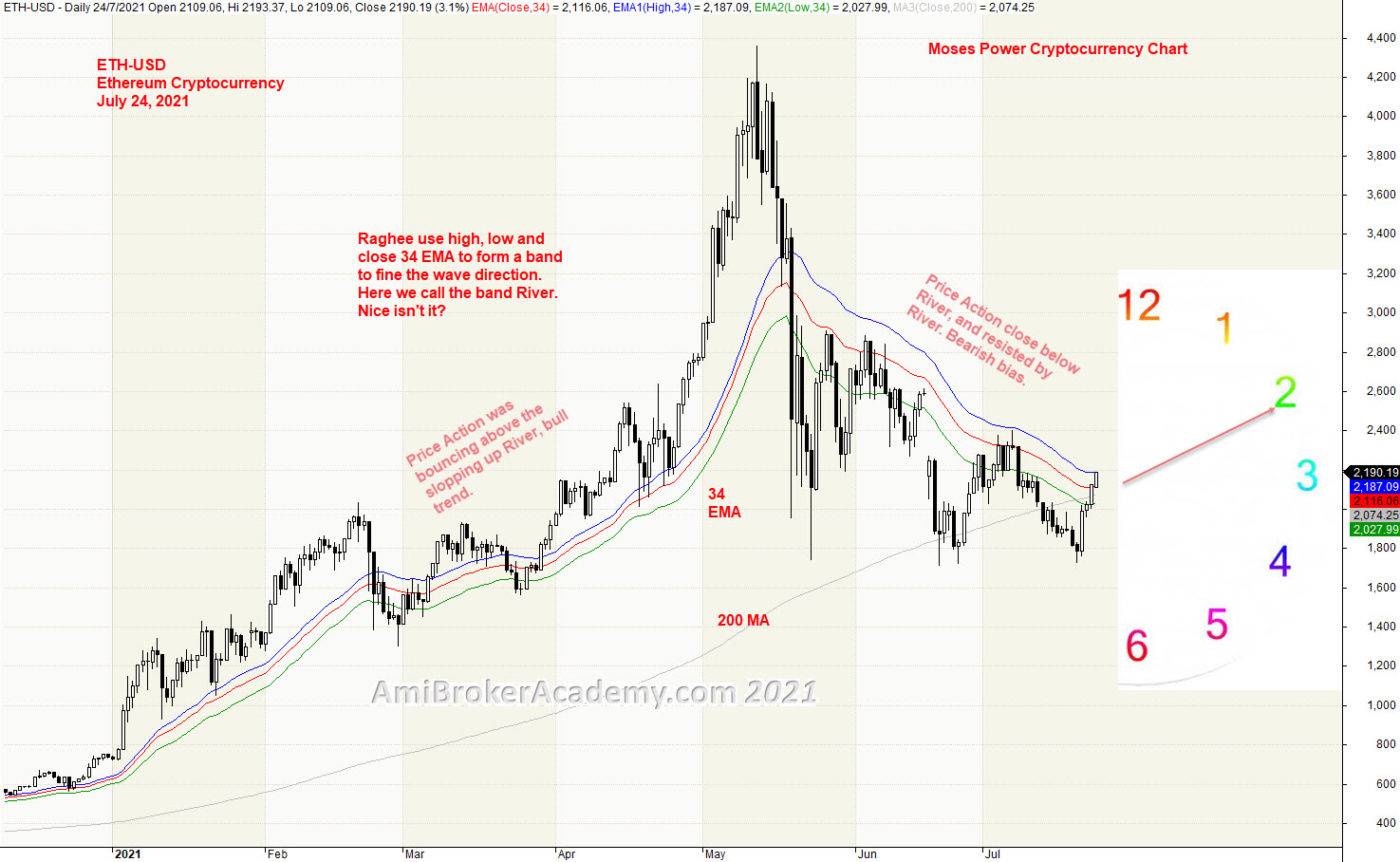
4) Ethereum Cryptocurrency and River
34 EMA slops up and above 200 MA, bull trend. Price Action should also stay above the River at this point. Raghee uses 34 EMA, high, low and close to see the wave direction,
Price Action crosses and closes below River, in May. Price Action try to breakout River but fail. River act as resistance to keep the price action at bay. Price Action has tested the resistance, River a few times. River is slopping down, bear. Bear trending at the moment. Trade with eyes open.
20210724 Ethereum Cryptocurrency and River
5) Ethereum Cryptocurrency and Bollinger Bands and MA
Bollinger Bands is a very powerful tool, it envelop the price action. When the price action is near upper band, you know you can buy, when price action is at the bottom near lower band, you know sell is the safe bet. Bollinger Bands contract and expand, it goes from low volatility to high.
20210724 Ethereum Cryptocurrency and Bollinger Bands and MA
6) Ethereum Cryptocurrency and MACD
MACD is a simple and powerful tool. When MACD cross down signal, it gives you an idea that the price is weaken. It is just like traffic light, you don’t stop at every traffic light, But, the traffic light let you know that you need to stop at the change of light, from green to red.
So, when the MACD cross down signal, be ready to sell. Wait for bear confirmation, it can be bear candlestick, bear chart pattern and so on. Manage your risk and trade with eyes open.
You do not have to wait for news. It is too late! Begin to trade price action with some simple indicator, like MACD.
Compare two cryptocurrencies you find the Bitcoin Crypto is leading the way. Picture is worth a thousand words. Have fun!
20210724 Ethereum Crypto and Bitcoin Crypto Correlation
Moses Power Charting
Official AmiBrokerAcademy.com Charting
Disclaimer
The above result is for illustration purpose. It is not meant to be used for buy or sell decision. We do not recommend any particular stocks. If particular stocks of such are mentioned, they are meant as demonstration of Amibroker as a powerful charting software and MACD. Amibroker can program to scan the stocks for buy and sell signals.
These are script generated signals. Not all scan results are shown here. The MACD signal should use with price action. Users must understand what MACD and price action are all about before using them. If necessary you should attend a course to learn more on Technical Analysis (TA) and Moving Average Convergence Divergence, MACD.
Once again, the website does not guarantee any results or investment return based on the information and instruction you have read here. It should be used as learning aids only and if you decide to trade real money, all trading decision should be your own.
We learn from many past and present great traders. Kudo to these master.
Welcome to AmiBroker Academy dot com, amibrokeracademy.com.
We sometime bench mark two stock price action or stock price with index, but this time we benchmark two cryptocurrencies, Ethereum and Bitcoin. The following example, we benchmark two Information Technology key players, MSFT and INTC. Besides correlation we use other tools such as 1) Ichimoku Cloud, 2) Support Resistance (using box), 3) River (moving average), 4) GMMA and Woodies CCI, 5) Bollinger Bands and Moving Averages, and 6) MACD to analyze chart. See our simple reading of price action.
We also apply wave theory onto chart. Such as well know Elliott Waves. Just in case you are not familiar with Elliott Waves. Elliott was from Ralph Nelson Elliott.
Otherwise, we like to use pattern, such as ABCD pattern. Checkout our posting here for more.
We translate price action chart into layman language. This will help you in understand the financial instrument you are trading. We believe picture worth a thousand words. So, sometimes we use less words. You can learn the price action interpretation too. Give it a tray. You may not have the same view points as us. Remember all analysis read price action chart differently. It is just like reading an essay, we will have different conclusion.
Trade what you see. Manage your risk. Trade well.
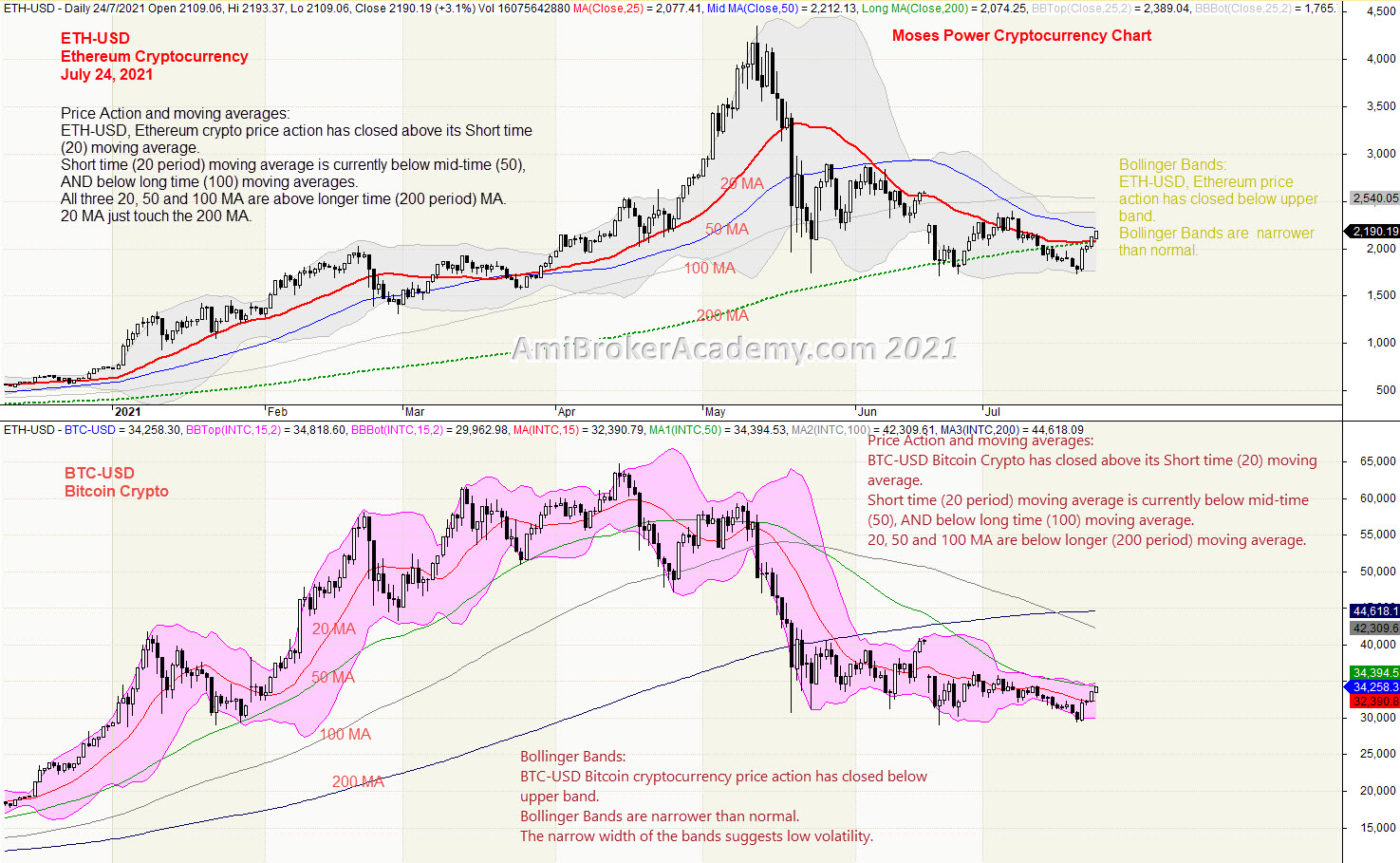
1) Ethereum and Bitcoin Cryptocurrency Bollinger Bands and Moving Averages Correlation
We study price action we see Ethereum Crypto price action continues to go higher from the start of 2021 by after the peak in May price action begin to reverse. Price Action pullback and resisted by 20 MA. Bitcoin the first cryptocurrency price action struggle to stay above the high, but eventually pullback. Price Action pullback one month earlier than Ethereum. For Bitcoin the price action goes lower than 200 MA.
ETH
Price Action and moving averages: ETH-USD, Ethereum crypto price action has closed above its Short time (20) moving average. Short time (20 period) moving average is currently below mid-time (50), AND below long time (100) moving averages. All three 20, 50 and 100 MA are above longer time (200 period) MA. 20 MA just touch the 200 MA.
Bollinger Bands: ETH-USD, Ethereum price action has closed below upper band. Bollinger Bands are narrower than normal.
Bitcoin
Price Action and moving averages: BTC-USD Bitcoin Crypto has closed above its Short time (20) moving average. Short time (20 period) moving average is currently below mid-time (50), AND below long time (100) moving average. 20, 50 and 100 MA are below longer (200 period) moving average.
Bollinger Bands: BTC-USD Bitcoin cryptocurrency price action has closed below upper band. Bollinger Bands are narrower than normal. The narrow width of the bands suggests low volatility.
Remember, we just read what the chart said. Have fun!
20210724 Ethereum Crypto and Bitcoin Crypto Correlation
Moses Power Charting
Official AmiBrokerAcademy.com Charting
Disclaimer
The above result is for illustration purpose. It is not meant to be used for buy or sell decision. We do not recommend any particular stocks. If particular stocks of such are mentioned, they are meant as demonstration of Amibroker as a powerful charting software and MACD. Amibroker can program to scan the stocks for buy and sell signals.
These are script generated signals. Not all scan results are shown here. The MACD signal should use with price action. Users must understand what MACD and price action are all about before using them. If necessary you should attend a course to learn more on Technical Analysis (TA) and Moving Average Convergence Divergence, MACD.
Once again, the website does not guarantee any results or investment return based on the information and instruction you have read here. It should be used as learning aids only and if you decide to trade real money, all trading decision should be your own.
We learn from many past and present great traders. Kudo to these master.
Welcome to AmiBroker Academy dot com, amibrokeracademy.com.
Trading is all probability. You buy or sell from our observation.
Trading is all about observation, reading the price bar and not news. By the time you hear the news it is already old and become history. Why? It is very simple, remember where the news come from? It has first someone release to the news agency like CNBC, and so on. Next, someone has to read the news to you after some research and summarize. This will be few hours later, by then the price action has already done.
As for price bar, it is what the market supply and remand. When market feel that is over price, the price will drop. All this reflected on the price bar almost instantly.
Next is how to read our price bar plus using some tools, such as MACD.
Here, we simply translate price action chart into layman language. This will help you in understand the financial instrument you are trading. We believe picture worth a thousand words. So, sometimes we use less words. You can learn the price action interpretation too. Give it a tray. You may not have the same view points as us. Remember all analysis read price action chart differently. It is just like reading an essay, we will have different conclusion.
Trade well.
Trade what you see. Manage your risk.
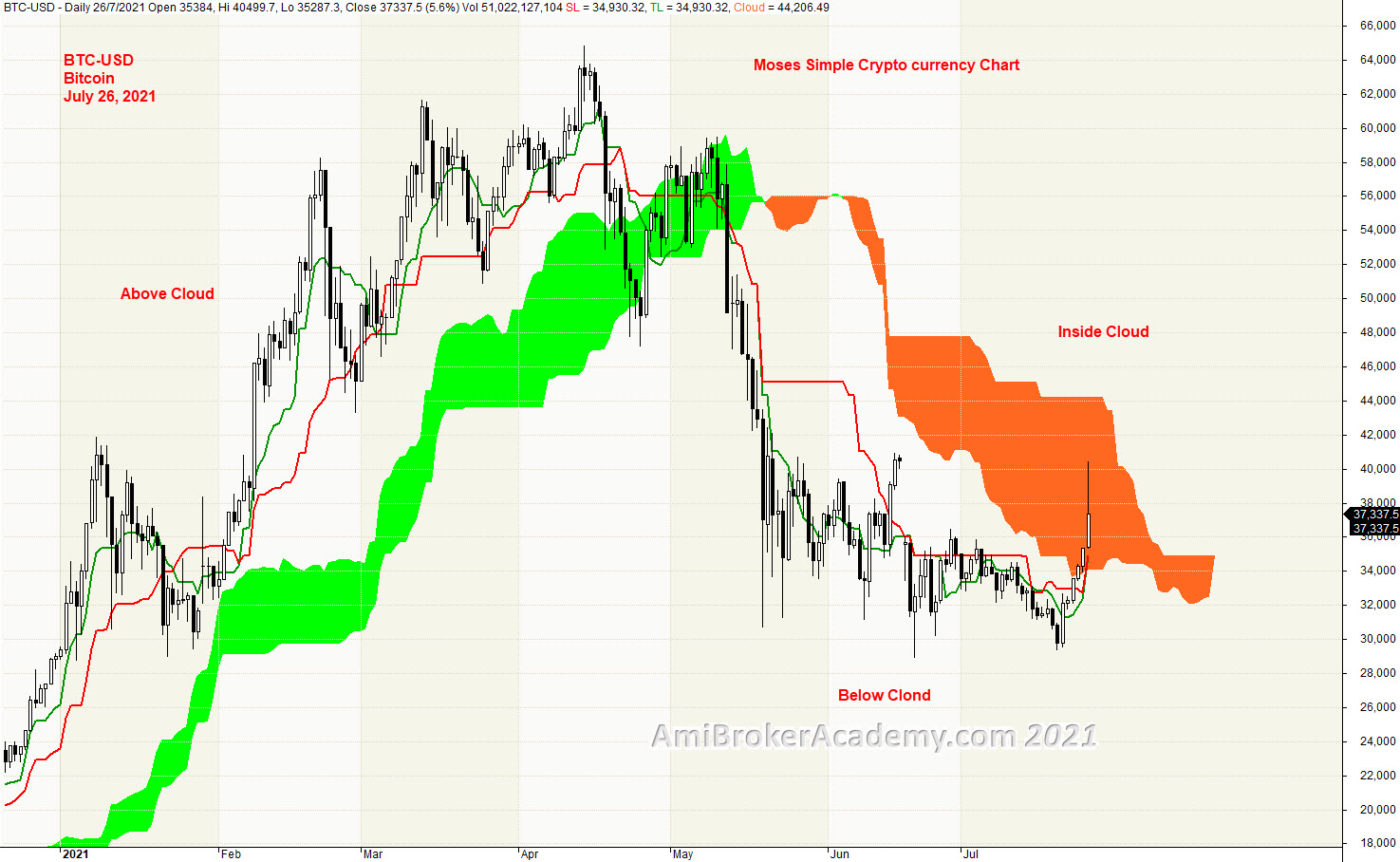
1) Bitcoin and Ichimoku Cloud
Ichimoku Cloud is a good trend following strategy tool, can use in any market and any timeframe, cryptocurrency is one of them. Ichimoku indicator emphasize to trade in the trend direction. We see price action stay above the cloud and only pullback after peak in April. Now, price action is below cloud.
Read the price action goes from bottom left to the top of the chart. After April, the price action pullback and sink below cloud. Remember one thing, buy support sell resistance. You can use cloud as resistance when it is in bear trending. Trade what you see.
Ichimoku is a great visual tool too, to help keep you not trading in the wrong direction.
Besides that, Ichimoku Cloud is a multi-dimensional indicator designed to offer support and resistance levels, trending, and entry and exit points. Ichimoku is an indicator that gauges future price momentum and determine futures areas of support and resistance. Price Action is currently sink below and resisted by cloud. Price Action resisted? Will see.
Remember, we just read what the chart said. We do not and can not personalize the price action to your liking. Have fun!
Don’t play play with Ichimoku indicator. Very simple. Yet powerful. AmiBrokerAcademy provides you simple yet easy to understand stock chart. Check out Moses power stock chart.
20210724 Bitcoin and Ichimoku Cloud
Moses Power Charting
Official AmiBrokerAcademy.com Charting
Disclaimer
The above result is for illustration purpose. It is not meant to be used for buy or sell decision. We do not recommend any particular stocks. If particular stocks of such are mentioned, they are meant as demonstration of Amibroker as a powerful charting software and MACD. Amibroker can program to scan the stocks for buy and sell signals.
These are script generated signals. Not all scan results are shown here. The MACD signal should use with price action. Users must understand what MACD and price action are all about before using them. If necessary you should attend a course to learn more on Technical Analysis (TA) and Moving Average Convergence Divergence, MACD.
Once again, the website does not guarantee any results or investment return based on the information and instruction you have read here. It should be used as learning aids only and if you decide to trade real money, all trading decision should be your own.
We learn from many past and present great traders. Kudo to these master.
Welcome to AmiBroker Academy dot com, amibrokeracademy.com.
Trading is all probability. You buy or sell from our observation.
Trading is all about observation, reading the price bar and not news. By the time you hear the news it is already old and become history. Why? It is very simple, remember where the news come from? It has first someone release to the news agency like CNBC, and so on. Next, someone has to read the news to you after some research and summarize. This will be few hours later, by then the price action has already done.
As for price bar, it is what the market supply and remand. When market feel that is over price, the price will drop. All this reflected on the price bar almost instantly.
Next is how to read our price bar plus using some tools, such as MACD.
Here, we simply translate price action chart into layman language. This will help you in understand the financial instrument you are trading. We believe picture worth a thousand words. So, sometimes we use less words. You can learn the price action interpretation too. Give it a tray. You may not have the same view points as us. Remember all analysis read price action chart differently. It is just like reading an essay, we will have different conclusion.
Trade well.
Trade what you see. Manage your risk.
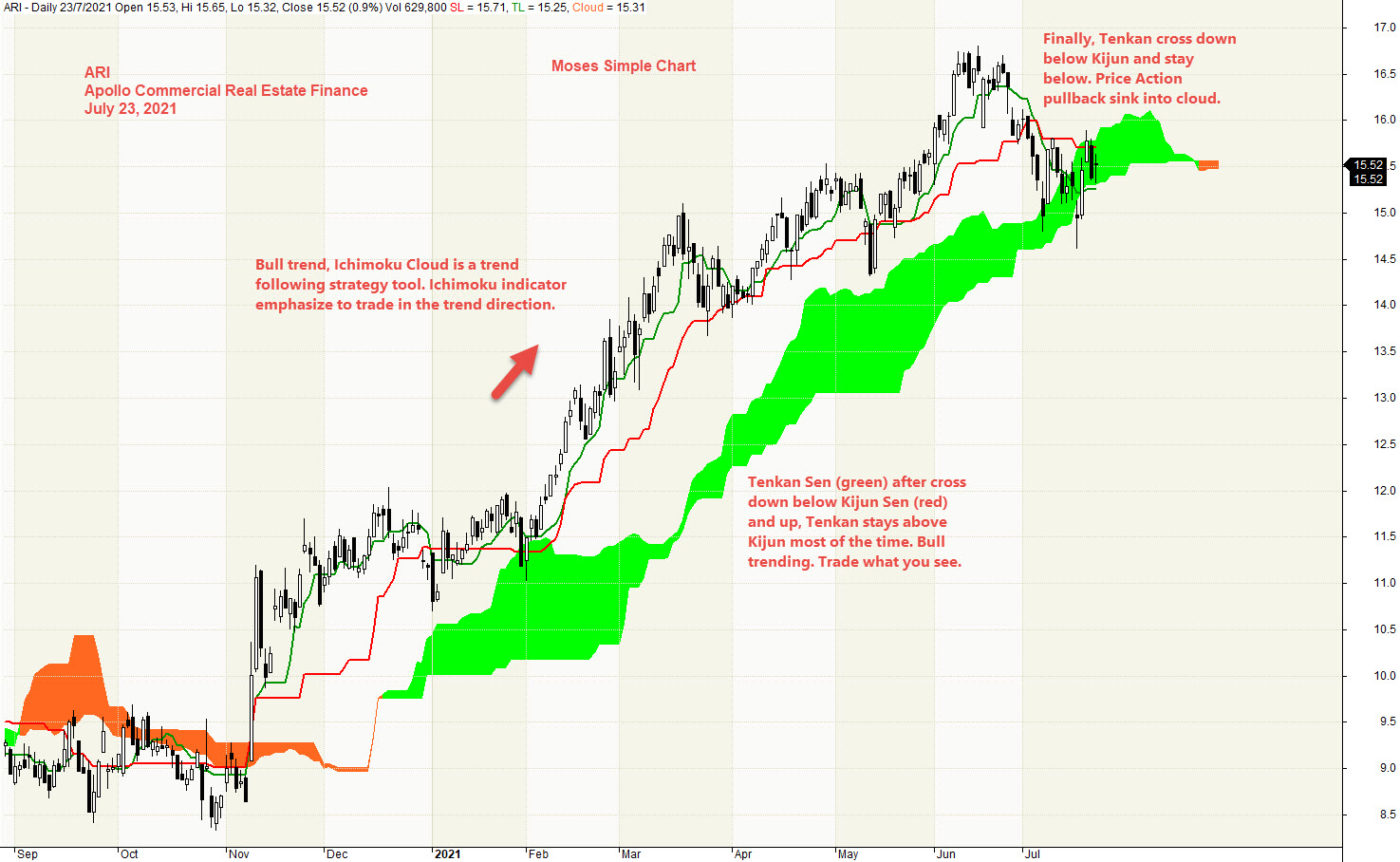
1) Apollo Commercial Real Estate Finance and Ichimoku Cloud
Ichimoku Cloud is a good trend following strategy tool, can use in any market and any timeframe. Ichimoku indicator emphasize to trade in the trend direction. We see price action emerge from below the cloud and then begin to stay above. Bull trend.
Read the price action goes from bottom left below the cloud to top right of the chart and above cloud. Only the last part, the price action pullback and sink inside cloud. Price action bounce above cloud most of the time. Remember one thing, buy support sell resistance. You can use cloud as support when it is in bull trending. Trade what you see.
Ichimoku is a great visual tool too, to help keep you not trading in the wrong direction.
Besides that, Ichimoku Cloud is a multi-dimensional indicator designed to offer support and resistance levels, trending, and entry and exit points. Ichimoku is an indicator that gauges future price momentum and determine futures areas of support and resistance. Price Action is currently sink inside cloud. Price Action supported? Will see.
Remember, we just read what the chart said. We do not and can not personalize the price action to your liking. Have fun!
Don’t play play with Ichimoku indicator. Very simple. Yet powerful. AmiBrokerAcademy provides you simple yet easy to understand stock chart. Check out Moses power stock chart.
20210723 Apollo Commercial Real Estate Finance and Ichimoku Cloud
Moses Power Charting
Official AmiBrokerAcademy.com Charting
Disclaimer
The above result is for illustration purpose. It is not meant to be used for buy or sell decision. We do not recommend any particular stocks. If particular stocks of such are mentioned, they are meant as demonstration of Amibroker as a powerful charting software and MACD. Amibroker can program to scan the stocks for buy and sell signals.
These are script generated signals. Not all scan results are shown here. The MACD signal should use with price action. Users must understand what MACD and price action are all about before using them. If necessary you should attend a course to learn more on Technical Analysis (TA) and Moving Average Convergence Divergence, MACD.
Once again, the website does not guarantee any results or investment return based on the information and instruction you have read here. It should be used as learning aids only and if you decide to trade real money, all trading decision should be your own.
We learn from many past and present great traders. Kudo to these master.
Welcome to AmiBroker Academy dot com, amibrokeracademy.com.
Secret Code
Many don’t like our style of analysis. The analysis is not for everyone. One key in trading is to how to manage your emotion. You thought could change your status in a split of a second. Many can relate, but many do not. Manage your risk.
This not a site for those just want to know, buy or sell. We don’t provide you the buy or sell information, we provide you the thought you can decide and take responsibility.
Trading is all about observation, reading the price bar and not news. By the time you hear the news it is already old and become history. Why? It is very simple, remember where the news come from? It has first someone release to the news agency like CNBC, and so on. Next, someone has to read the news to you after some research and summarize. This will be few hours later, by then the price action has already done.
As for price bar, it is what the market supply and remand. When market feel that is over price, the price will drop. All this reflected on the price bar almost instantly.
Next is how to read our price bar plus using some tools, such as MACD.
Here, we simply translate price action chart into layman language. This will help you in understand the financial instrument you are trading. We believe picture worth a thousand words. So, sometimes we use less words. You can learn the price action interpretation too. Give it a tray. You may not have the same view points as us. Remember all analysis read price action chart differently. It is just like reading an essay, we will have different conclusion.
Trade well.
Trade what you see. Manage your risk.
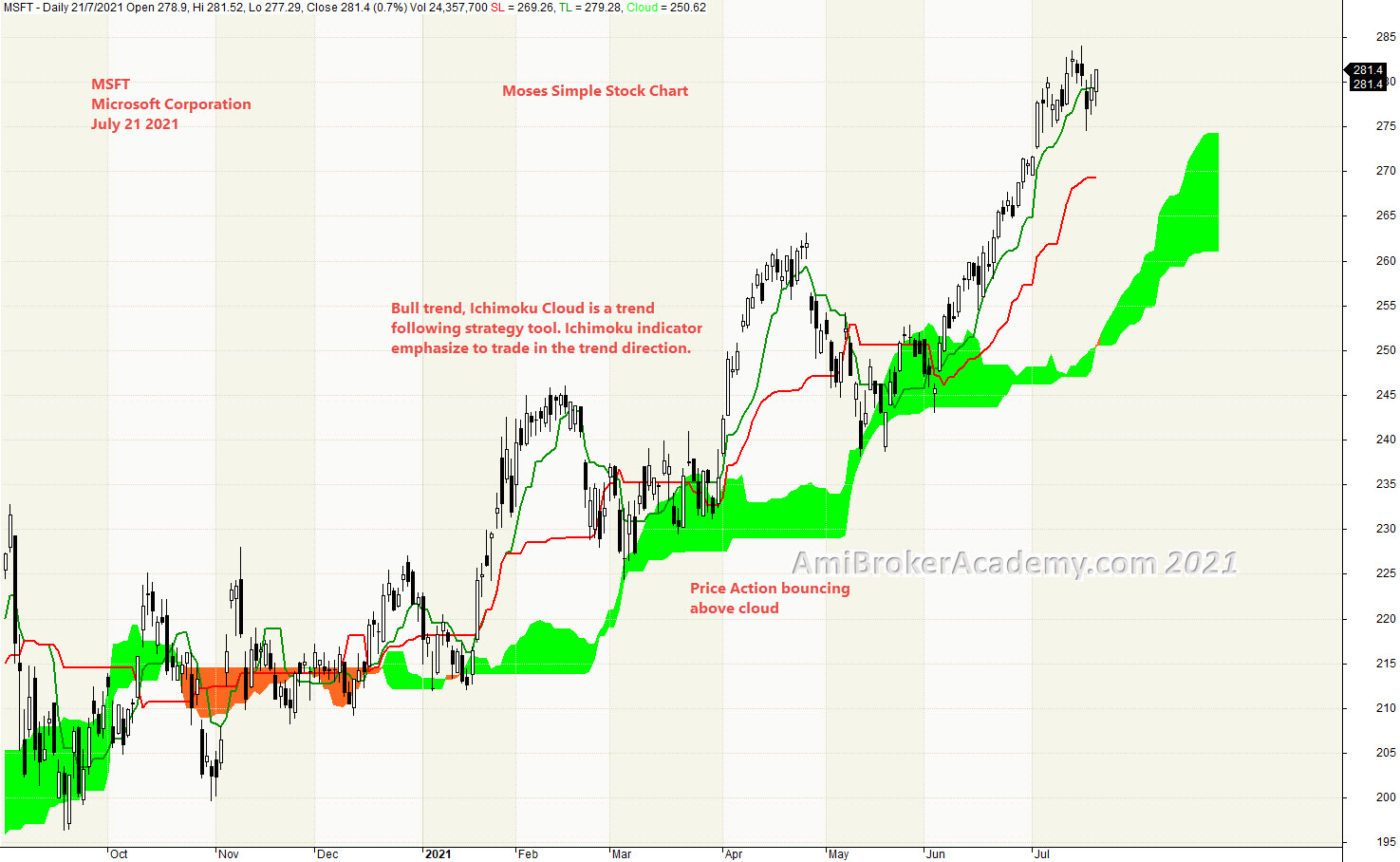
1) Microsoft Corporation and Ichimoku Cloud
Ichimoku Cloud is a trend following strategy tool, can use in any market and any timeframe. Ichimoku indicator emphasize to trade in the trend direction. We see price action emerge from the cloud and stay above. Bull trend. Read the chart price action goes from bottom left below the cloud to eventually close on top of the chart and above cloud. Price action has bounced above the cloud. Remember one thing, buy support sell resistance. Price Action now is at resistance, not sure. When we are not sure, our practice is stand aside a wait. We see Tenkan Sen (green) after zigzag with Kijun Sen (red) and finally stay above and continue to stay above. Trade what you see.
Ichimoku is a great visual tool too, to help in avoid trading in the wrong direction.
Besides that, Ichimoku Cloud is a multi-dimensional indicator designed to offer support and resistance levels, trending, and entry and exit points. Ichimoku is an indicator that gauges future price momentum and determine futures areas of support and resistance. Price Action is currently well above cloud and far apart.
Remember, we just read what the chart said. We do not and can not personalize the price action to your liking. Have fun!
Don’t play play with Ichimoku indicator. Very simple. Yet powerful. AmiBrokerAcademy provides you simple yet easy to understand stock chart. Check out Moses power stock chart.
20210721 Microsoft Corporation and Ichimoku Cloud
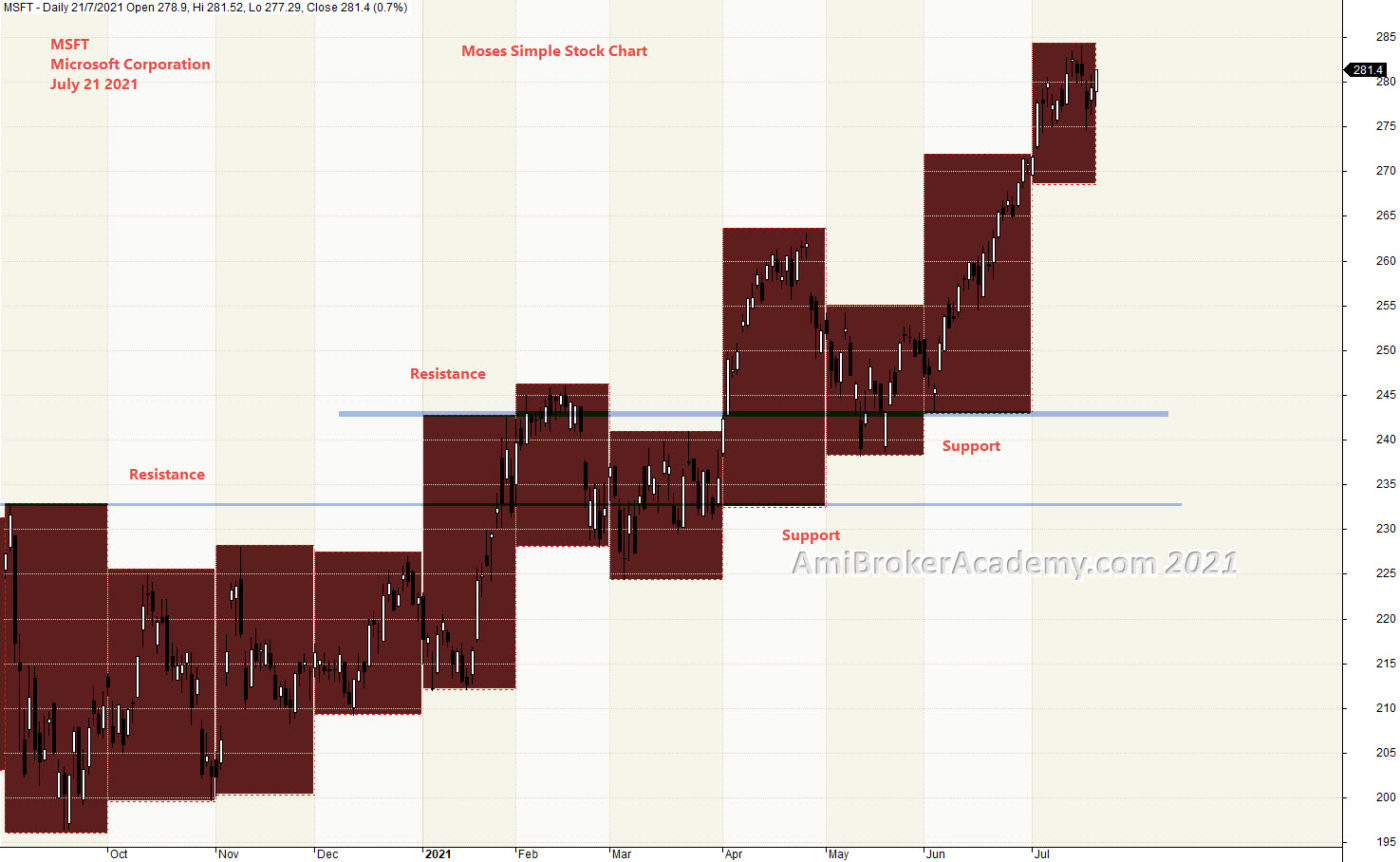
2) Microsoft Corporation and Support Resistance
Study Microsoft Corporation price action, price action goes from low to high, from bottom left to top right. If we use the month high low to help in finding the support resistance. We will find a key level, or zone price action has resisted and supported by the key level.
Trade what you see. Mange your risk.
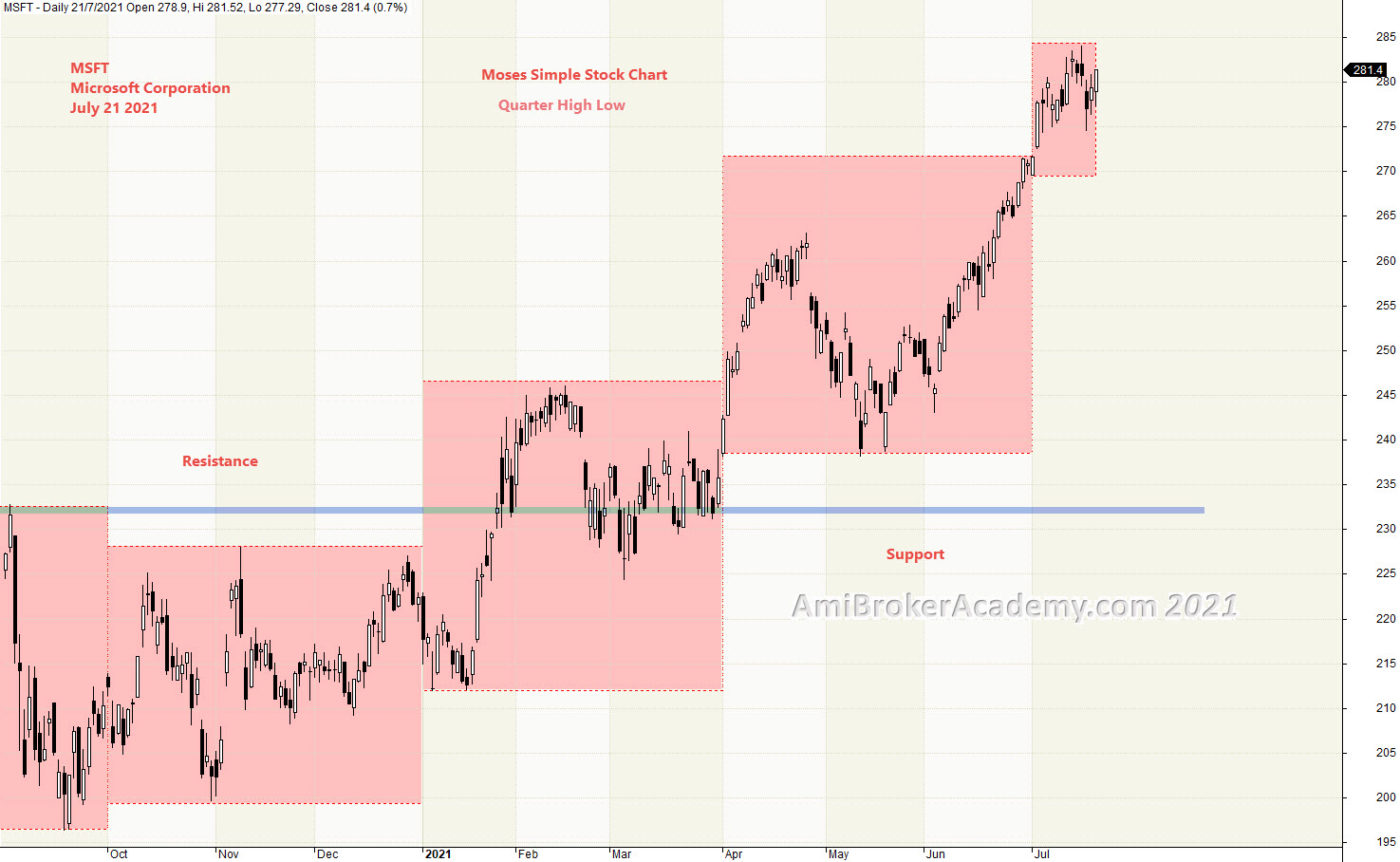
Microsoft Corporation and Quarter High Low Support Resistance
If you decide to use the quarter high low to find a strong level, you will find a similar level. Remember to buy support and sell resistance. Have fun!
20210721 Microsoft Corporation and Quarter High Low Support Resistance
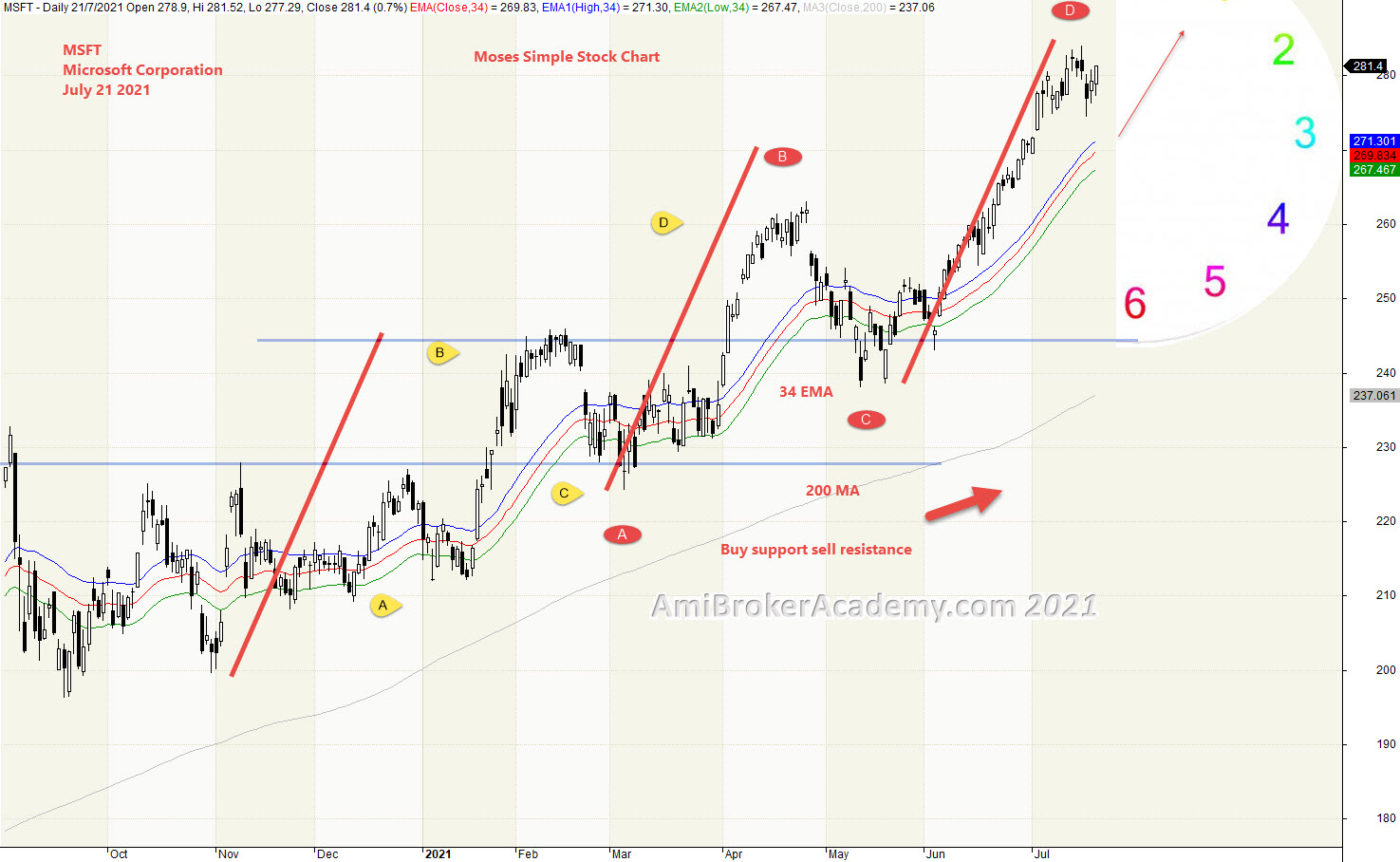
3) Microsoft Corporation and River
Price Action is pointing to One o’clock direction, price action is very bull bias. See chart, we see the trend is slopping up and up.
Moving Average is a great visual tool. Raghee uses high, low and close of 34 EMA to form a band to determine the wave direction. Price action goes from below 34 EMA to above River. Occasionally, price action deep below the RIver, very quickly go above again. Price Action has gone higher
River is a great support resistance tool too. Catch the support to find the entry. Remember to reduce risk by buy support and take profit to sell resistance.
Manage your risk.
20210721 Microsoft Corporation and River
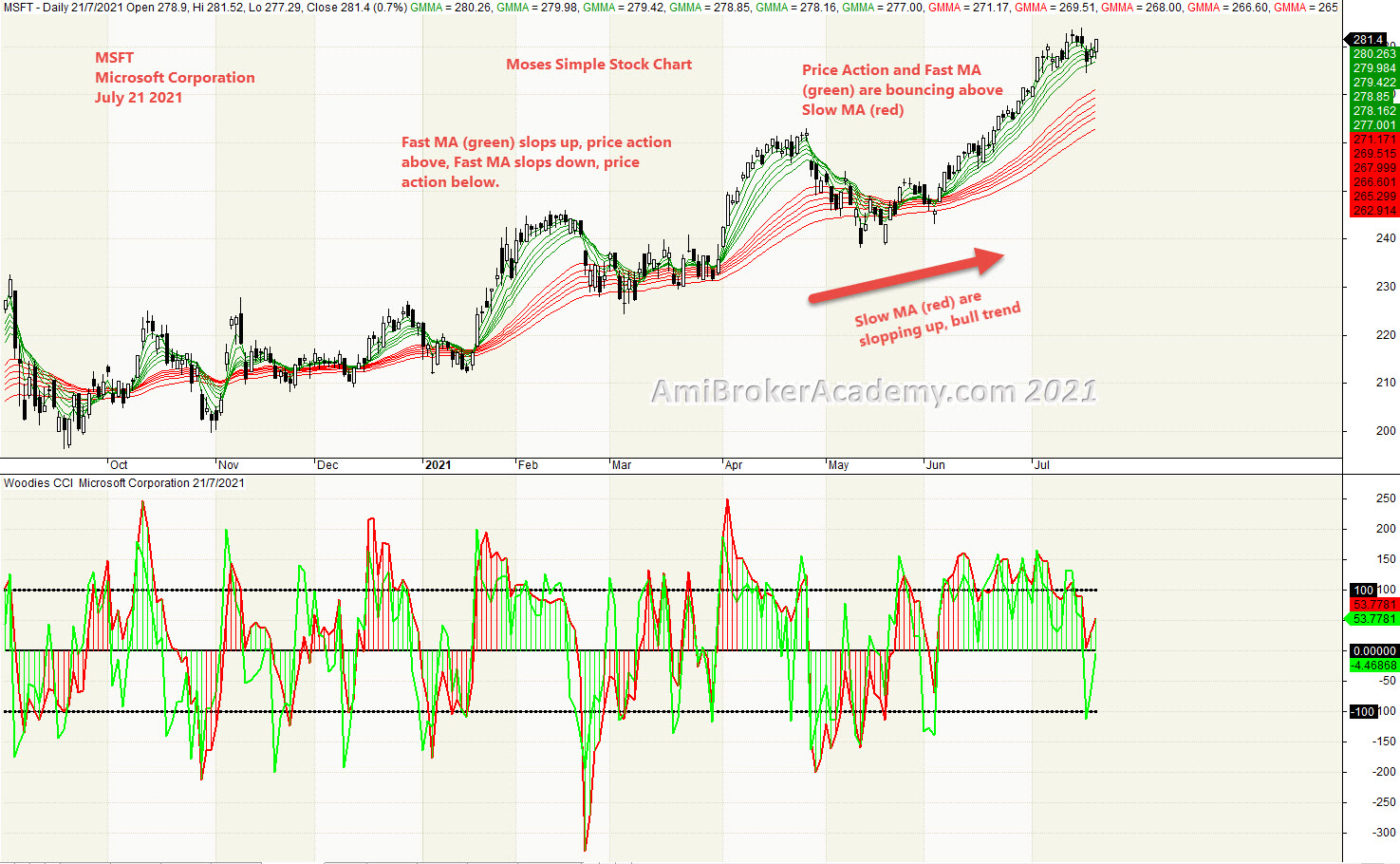
4) Microsoft Corporation and GMMA and Woodies CCI
As we said in the above Ichimoku Cloud analysis, we ask you to stand aside when you are not sure. Study MSFT price action with GMMA and Woodies. Price action goes from low to high, from bottom left to top right.
It starts from price action and Fast MA (green) from bottom to above Slow MA (red) and stay above.
From Woodies CCI, price action continues to go higher. But, Woodies CCi is forming lower high. Divergence. Price Action might be topping. Trade with eyes open.
Mange your risk.
20210721 Microsoft Corporation and GMMA and Woodies CCI
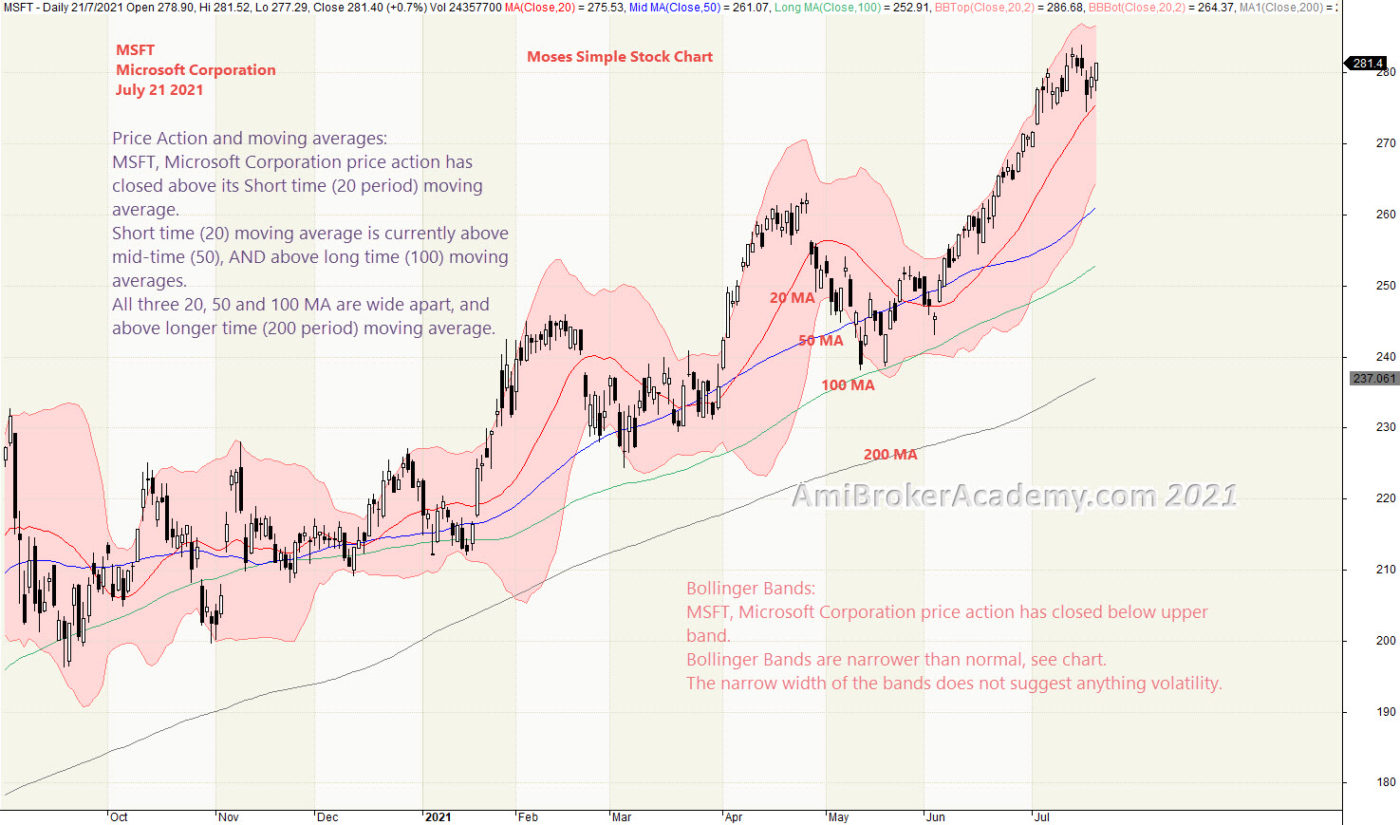
5) Microsoft Corporation and bollinger bands and moving averages
Price Action and moving averages: MSFT, Microsoft Corporation price action has closed above its Short time (20 period) moving average. Short time (20) moving average is currently above mid-time (50), AND above long time (100) moving averages. All three 20, 50 and 100 MA are wide apart, and above longer time (200 period) moving average.
Bollinger Bands: MSFT, Microsoft Corporation price action has closed below upper band. Bollinger Bands are narrower than normal, see chart. The narrow width of the bands does not suggest anything volatility.
Mange your risk.
20210721 Microsoft Corporation and bollinger bands and moving averages
6) Microsoft Corporation and MACD Divergence
We study price action we see MACD Divergence, price action continues to go higher, but MACD begin to form lower high and MACD Histogram to form lower high. So we expect a reversal is going to happen. But by now everyone has learnt that MACD Divergence is like a traffic light, you don’t stop at every traffic light. So, be the MACD Divergence. The price action may not pullback. But topping signal has now showed.
Trade what you see. We are looking for bear signal, and confirmation. MACD cross signal is a good indication to lookout for.
So, read the information you can get from the chart.
Remember, we just read what the chart said. Have fun!
But. don’t play play with MACD indicator. Very simple yet powerful.
20210721 Microsoft Corporation and MACD Divergence
We could find both stock price goes the opposite direction at the last few months. Will similarity on the bull and bear happen again? Will see.
20210721 Microsoft Corporation and Intel Corporation Correlation
Moses Power Charting
Official AmiBrokerAcademy.com Charting
Disclaimer
The above result is for illustration purpose. It is not meant to be used for buy or sell decision. We do not recommend any particular stocks. If particular stocks of such are mentioned, they are meant as demonstration of Amibroker as a powerful charting software and MACD. Amibroker can program to scan the stocks for buy and sell signals.
These are script generated signals. Not all scan results are shown here. The MACD signal should use with price action. Users must understand what MACD and price action are all about before using them. If necessary you should attend a course to learn more on Technical Analysis (TA) and Moving Average Convergence Divergence, MACD.
Once again, the website does not guarantee any results or investment return based on the information and instruction you have read here. It should be used as learning aids only and if you decide to trade real money, all trading decision should be your own.
We learn from many past and present great traders. Kudo to these master.
Welcome to AmiBroker Academy dot com, amibrokeracademy.com.
We sometime bench mark two stock price action or stock price with index. The following example, we benchmark two Information Technology key players, MSFT and INTC. Besides correlation we use other tools such as 1) Ichimoku Cloud, 2) Support Resistance (using box), 3) River (moving average), 4) GMMA and Woodies CCI, 5) Bollinger Bands and Moving Averages, and 6) MACD to analyze chart. See our simple reading of price action.
We also apply wave theory onto chart. Such as well know Elliott Waves. Just in case you are not familiar with Elliott Waves. Elliott was from Ralph Nelson Elliott.
Otherwise, we like to use pattern, such as ABCD pattern. Checkout our posting here for more.
We translate price action chart into layman language. This will help you in understand the financial instrument you are trading. We believe picture worth a thousand words. So, sometimes we use less words. You can learn the price action interpretation too. Give it a tray. You may not have the same view points as us. Remember all analysis read price action chart differently. It is just like reading an essay, we will have different conclusion.
Trade what you see. Manage your risk. Trade well.
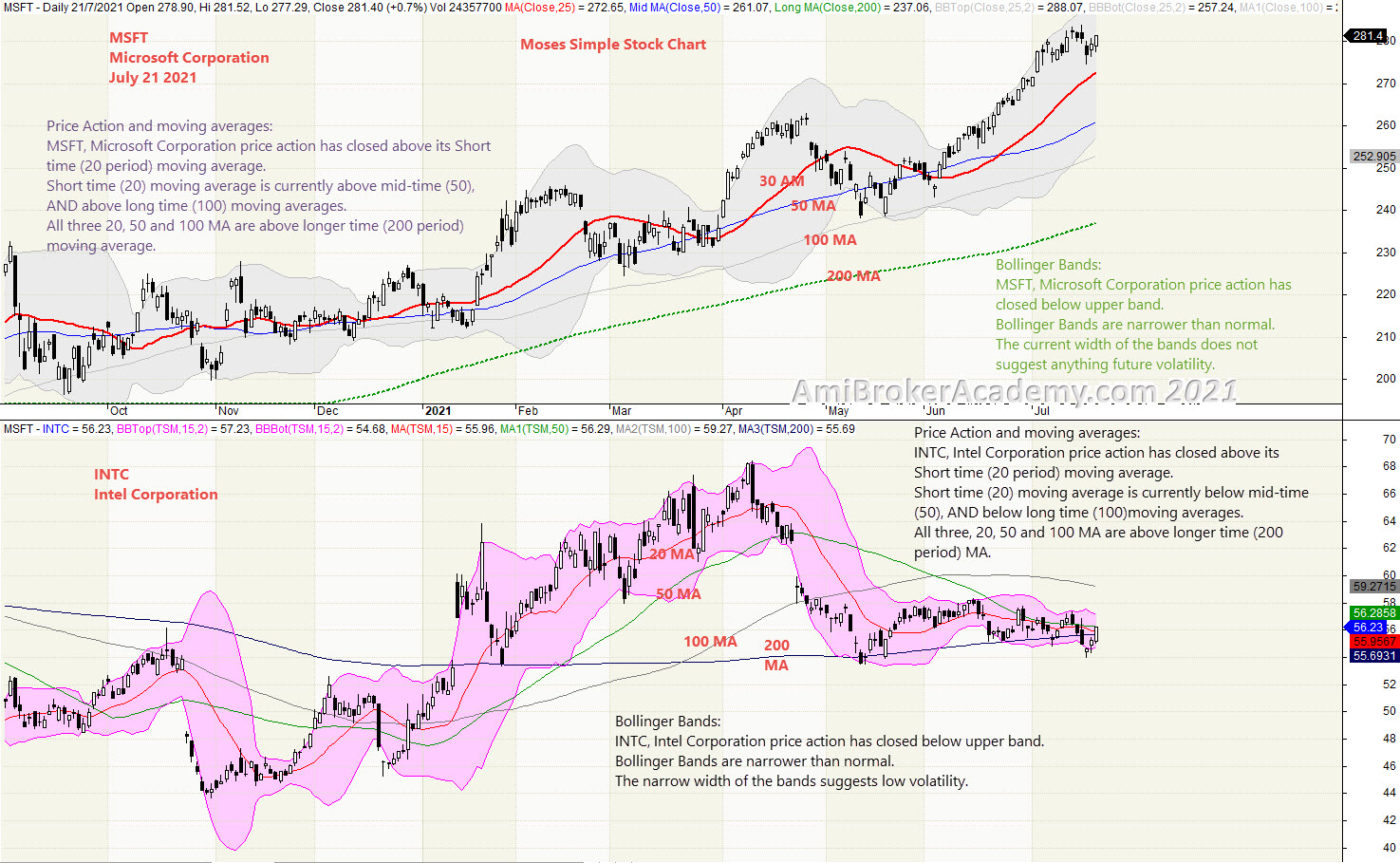
1) Microsoft Corporation and Intel Corporation Correlation
We study price action we see MSFT price action continues to go higher. Price Action continues to get support from 100 MA. Intel Corporation stock price action has deep and bounce. Now price action has pullback to find support. Can you spot the resistance turns support.
MSFT
Price Action and moving averages: MSFT, Microsoft Corporation price action has closed above its Short time (20 period) moving average. Short time (20) moving average is currently above mid-time (50), AND above long time (100) moving averages. All three 20, 50 and 100 MA are wide apart, and above longer time (200 period) moving average.
Bollinger Bands: MSFT, Microsoft Corporation price action has closed below upper band. Bollinger Bands are narrower than normal, see chart. The narrow width of the bands does not suggest anything volatility.
INTC
Price Action and moving averages: INTC, Intel Corporation price action has closed above its Short time (20 period) moving average. Short time (20) moving average is currently below mid-time (50), AND below long time (100)moving averages. All three, 20, 50 and 100 MA are above longer time (200 period) MA.
Bollinger Bands: INTC, Intel Corporation price action has closed below upper band. Bollinger Bands are narrower than normal. The narrow width of the bands suggests low volatility.
Remember, we just read what the chart said. Have fun!
20210721 Microsoft Corporation and Intel Corporation Correlation
Moses Power Charting
Official AmiBrokerAcademy.com Charting
Disclaimer
The above result is for illustration purpose. It is not meant to be used for buy or sell decision. We do not recommend any particular stocks. If particular stocks of such are mentioned, they are meant as demonstration of Amibroker as a powerful charting software and MACD. Amibroker can program to scan the stocks for buy and sell signals.
These are script generated signals. Not all scan results are shown here. The MACD signal should use with price action. Users must understand what MACD and price action are all about before using them. If necessary you should attend a course to learn more on Technical Analysis (TA) and Moving Average Convergence Divergence, MACD.
Once again, the website does not guarantee any results or investment return based on the information and instruction you have read here. It should be used as learning aids only and if you decide to trade real money, all trading decision should be your own.
We learn from many past and present great traders. Kudo to these master.
Welcome to AmiBroker Academy dot com, amibrokeracademy.com.
Trading is all about observation, reading the price bar but not listen to news. By the time you hear the news it is already old and become history. Why? It is very simple, remember where the news come from? It has first someone release to the news agency like CNBC, and so on. Next, someone has to read the news to you after some research and summarize. This will be few hours later, by then the price action has already done.
As for price bar, it is what the market supply and remand. When market feel that is over price, the price will drop. All this reflected on the price bar almost instantly.
Next is how to read our price bar plus using some tools, such as MACD.
Here, we simply translate price action chart into layman language. This will help you in understand the financial instrument you are trading. We believe picture worth a thousand words. So, sometimes we use less words. You can learn the price action interpretation too. Give it a tray. You may not have the same view points as us. Remember all analysis read price action chart differently. It is just like reading an essay, we will have different conclusion.
Trade well.
Trade what you see. Manage your risk.
1) MSFT | Microsoft Corporation and Ichimoku Cloud
Ichimoku Cloud is a trend following strategy tool, can use in any market and any timeframe. Ichimoku indicator emphasize to trade in the trend direction. We see price action emerge from the cloud and stay above. Bull trend. Read the chart price action goes from bottom left below the cloud to eventually close on top of the chart and above cloud. Price action has bounced above the cloud. Remember one thing, buy support sell resistance. Price Action now is at resistance, not sure. When we are not sure, our practice is stand aside a wait. We see Tenkan Sen (green) after zigzag with Kijun Sen (red) and finally stay above and continue to stay above. Trade what you see.
Ichimoku is a great visual tool too, to help in avoid trading in the wrong direction.
Besides that, Ichimoku Cloud is a multi-dimensional indicator designed to offer support and resistance levels, trending, and entry and exit points. Ichimoku is an indicator that gauges future price momentum and determine futures areas of support and resistance. Price Action is currently well above cloud and far apart.
Remember, we just read what the chart said. We do not and can not personalize the price action to your liking. Have fun!
Don’t play play with Ichimoku indicator. Very simple. Yet powerful. AmiBrokerAcademy provides you simple yet easy to understand stock chart. Check out Moses power stock chart.
20210721 Microsoft Corporation and Ichimoku Cloud
2) Microsoft Corporation and GMMA and Woodies CCI
As we said in the above Ichimoku Cloud analysis, we ask you to stand aside when you are not sure. Study MSFT price action with GMMA and Woodies. Price action goes from low to high, from bottom left to top right.
It starts from price action and Fast MA (green) from bottom to above Slow MA (red) and stay above.
From Woodies CCI, price action continues to go higher. But, Woodies CCi is forming lower high. Divergence. Price Action might be topping. Trade with eyes open.
Mange your risk.
20210721 Microsoft Corporation and GMMA and Woodies CCI
Moses Power Charting
Official AmiBrokerAcademy.com Charting
Disclaimer
The above result is for illustration purpose. It is not meant to be used for buy or sell decision. We do not recommend any particular stocks. If particular stocks of such are mentioned, they are meant as demonstration of Amibroker as a powerful charting software and MACD. Amibroker can program to scan the stocks for buy and sell signals.
These are script generated signals. Not all scan results are shown here. The MACD signal should use with price action. Users must understand what MACD and price action are all about before using them. If necessary you should attend a course to learn more on Technical Analysis (TA) and Moving Average Convergence Divergence, MACD.
Once again, the website does not guarantee any results or investment return based on the information and instruction you have read here. It should be used as learning aids only and if you decide to trade real money, all trading decision should be your own.
We learn from many past and present great traders. Kudo to these master.
Welcome to AmiBroker Academy dot com, amibrokeracademy.com.
Trading is all about observation, reading the price bar but not listen to news. By the time you hear the news it is already old and become history. Why? It is very simple, remember where the news come from? It has first someone release to the news agency like CNBC, and so on. Next, someone has to read the news to you after some research and summarize. This will be few hours later, by then the price action has already done.
As for price bar, it is what the market supply and remand. When market feel that is over price, the price will drop. All this reflected on the price bar almost instantly.
Next is how to read our price bar plus using some tools, such as MACD.
Here, we simply translate price action chart into layman language. This will help you in understand the financial instrument you are trading. We believe picture worth a thousand words. So, sometimes we use less words. You can learn the price action interpretation too. Give it a tray. You may not have the same view points as us. Remember all analysis read price action chart differently. It is just like reading an essay, we will have different conclusion.
Trade well.
Trade what you see. Manage your risk.
1) BTI | British American Tobacco PLC and Ichimoku Cloud
Ichimoku Cloud is a trend following strategy tool, can use in any market and any timeframe. Ichimoku indicator emphasize to trade in the trend direction. In the following chart, it is very messy, price action in and out of cloud. Sometime bull bias and others bear. If you still insist must use Ichimoku cloud, we suggest you segment the chart into bull or bear portion. And apply your your buy sell strategy. We now leave it to you to interpret the price action chart and Ichimoku cloud. If you have double, read the earlier Ichimoku analysis to get better interpretation. Have fun!
Remember, Ichimoku is a great visual tool too, to help in avoid trading in the wrong direction.
20210714 British American Tobacco PLC and Ichimoku Cloud
2) British American Tobacco PLC and Bollinger Bands and Moving Averages
Study British American Tobacco PLC price action using Bollinger Bands and Moving Averages. Price action goes from low to high and retest the high.
It is good about Bollinger Bands, the bands always able to envelop the price action, the most is price action going through extreme by keeping it outside the bands. So, what when price action is on upper bands, the price action may pullback and test the bottom band. Likewise, when it is tracing on the bottom banes, the price action may be bounce up to hit the top bands.
From chart, price action seems to be resisted by resistance and moving sideways. True or true? Will see, trade what you see.
Mange your risk.
20210714 British American Tobacco PLC and Bollinger Bands and Moving Averages
3) British American Tobacco PLC and River
Moving Average is a great visual tool, You can find it very useful in the very choppy price action like the chart below. So, simple buy when price action above River, and sell when the price action resisted by River. So, buy support and sell resistance.
You can also spot H M Gartley wave pattern too. Simple yet powerful, AB=CD pattern.
20210714 British American Tobacco PLC and River
4) British American Tobacco PLC and MACD
Picture worth a thousand words, the price action after the low, begin to form higher high. But, you see the MACD goes down, form lower high, MACD Divergence.
As we told you before, do not play play with simple tool like MACD. Find a good entry point to take partial profit. Have fun!
20210714 British American Tobacco PLC and MACD
Moses Power Charting
Official AmiBrokerAcademy.com Charting
Disclaimer
The above result is for illustration purpose. It is not meant to be used for buy or sell decision. We do not recommend any particular stocks. If particular stocks of such are mentioned, they are meant as demonstration of Amibroker as a powerful charting software and MACD. Amibroker can program to scan the stocks for buy and sell signals.
These are script generated signals. Not all scan results are shown here. The MACD signal should use with price action. Users must understand what MACD and price action are all about before using them. If necessary you should attend a course to learn more on Technical Analysis (TA) and Moving Average Convergence Divergence, MACD.
Once again, the website does not guarantee any results or investment return based on the information and instruction you have read here. It should be used as learning aids only and if you decide to trade real money, all trading decision should be your own.
We learn from many past and present great traders. Kudo to these master.
Welcome to AmiBroker Academy dot com, amibrokeracademy.com.
Trading is all about observation, reading the price bar but not listen to news. By the time you hear the news it is already old and become history. Why? It is very simple, remember where the news come from? It has first someone release to the news agency like CNBC, and so on. Next, someone has to read the news to you after some research and summarize. This will be few hours later, by then the price action has already done.
As for price bar, it is what the market supply and remand. When market feel that is over price, the price will drop. All this reflected on the price bar almost instantly.
Next is how to read our price bar plus using some tools, such as MACD.
Here, we simply translate price action chart into layman language. This will help you in understand the financial instrument you are trading. We believe picture worth a thousand words. So, sometimes we use less words. You can learn the price action interpretation too. Give it a tray. You may not have the same view points as us. Remember all analysis read price action chart differently. It is just like reading an essay, we will have different conclusion.
Trade well.
Trade what you see. Manage your risk.
1) BTO | John Hancock Financial Opportunities Fund and Ichimoku Cloud
Ichimoku Cloud is a trend following strategy tool, can use in any market and any timeframe. Ichimoku indicator emphasize to trade in the trend direction. We see price action emerge from the cloud and stay above. Bull trend. Price Action goes on bottom of cloud and close above and eventually stay above. But, but the price action has become weaker and pullback into cloud. One thing in trading, if you are not sure, stand aside and watch. Price Action now is possible to sink into and go below cloud. We see Tenkan Sen (green) after zigzag with Kijun Sen (red) and finally stay above. But this ended in July, Tenkan start to cross below Kijun and stay below, bear trend is about to start. Will see. Trade what you see.
Ichimoku is a great visual tool too, to help in avoid trading in the wrong direction.
Ichimoku Cloud is a multi-dimensional indicator designed to offer support and resistance levels, trending, and entry and exit points. Besides that, Ichimoku is an indicator that gauges future price momentum and determine futures areas of support and resistance. Price Action is currently below cloud.
Remember, we just read what the chart said. We do not and can not personalize the price action to your liking. Have fun!
Don’t play play with Ichimoku indicator. Very simple. Yet powerful. AmiBrokerAcademy provides you simple yet powerful stock chart. Check out Moses power stock chart.
20210714 John Hancock Financial Opportunities Fund and Ichimoku Cloud
2) John Hancock Financial Opportunities Fund and GMMA and Woodies CCI
As we said in the Ichimoku Cloud analysis, we ask you to stand aside when you are not sure. Study John Hancock Financial Opportunities Fund price action with GMMA and Woodies. Price action goes from low to high and pullback, from bottom left to top right.
It starts from price action and Fast MA (green) from bottom to above Slow MA (red) and stay above. At June, price action pullback, price action close below Fast MA and Fast MA close below Slow MA.
From chart, price action seems to be resisted by Slow MA. Will see, trade what you see.
Mange your risk.
20210714 John Hancock Financial Opportunities Fund and GMMA and Woodies CCI
Moses Power Charting
Official AmiBrokerAcademy.com Charting
Disclaimer
The above result is for illustration purpose. It is not meant to be used for buy or sell decision. We do not recommend any particular stocks. If particular stocks of such are mentioned, they are meant as demonstration of Amibroker as a powerful charting software and MACD. Amibroker can program to scan the stocks for buy and sell signals.
These are script generated signals. Not all scan results are shown here. The MACD signal should use with price action. Users must understand what MACD and price action are all about before using them. If necessary you should attend a course to learn more on Technical Analysis (TA) and Moving Average Convergence Divergence, MACD.
Once again, the website does not guarantee any results or investment return based on the information and instruction you have read here. It should be used as learning aids only and if you decide to trade real money, all trading decision should be your own.
We learn from many past and present great traders. Kudo to these master.