Welcome to AmiBroker Academy. Thanks for visiting the site.
Power AmiBroker Script
AmiBroker stock charting software has a programmable capability. The screener signals are done by the AmiBroker AFL script. If you are interested in any of the AmiBroker script, you can search WiseTrader Toolbox for a similar one.
Moving Average Convergence Divergence, MACD Screener
MACD was developed by Gerald Appel in the late seventies.
MACD stands for Moving Average Convergence Divergence, the MACD line (red line or called fast line) and MACD signal line (blue line, or called slow line).
MACD Bullish Signal Line Cross: MACD bullish signal when red line crosses above the blue line or MACD line crosses above zero line.
MACD Bearish Signal Line Cross: MACD bearish signal when blue line crosses below red line or MACD line crosses below zero line.
MACD Scan
These are stocks picked for June 28.
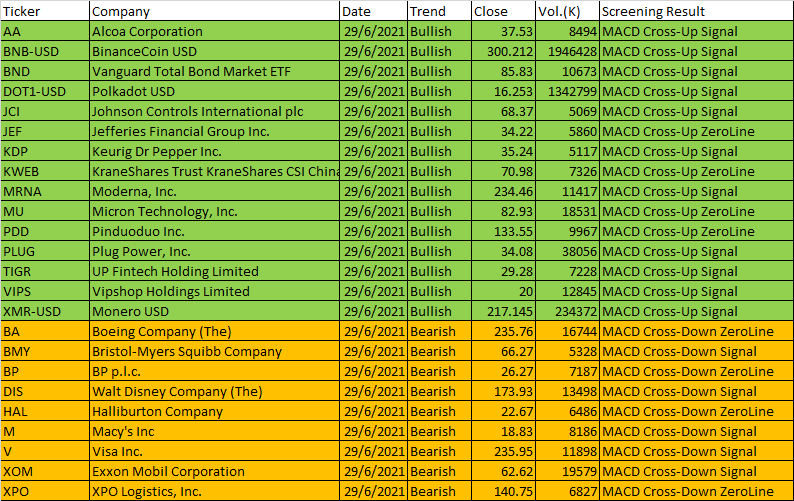
Some of 29 June, 2021 AmiBroker AFL Script Generated One-day US Stock MACD Signals
Ticker
Company
Date
Trend
Close
Vol.(K)
Screening Result
AA
Alcoa Corporation
29/6/2021
Bullish
37.53
8494
MACD Cross-Up Signal
BNB-USD
BinanceCoin USD
29/6/2021
Bullish
300.212
1946428
MACD Cross-Up Signal
BND
Vanguard Total Bond Market ETF
29/6/2021
Bullish
85.83
10673
MACD Cross-Up Signal
DOT1-USD
Polkadot USD
29/6/2021
Bullish
16.253
1342799
MACD Cross-Up Signal
JCI
Johnson Controls International plc
29/6/2021
Bullish
68.37
5069
MACD Cross-Up Signal
JEF
Jefferies Financial Group Inc.
29/6/2021
Bullish
34.22
5860
MACD Cross-Up ZeroLine
KDP
Keurig Dr Pepper Inc.
29/6/2021
Bullish
35.24
5117
MACD Cross-Up Signal
KWEB
KraneShares Trust KraneShares CSI China Internet ETF
29/6/2021
Bullish
70.98
7326
MACD Cross-Up ZeroLine
MRNA
Moderna, Inc.
29/6/2021
Bullish
234.46
11417
MACD Cross-Up Signal
MU
Micron Technology, Inc.
29/6/2021
Bullish
82.93
18531
MACD Cross-Up ZeroLine
PDD
Pinduoduo Inc.
29/6/2021
Bullish
133.55
9967
MACD Cross-Up ZeroLine
PLUG
Plug Power, Inc.
29/6/2021
Bullish
34.08
38056
MACD Cross-Up Signal
TIGR
UP Fintech Holding Limited
29/6/2021
Bullish
29.28
7228
MACD Cross-Up Signal
VIPS
Vipshop Holdings Limited
29/6/2021
Bullish
20
12845
MACD Cross-Up Signal
XMR-USD
Monero USD
29/6/2021
Bullish
217.145
234372
MACD Cross-Up Signal
BA
Boeing Company (The)
29/6/2021
Bearish
235.76
16744
MACD Cross-Down ZeroLine
BMY
Bristol-Myers Squibb Company
29/6/2021
Bearish
66.27
5328
MACD Cross-Down Signal
BP
BP p.l.c.
29/6/2021
Bearish
26.27
7187
MACD Cross-Down ZeroLine
DIS
Walt Disney Company (The)
29/6/2021
Bearish
173.93
13498
MACD Cross-Down Signal
HAL
Halliburton Company
29/6/2021
Bearish
22.67
6486
MACD Cross-Down ZeroLine
M
Macy’s Inc
29/6/2021
Bearish
18.83
8186
MACD Cross-Down Signal
V
Visa Inc.
29/6/2021
Bearish
235.95
11898
MACD Cross-Down Signal
XOM
Exxon Mobil Corporation
29/6/2021
Bearish
62.62
19579
MACD Cross-Down Signal
XPO
XPO Logistics, Inc.
29/6/2021
Bearish
140.75
6827
MACD Cross-Down ZeroLine
20210629 US Stock One-day MACD Signals
Moses Stock Scan Column
Free Power US Stock MACD Scan Signals AmiBroker Academy.com
Disclaimer: The above result is for illustration purpose. It is not meant to be used for buy or sell decision. We do not recommend any particular stocks on our website. If particular stocks of such are mentioned, they are meant as illustration or demonstration of Amibroker as a powerful charting software or MACD scanner. Amibroker can program to scan the stocks that have MACD buy or sell signals.
These are script generated signals. Not all scan results are shown here. The MACD signal should use with price action and confirmation. Users must understand what MACD and price action are all about before using them. If necessary you should attend a course to learn more about Technical Analysis (TA) and Moving Average Convergence Divergence, MACD.
Once again, the website does not guarantee any results or investment return based on the information and instruction you have read here. It should be used as learning aids only and if you decide to trade real money, all trading decision should be your own, and you should take your own responsibility.
Welcome to AmiBroker Academy. Thanks for visiting the site.
Moving Average Convergence Divergence, MACD Screener
MACD was developed by Gerald Appel in the late seventies.
MACD stands for Moving Average Convergence Divergence, the MACD line (red line or called fast line) and MACD signal line (blue line, or called slow line).
MACD Bullish Signal Line Cross: MACD bullish signal when red line crosses above the blue line or MACD line crosses above zero line.
MACD Bearish Signal Line Cross: MACD bearish signal when blue line crosses below red line or MACD line crosses below zero line.
MACD Scan
These are stocks picked for June 28.
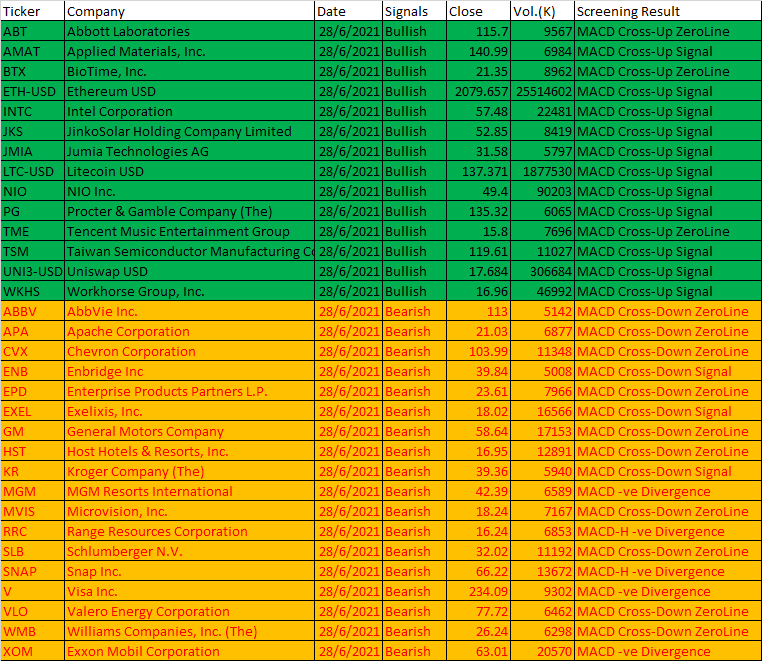
Some of 28 June, 2021 AmiBroker AFL Script Generated One-day US Stock MACD Signals
Ticker
Company
Date
Signals
Close
Vol.(K)
Screening Result
ABT
Abbott Laboratories
28/6/2021
Bullish
115.7
9567
MACD Cross-Up ZeroLine
AMAT
Applied Materials, Inc.
28/6/2021
Bullish
140.99
6984
MACD Cross-Up Signal
BTX
BioTime, Inc.
28/6/2021
Bullish
21.35
8962
MACD Cross-Up ZeroLine
ETH-USD
Ethereum USD
28/6/2021
Bullish
2079.657
25514602
MACD Cross-Up Signal
INTC
Intel Corporation
28/6/2021
Bullish
57.48
22481
MACD Cross-Up Signal
JKS
JinkoSolar Holding Company Limited
28/6/2021
Bullish
52.85
8419
MACD Cross-Up Signal
JMIA
Jumia Technologies AG
28/6/2021
Bullish
31.58
5797
MACD Cross-Up Signal
LTC-USD
Litecoin USD
28/6/2021
Bullish
137.371
1877530
MACD Cross-Up Signal
NIO
NIO Inc.
28/6/2021
Bullish
49.4
90203
MACD Cross-Up Signal
PG
Procter & Gamble Company (The)
28/6/2021
Bullish
135.32
6065
MACD Cross-Up Signal
TME
Tencent Music Entertainment Group
28/6/2021
Bullish
15.8
7696
MACD Cross-Up ZeroLine
TSM
Taiwan Semiconductor Manufacturing Company Ltd.
28/6/2021
Bullish
119.61
11027
MACD Cross-Up Signal
UNI3-USD
Uniswap USD
28/6/2021
Bullish
17.684
306684
MACD Cross-Up Signal
WKHS
Workhorse Group, Inc.
28/6/2021
Bullish
16.96
46992
MACD Cross-Up Signal
ABBV
AbbVie Inc.
28/6/2021
Bearish
113
5142
MACD Cross-Down ZeroLine
APA
Apache Corporation
28/6/2021
Bearish
21.03
6877
MACD Cross-Down ZeroLine
CVX
Chevron Corporation
28/6/2021
Bearish
103.99
11348
MACD Cross-Down ZeroLine
ENB
Enbridge Inc
28/6/2021
Bearish
39.84
5008
MACD Cross-Down Signal
EPD
Enterprise Products Partners L.P.
28/6/2021
Bearish
23.61
7966
MACD Cross-Down ZeroLine
EXEL
Exelixis, Inc.
28/6/2021
Bearish
18.02
16566
MACD Cross-Down Signal
GM
General Motors Company
28/6/2021
Bearish
58.64
17153
MACD Cross-Down ZeroLine
HST
Host Hotels & Resorts, Inc.
28/6/2021
Bearish
16.95
12891
MACD Cross-Down ZeroLine
KR
Kroger Company (The)
28/6/2021
Bearish
39.36
5940
MACD Cross-Down Signal
MGM
MGM Resorts International
28/6/2021
Bearish
42.39
6589
MACD -ve Divergence
MVIS
Microvision, Inc.
28/6/2021
Bearish
18.24
7167
MACD Cross-Down ZeroLine
RRC
Range Resources Corporation
28/6/2021
Bearish
16.24
6853
MACD-H -ve Divergence
SLB
Schlumberger N.V.
28/6/2021
Bearish
32.02
11192
MACD Cross-Down ZeroLine
SNAP
Snap Inc.
28/6/2021
Bearish
66.22
13672
MACD-H -ve Divergence
V
Visa Inc.
28/6/2021
Bearish
234.09
9302
MACD -ve Divergence
VLO
Valero Energy Corporation
28/6/2021
Bearish
77.72
6462
MACD Cross-Down ZeroLine
WMB
Williams Companies, Inc. (The)
28/6/2021
Bearish
26.24
6298
MACD Cross-Down ZeroLine
XOM
Exxon Mobil Corporation
28/6/2021
Bearish
63.01
20570
MACD -ve Divergence
20210628 US Stock One-day MACD Signals
AmiBroker stock charting software has a programmable capability. The above screener is done by the AmiBroker AFL script. If you are interested in any of the AmiBroker script, you can search WiseTrader Toolbox for a similar one.
Moses Stock Scan Column
Free Power US Stock MACD Scan Signals AmiBroker Academy.com
Disclaimer: The above result is for illustration purpose. It is not meant to be used for buy or sell decision. We do not recommend any particular stocks on our website. If particular stocks of such are mentioned, they are meant as illustration or demonstration of Amibroker as a powerful charting software or MACD scanner. Amibroker can program to scan the stocks that have MACD buy or sell signals.
These are script generated signals. Not all scan results are shown here. The MACD signal should use with price action and confirmation. Users must understand what MACD and price action are all about before using them. If necessary you should attend a course to learn more about Technical Analysis (TA) and Moving Average Convergence Divergence, MACD.
Once again, the website does not guarantee any results or investment return based on the information and instruction you have read here. It should be used as learning aids only and if you decide to trade real money, all trading decision should be your own, and you should take your own responsibility.
Welcome to AmiBroker Academy dot com, amibrokeracademy.com.
How to use simple chart to trade well. GO BEYOND!
Trade what you see. 2. Manage your risk.
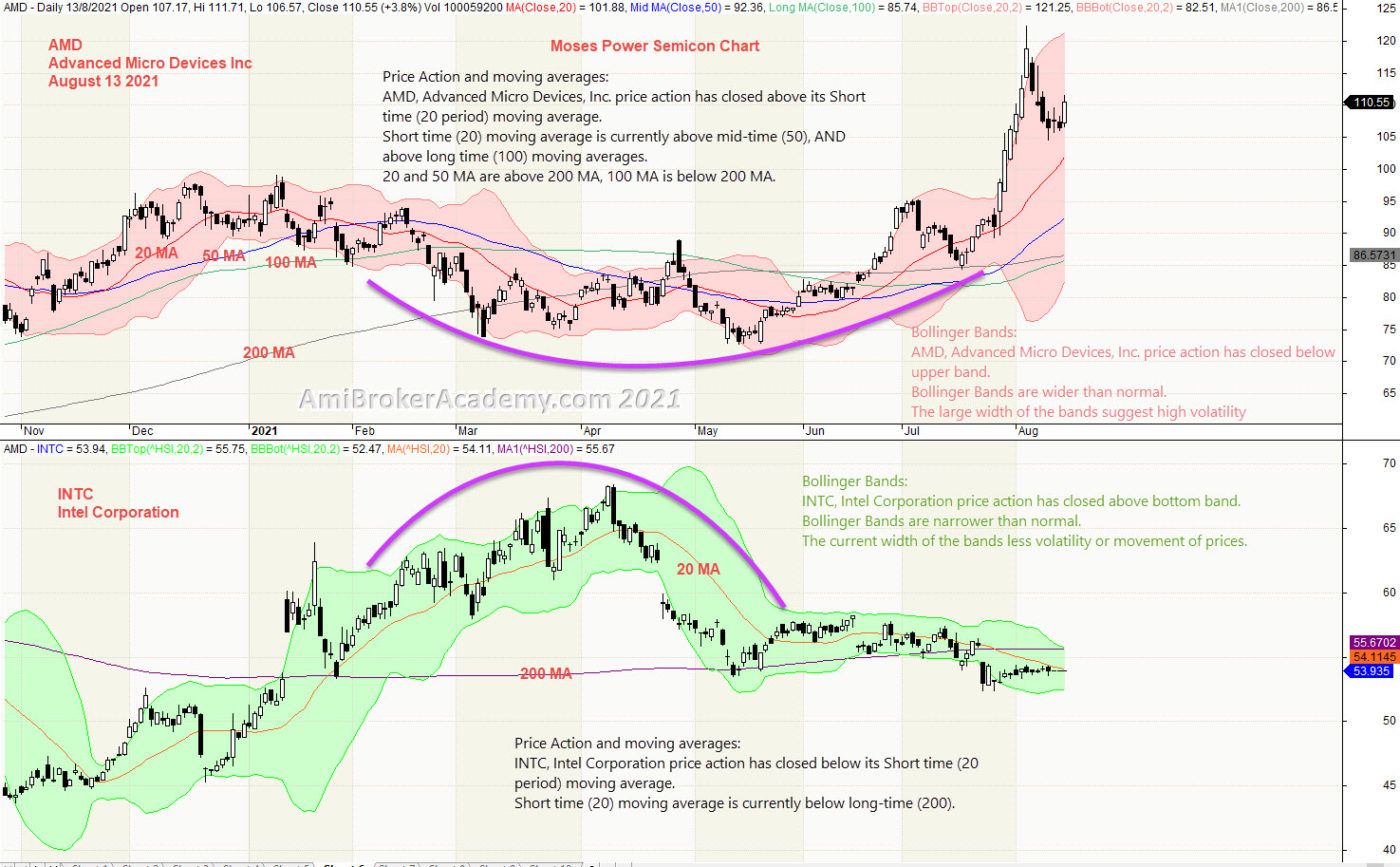
1) Advanced Micro Device Inc and Intel Corporation Correlation and Bollinger Bands Gro Corporation
Semiconductor Sector is a volatile market. Many of the automation and automobile are depending on them.
Study two key corporations, AMD and Intel stock price to understand what the market emotions.
AmiBroker charting software is a great charting software that you can easily benchmark two or more stock price.
See chart, picture worth a thousand words.
Manage your risk.
20210813 Advanced Micro Device Inc and Intel Corporation Correlation and Bollinger Bands
Moses Power Charting
Official AmiBrokerAcademy.com Charting
Disclaimer
The above result is for illustration purpose. It is not meant to be used for buy or sell decision. We do not recommend any particular stocks. If particular stocks of such are mentioned, they are meant as demonstration of Amibroker as a powerful charting software and MACD. Amibroker can program to scan the stocks for buy and sell signals.
These are script generated signals. Not all scan results are shown here. The MACD signal should use with price action. Users must understand what MACD and price action are all about before using them. If necessary you should attend a course to learn more on Technical Analysis (TA) and Moving Average Convergence Divergence, MACD.
Once again, the website does not guarantee any results or investment return based on the information and instruction you have read here. It should be used as learning aids only and if you decide to trade real money, all trading decision should be your own.
We learn from many past and present great traders. Kudo to these master.
Welcome to AmiBroker Academy dot com, amibrokeracademy.com.
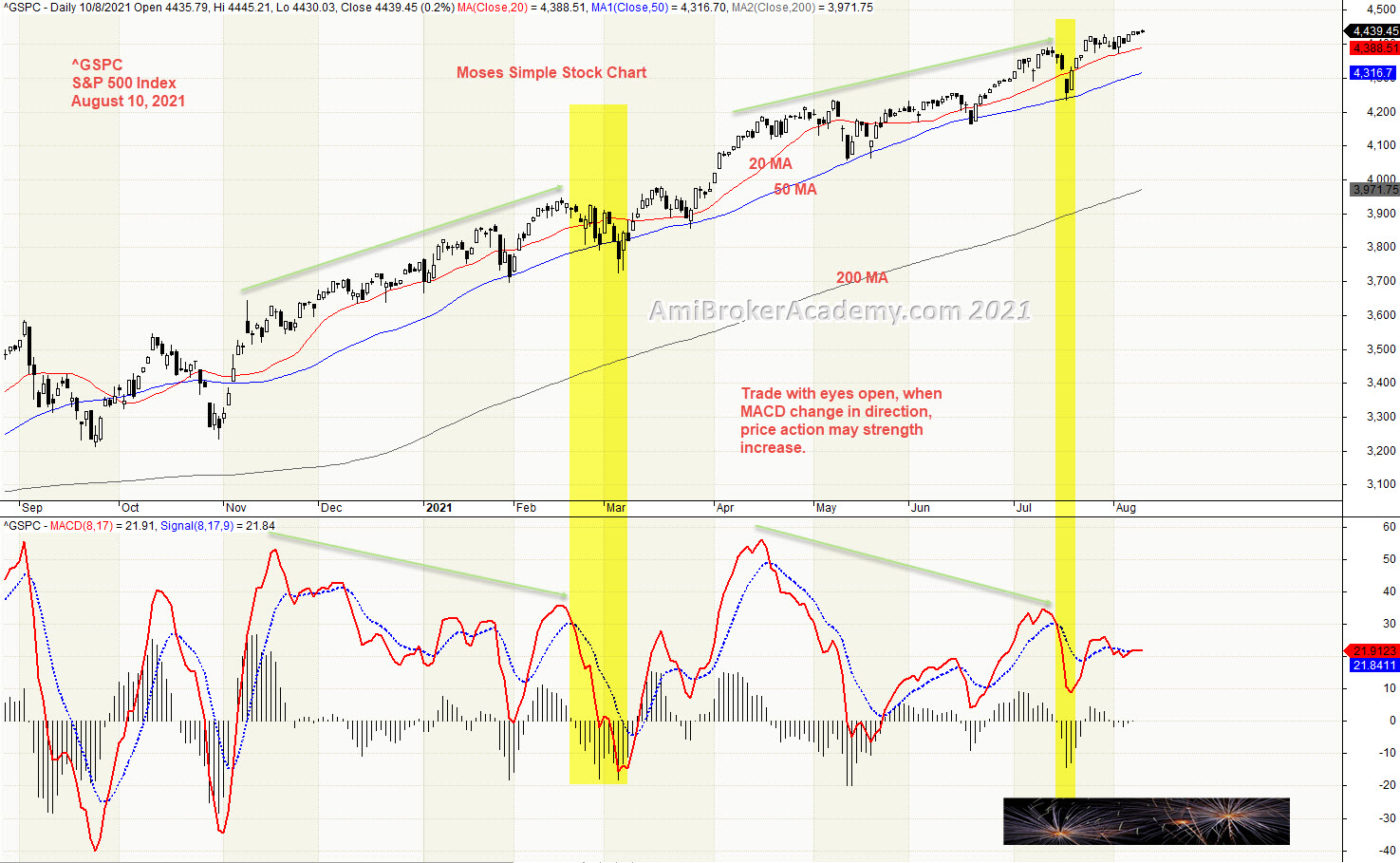
1) S&P 500 Index
In AmiBroker charting software, it is very easy to add ore remove any indicator. See chart, we add MACD indicator.
MACD is a very simple indicator, one approach is to study the price action strength with the MACD. When price action goes higher and strong, but MACD goes the opposite. It hints that the price action strength is weaken. There is a possibility of price action pullback.
However, MACD is like traffic light, Traffic light is install at each junction to signal a possible change in flow direction. Your experience tells you cars don’t stop at each traffic light, but there is a possibility of stop. It is true for price action and MACD Divergence. Price Action may be pullback in response to the MACD Divergence.
Remember to buy support sell resistance whenever that is possible.
Trade with eyes open.
Manage your risk.
20210810 S&P 500 Index and MACD Divergence
Moses Power Charting
Official AmiBrokerAcademy.com Charting
Disclaimer
The above result is for illustration purpose. It is not meant to be used for buy or sell decision. We do not recommend any particular stocks. If particular stocks of such are mentioned, they are meant as demonstration of Amibroker as a powerful charting software and MACD. Amibroker can program to scan the stocks for buy and sell signals.
These are script generated signals. Not all scan results are shown here. The MACD signal should use with price action. Users must understand what MACD and price action are all about before using them. If necessary you should attend a course to learn more on Technical Analysis (TA) and Moving Average Convergence Divergence, MACD.
Once again, the website does not guarantee any results or investment return based on the information and instruction you have read here. It should be used as learning aids only and if you decide to trade real money, all trading decision should be your own.
We learn from many past and present great traders. Kudo to these master.
Welcome to AmiBroker Academy dot com, amibrokeracademy.com.
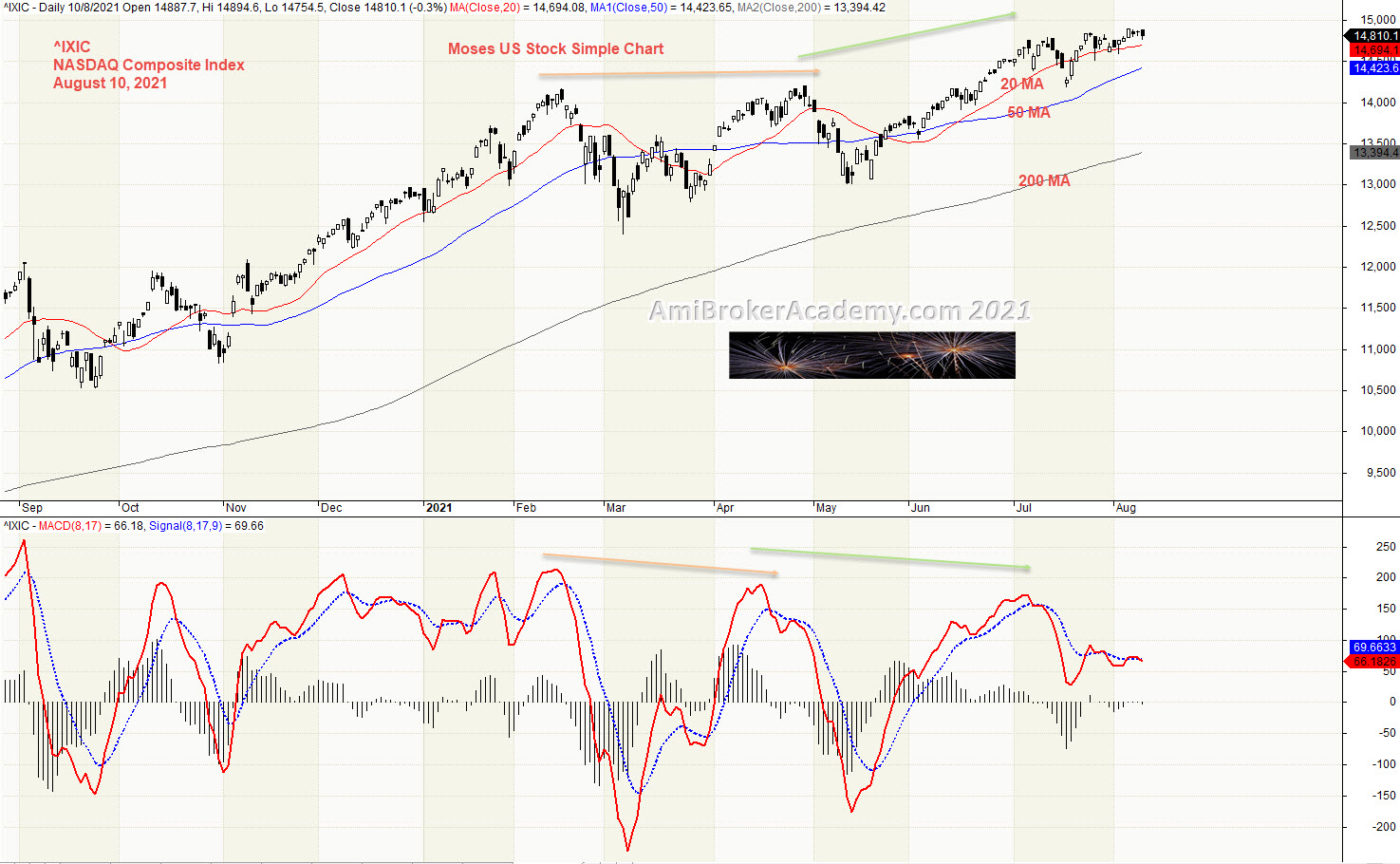
1) NASDAQ Composite Index and MACD Divergence
In AmiBroker charting software, it is very easy to add ore remove any indicator. See chart, we add MACD indicator.
MACD is a very simple indicator, one approach is to study the price action strength with the MACD. When price action goes higher and strong, but MACD goes the opposite. It hints that the price action strength is weaken. There is a possibility of price action pullback.
However, MACD is like traffic light, Traffic light is install at each junction to signal a possible change in flow direction. Your experience tells you cars don’t stop at each traffic light, but there is a possibility of stop. It is true for price action and MACD Divergence. Price Action may be pullback in response to the MACD Divergence.
Remember to buy support sell resistance whenever that is possible.
Trade with eyes open.
Manage your risk.
20210810 NASDAQ Composite Index and MACD Divergence
Moses Power Charting
Official AmiBrokerAcademy.com Charting
Disclaimer
The above result is for illustration purpose. It is not meant to be used for buy or sell decision. We do not recommend any particular stocks. If particular stocks of such are mentioned, they are meant as demonstration of Amibroker as a powerful charting software and MACD. Amibroker can program to scan the stocks for buy and sell signals.
These are script generated signals. Not all scan results are shown here. The MACD signal should use with price action. Users must understand what MACD and price action are all about before using them. If necessary you should attend a course to learn more on Technical Analysis (TA) and Moving Average Convergence Divergence, MACD.
Once again, the website does not guarantee any results or investment return based on the information and instruction you have read here. It should be used as learning aids only and if you decide to trade real money, all trading decision should be your own.
We learn from many past and present great traders. Kudo to these master.
Welcome to AmiBroker Academy dot com, amibrokeracademy.com.
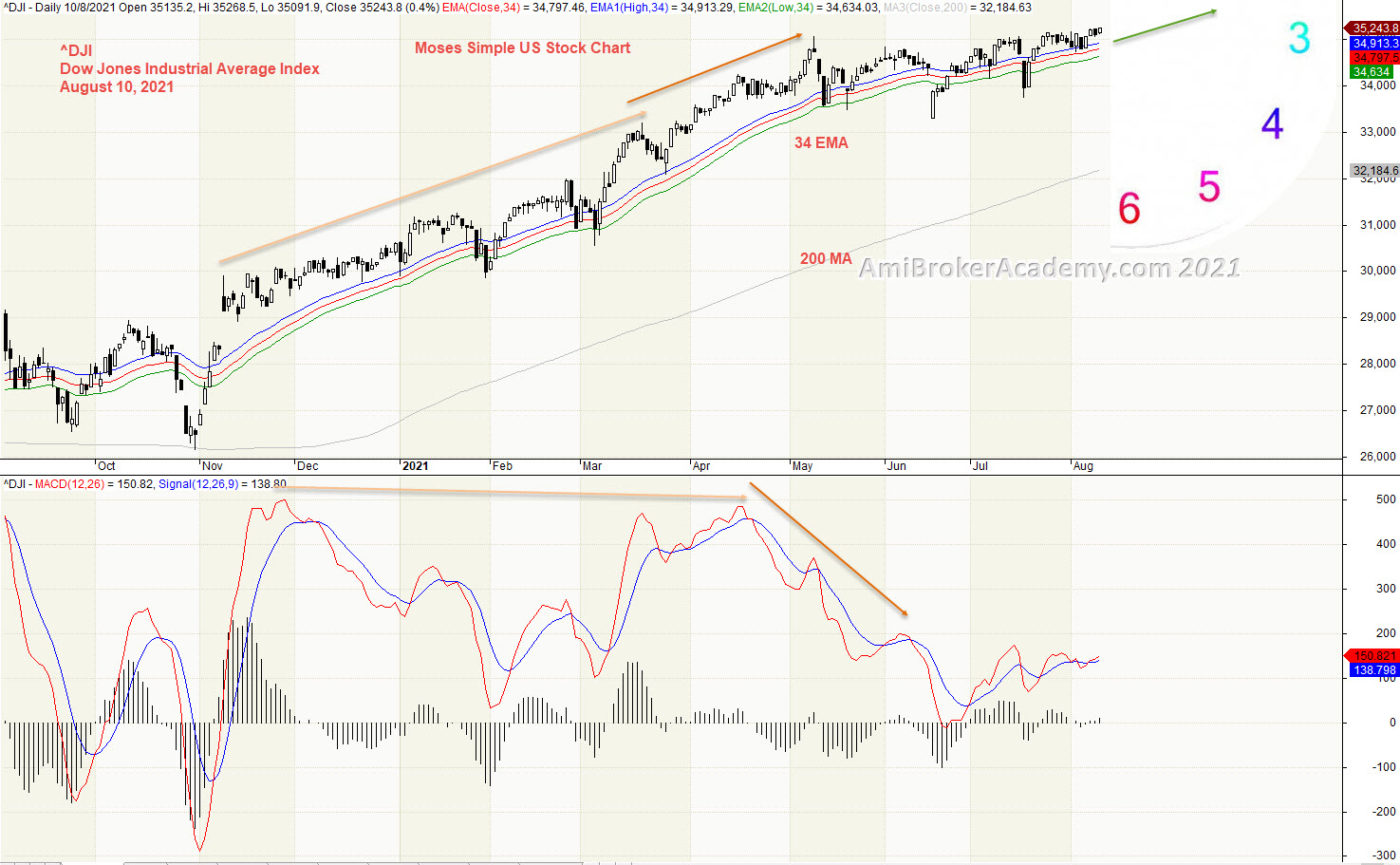
1) ^DJI | Dow Jones Industrial Average Index
Study Dow Jones Industrial Average Index price action. We use moving averages, moving average is a good visual tool. Raghee uses 34 EMA, high, low and close moving averages to study the wave direction. We call the three MAs band as River. Besides study the wave direction. We be used to measure support and resistance. River resist when price action below the River. River support when price action above the River. Bull trend, when the price action slopping up. Bear trend, when the price action slopping down.
One trick is to wait for price action to draw near the River. this will reduce the risk and increase the entry success rate. But, there are always fail situation, manage your risk.
See chart, we find the price action continues to be supported by River. River is pointing between two and three o’clock.
Remember, we just read what the chart said. Have fun!
Dow Jones Industrial Average Index, River and MACD
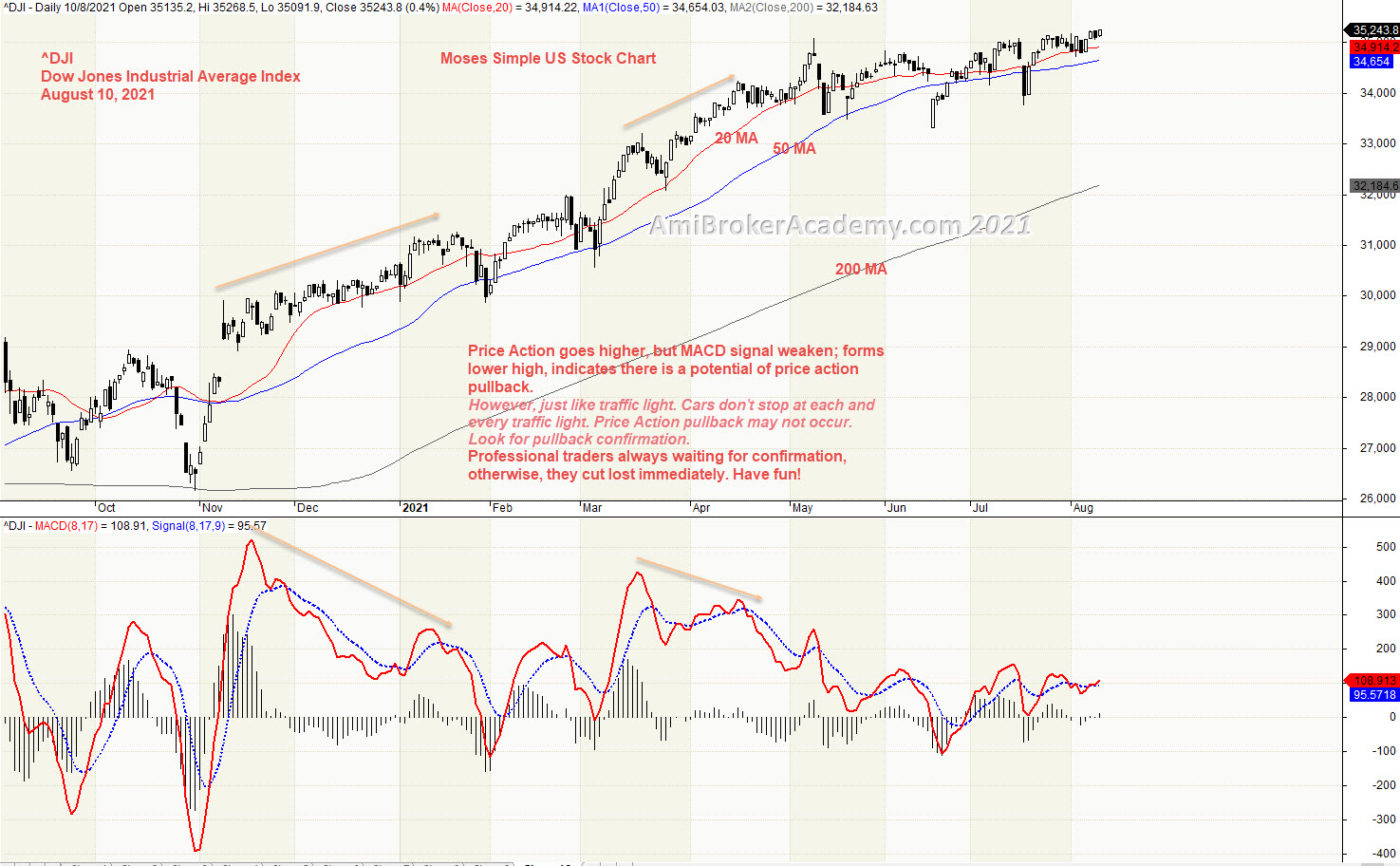
2) Dow Jones Industrial Average Index and MACD
In AmiBroker charting software, it is very easy to add ore remove any indicator. See chart, we add MACD indicator.
MACD is a very simple indicator, one approach is to study the price action strength with the MACD. When price action goes higher and strong, but MACD goes the opposite. In hints that the price action strength is weaken. There is a potential of price action pullback.
However, MACD is like traffic light, Traffic light is install at each junction to signal a potential flow direction change. Cars don’t stop at each traffic light, but there is a possibility of stop. It is true for price action and MACD. Price Action may be pullback in response to the MACD Divergence.
Remember to buy support sell resistance whenever that is possible.
Trade with eyes open.
Manage your risk.
20210810 Dow Jones Industrial Average Index and MACD
Moses Power Charting
Official AmiBrokerAcademy.com Charting
Disclaimer
The above result is for illustration purpose. It is not meant to be used for buy or sell decision. We do not recommend any particular stocks. If particular stocks of such are mentioned, they are meant as demonstration of Amibroker as a powerful charting software and MACD. Amibroker can program to scan the stocks for buy and sell signals.
These are script generated signals. Not all scan results are shown here. The MACD signal should use with price action. Users must understand what MACD and price action are all about before using them. If necessary you should attend a course to learn more on Technical Analysis (TA) and Moving Average Convergence Divergence, MACD.
Once again, the website does not guarantee any results or investment return based on the information and instruction you have read here. It should be used as learning aids only and if you decide to trade real money, all trading decision should be your own.
We learn from many past and present great traders. Kudo to these master.
Welcome to AmiBroker Academy dot com, amibrokeracademy.com.
1) GOLD | Barrick Gold Corporation and River
Study Barrick Gold Corporation stock price action. We use moving averages, moving average is a good visual tool. Raghee uses 34 EMA, high, low and close moving averages to study the wave direction. We call the three MAs band as River. Besides study the wave direction. We be used to measure support and resistance. River resist when price action below the River. River support when price action above the River. Bull trend, when the price action slopping up. Bear trend, when the price action slopping down.
One trick is to wait for price action to draw near the River. this will reduce the risk and increase the entry success rate. But, there are always fail situation, manage your risk.
See chart, we find the stock price finally resisted by RIver. River is pointing between four and five o’clock.
Remember, we just read what the chart said. Have fun!
20210810 Barrick Gold Corporation and River
2) Barrick Gold Corporation and MACD Divergence
MACD is a simple indicator, one way is to use it to measure the price action strength. When MACD Divergence occurs, be prepare to trade the reversal. In other words, when price action forms higher high, bull trend. But the MACD goes the opposite direction, the reversal may happen. Lookout for a sell confirmation.
MACD Divergence is just like traffic light, you do not stop at each traffic light. But be prepared to stop. Therefore, a pull back may happen when divergence is formed, However the pullback may be not happened. Confirmation is very important to confirm the entry.
Trade what you see. Mange your risk.
20210810 Barrick Gold Corporation and MACD Divergence
3) Barrick Gold Corporation River and MACD Divergence
In AmiBroker charting software, it is very easy to add ore remove any indicator. See chart, we combine the River and MACD in one chart.
You could use River to assist in buy and sell decision, or MACD to assist in buy and sell decision.
Remember to buy support sell resistance whenever that is possible.
Manage your risk.
20210810 Barrick Gold Corporation River and MACD Divergence
Moses Power Charting
Official AmiBrokerAcademy.com Charting
Disclaimer
The above result is for illustration purpose. It is not meant to be used for buy or sell decision. We do not recommend any particular stocks. If particular stocks of such are mentioned, they are meant as demonstration of Amibroker as a powerful charting software and MACD. Amibroker can program to scan the stocks for buy and sell signals.
These are script generated signals. Not all scan results are shown here. The MACD signal should use with price action. Users must understand what MACD and price action are all about before using them. If necessary you should attend a course to learn more on Technical Analysis (TA) and Moving Average Convergence Divergence, MACD.
Once again, the website does not guarantee any results or investment return based on the information and instruction you have read here. It should be used as learning aids only and if you decide to trade real money, all trading decision should be your own.
We learn from many past and present great traders. Kudo to these master.
Welcome to AmiBroker Academy dot com, amibrokeracademy.com.
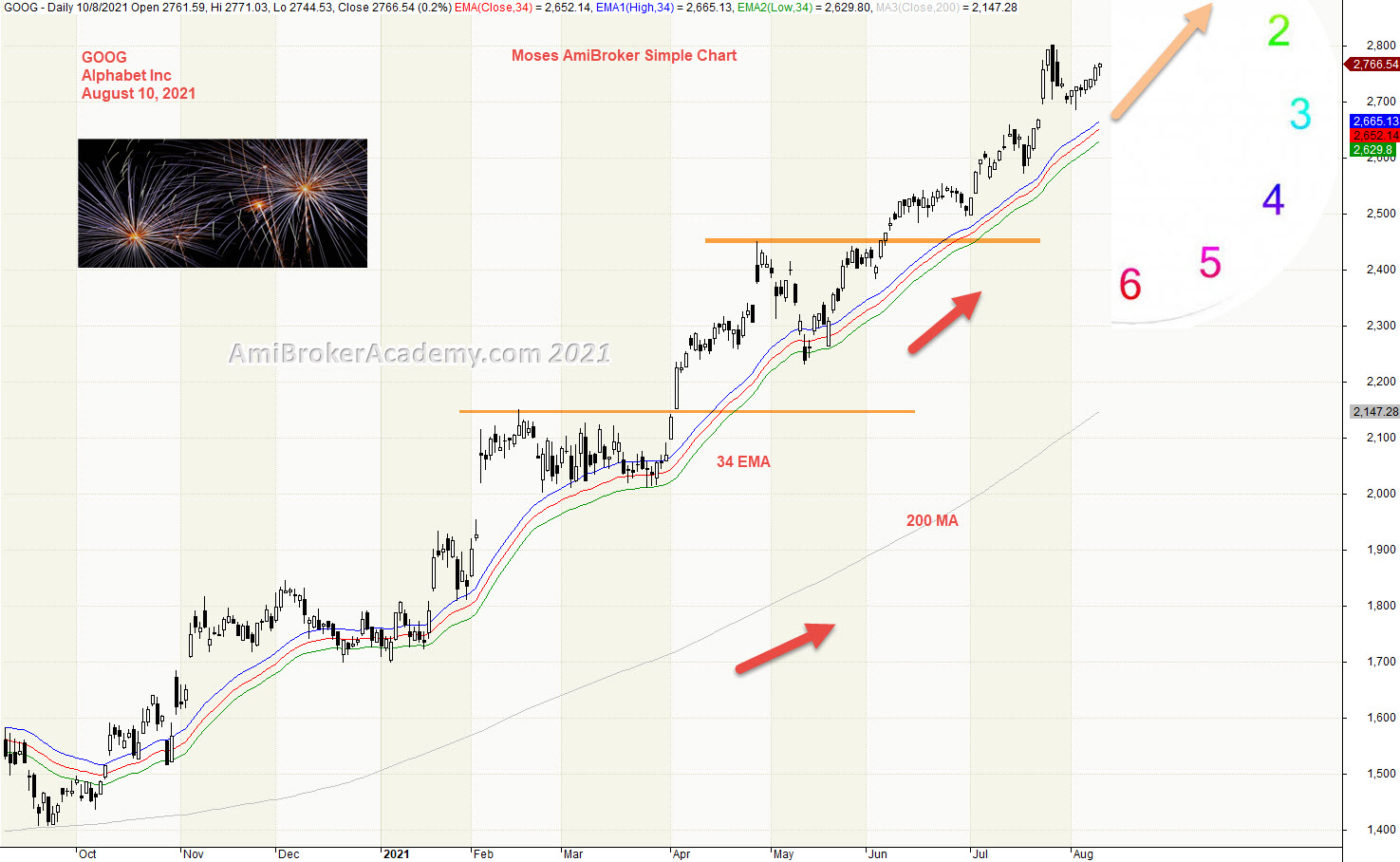
1) GOOG | Alphabet Inc and River
Study Alphabet Inc stock price action. Using moving averages, moving average is a good visual tool. For example Raghee uses 34 EMA, high, low and close moving averages to study the wave direction. We call the three MAs band as River.
River provides a very simple and direct bull or bear indication. When River pointing up, bull trend. When River pointing down, bear trend. When bull trend, price action is always above River. When bear trend, price action always below River.
River is pointing to one o’clock direction.
See chart, price action after cross up River, and it stays above the River.
Remember, we just read what the chart said. Have fun!
20210810 Alphabet Inc and River
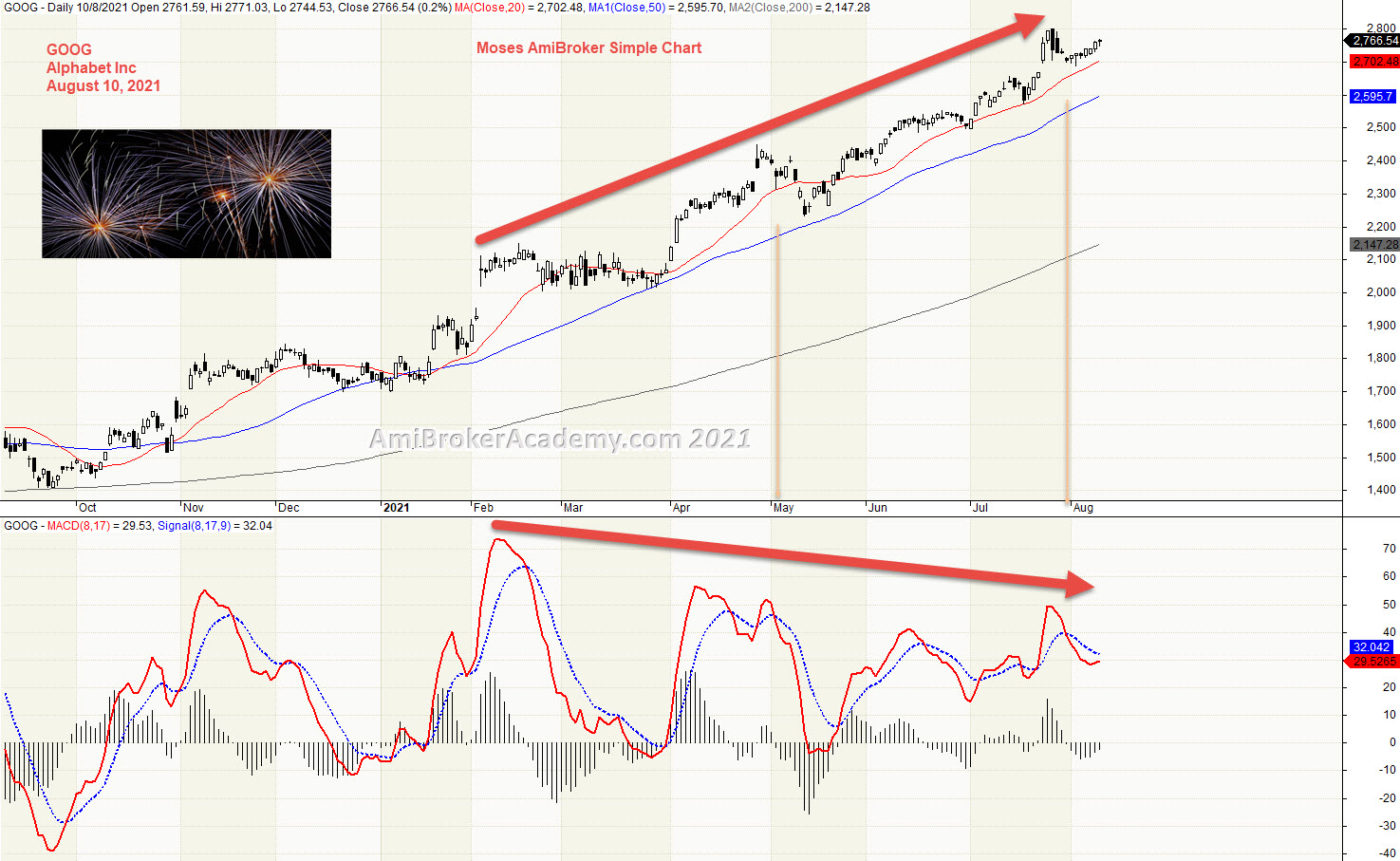
2) Alphabet Inc and MACD Divergence
MACD is a great reversal tool, price action will pullback when it is weaken.
From the chart, price action continues to go higher. MACD forms lower high. MACD is like traffic light, MACD Divergence signal is potential pullback. You don’t stop at every traffic light, therefore MACD Divergence does not resulting a pullback. But the pullback could be real.
Trade what you see. Mange your risk.
20210810 Alphabet Inc and MACD Divergence
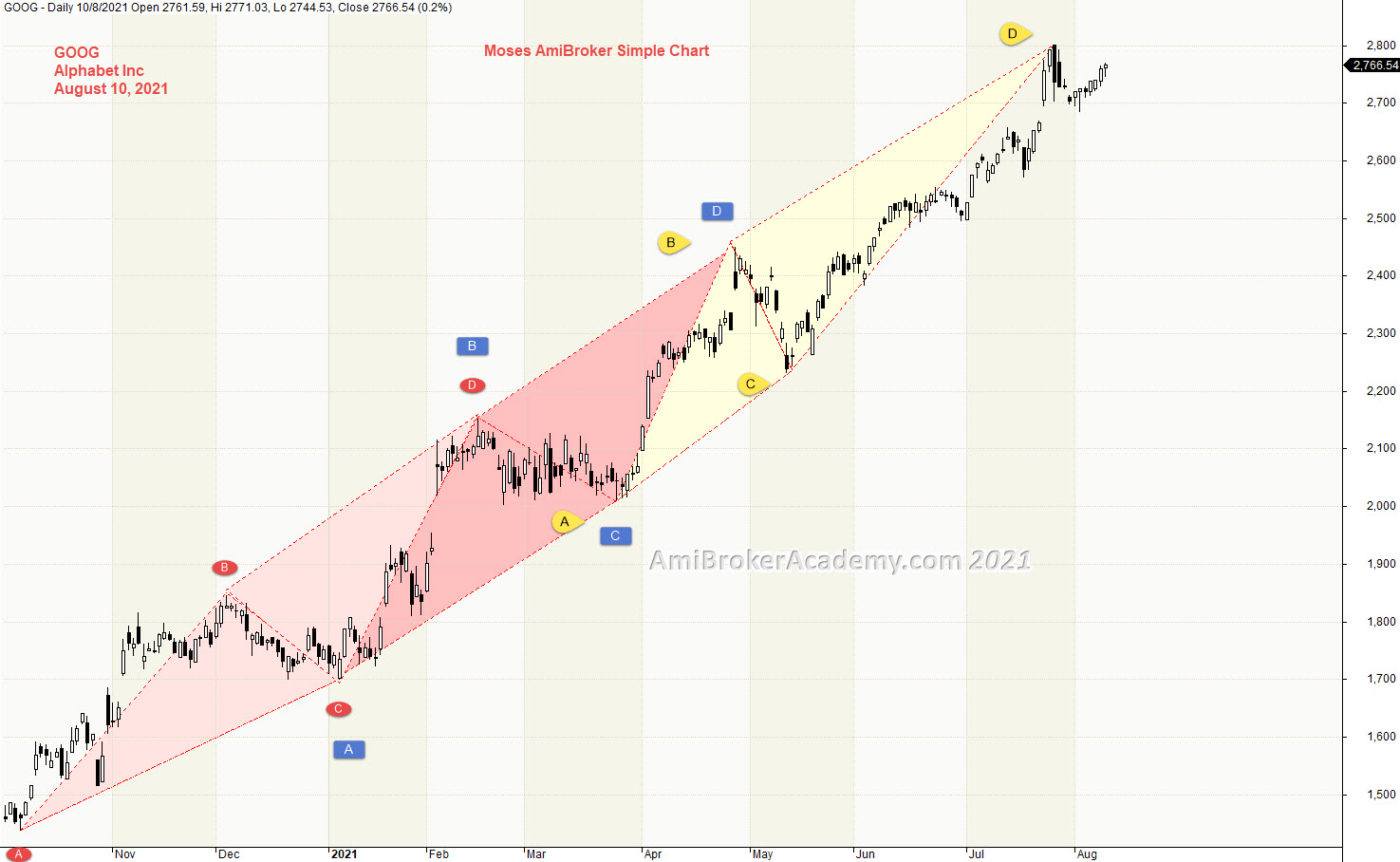
3) Alphabet Inc and symmetry price action
Market has memory, therefore many of the traders, including professional traders are trading on chart pattern, past memory.
See chart, there are many symmetrical triangles. Therefore, we find many AB=CD pattern.
We like to buy support sell resistance whenever that is possible.
Manage your risk.
20210810 Alphabet Inc and symmetry price action
Moses Power Charting
Official AmiBrokerAcademy.com Charting
Disclaimer
The above result is for illustration purpose. It is not meant to be used for buy or sell decision. We do not recommend any particular stocks. If particular stocks of such are mentioned, they are meant as demonstration of Amibroker as a powerful charting software and MACD. Amibroker can program to scan the stocks for buy and sell signals.
These are script generated signals. Not all scan results are shown here. The MACD signal should use with price action. Users must understand what MACD and price action are all about before using them. If necessary you should attend a course to learn more on Technical Analysis (TA) and Moving Average Convergence Divergence, MACD.
Once again, the website does not guarantee any results or investment return based on the information and instruction you have read here. It should be used as learning aids only and if you decide to trade real money, all trading decision should be your own.
We learn from many past and present great traders. Kudo to these master.
Welcome to AmiBroker Academy dot com, amibrokeracademy.com.
1) AMZN | Amazon.com Inc and River
Study Amzon.com Inc stock price action. We use moving averages, moving average is a good visual tool. Raghee uses 34 EMA, high, low and close moving averages to study the wave direction. We call the three MAs band as River. Besides study the wave direction, River we be used as support and resistance. River resist when price action below the River. River support when price action above the River. Bull trend, when the price action slopping up. Bear trend, when the price action slopping down.
See chart, we find the stock price finally supported by RIver. River is pointing between four and five o’clock.
Remember, we just read what the chart said. Have fun!
In our previous analysis, we see there is a potential bear ABCD pattern.
20210806 Amazon.com Inc and River
2) Amazon.com Inc and Ichimoku Cloud
Ichimoku Cloud is a great trending tool, price action is either above or below cloud. Following the trend, the tool can prevent you from trading in a wrong direction.
From the chart, price action was in and out of cloud to finally above the cloud.
Trade what you see. Mange your risk.
20210806 Amazon.com Inc and Ichimoku Cloud
3) Amazon.com Inc and Price Action ABCD Pattern
Price Action after test the peak and pullback.
When you connect most of the peak, the resistance. You can see the resistance and support. Price Action is currently below the key level, see chart.
We like to buy support sell resistance whenever that is possible.
Manage your risk.
20210806 Amazon.com Inc and Price Action ABCD Pattern
Moses Power Charting
Official AmiBrokerAcademy.com Charting
Disclaimer
The above result is for illustration purpose. It is not meant to be used for buy or sell decision. We do not recommend any particular stocks. If particular stocks of such are mentioned, they are meant as demonstration of Amibroker as a powerful charting software and MACD. Amibroker can program to scan the stocks for buy and sell signals.
These are script generated signals. Not all scan results are shown here. The MACD signal should use with price action. Users must understand what MACD and price action are all about before using them. If necessary you should attend a course to learn more on Technical Analysis (TA) and Moving Average Convergence Divergence, MACD.
Once again, the website does not guarantee any results or investment return based on the information and instruction you have read here. It should be used as learning aids only and if you decide to trade real money, all trading decision should be your own.
We learn from many past and present great traders. Kudo to these master.
Welcome to AmiBroker Academy dot com, amibrokeracademy.com.
Geometry in the Trading Market
Look back technical analysis history, price action and geometry from record was started way back to 1930s from Gann, W. D. Gann.
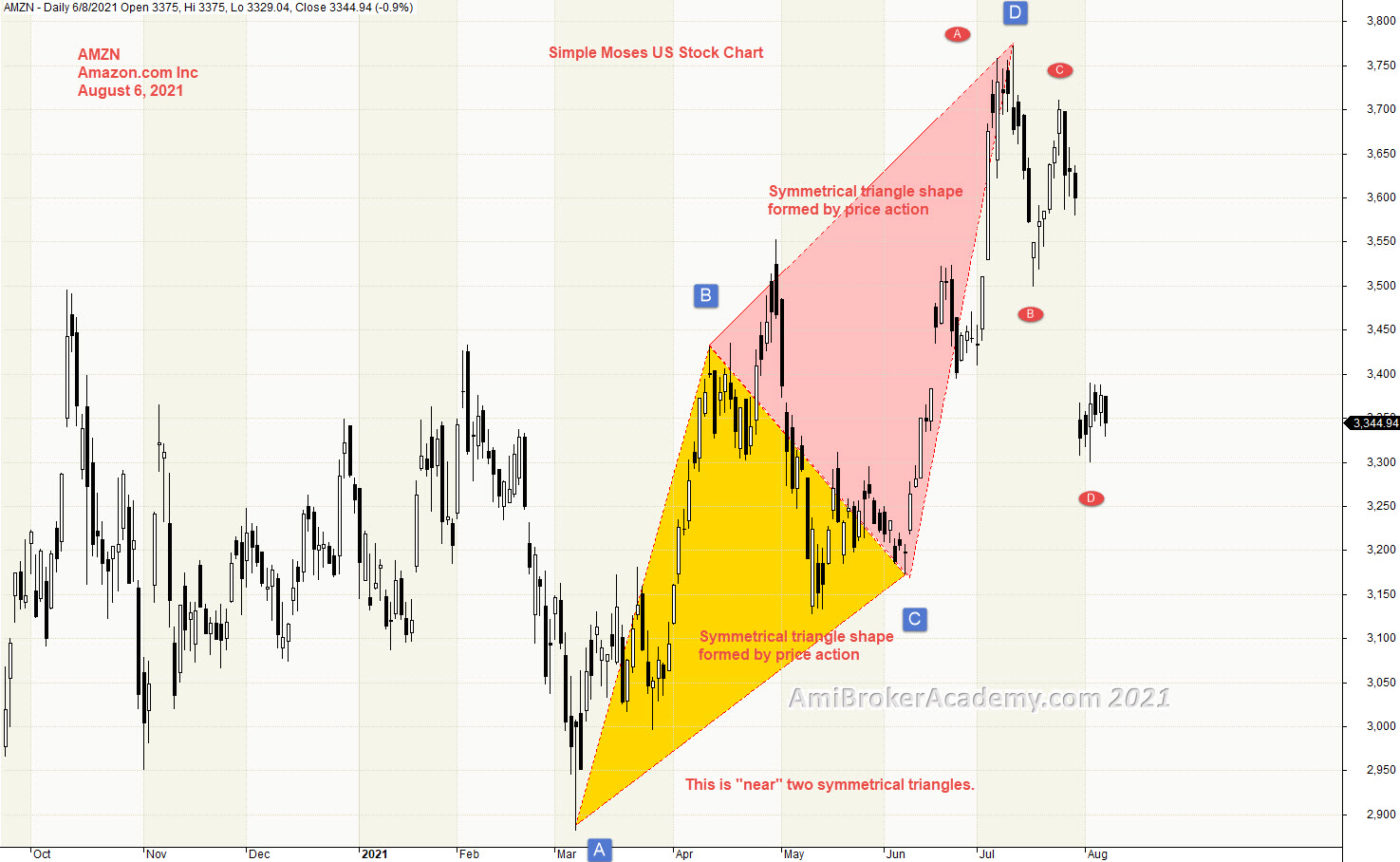
1) AMZN | Amazon.com Inc and Price Action
Study US stock market, Amazon.com Inc price action.
We are see two symmetrical triangles, the two symmetrical triangles forming AB=CD pattern.
Larry Pesavento is one of the great trader spend many years in the symmetrical triangles, which are formed the basis of AB=CD pattern. One of the recent book, Trade What You See.
We could identify two symmetrical triangles, and AB = CD pattern.
20210806 Amazon.com Inc and Price Action
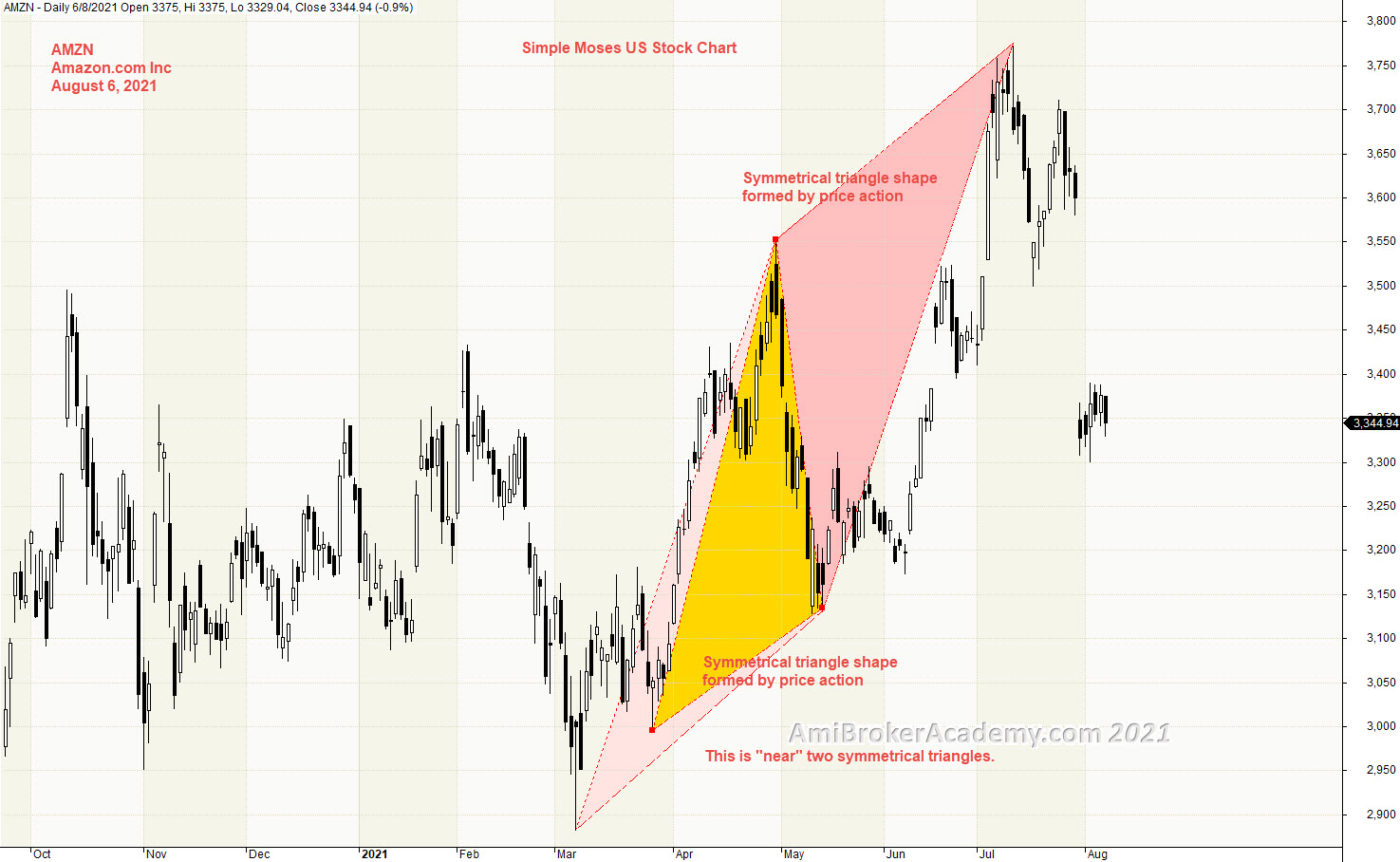
2) Another View | AMZN | Amazon.com Inc and Price Action
The above chart, seem like we force the symmetrical triangles. See the following the triangles is another way to draw the triangles.
Trade with eyes open, and what you see.
Mange your risk.
20210806 Amazon.com Inc and Symmetrical Triangles
Moses Power Charting
Official AmiBrokerAcademy.com Charting
Disclaimer
The above result is for illustration purpose. It is not meant to be used for buy or sell decision. We do not recommend any particular stocks. If particular stocks of such are mentioned, they are meant as demonstration of Amibroker as a powerful charting software and MACD. Amibroker can program to scan the stocks for buy and sell signals.
These are script generated signals. Not all scan results are shown here. The MACD signal should use with price action. Users must understand what MACD and price action are all about before using them. If necessary you should attend a course to learn more on Technical Analysis (TA) and Moving Average Convergence Divergence, MACD.
Once again, the website does not guarantee any results or investment return based on the information and instruction you have read here. It should be used as learning aids only and if you decide to trade real money, all trading decision should be your own.
We learn from many past and present great traders. Kudo to these master.
Welcome to AmiBroker Academy dot com, amibrokeracademy.com.
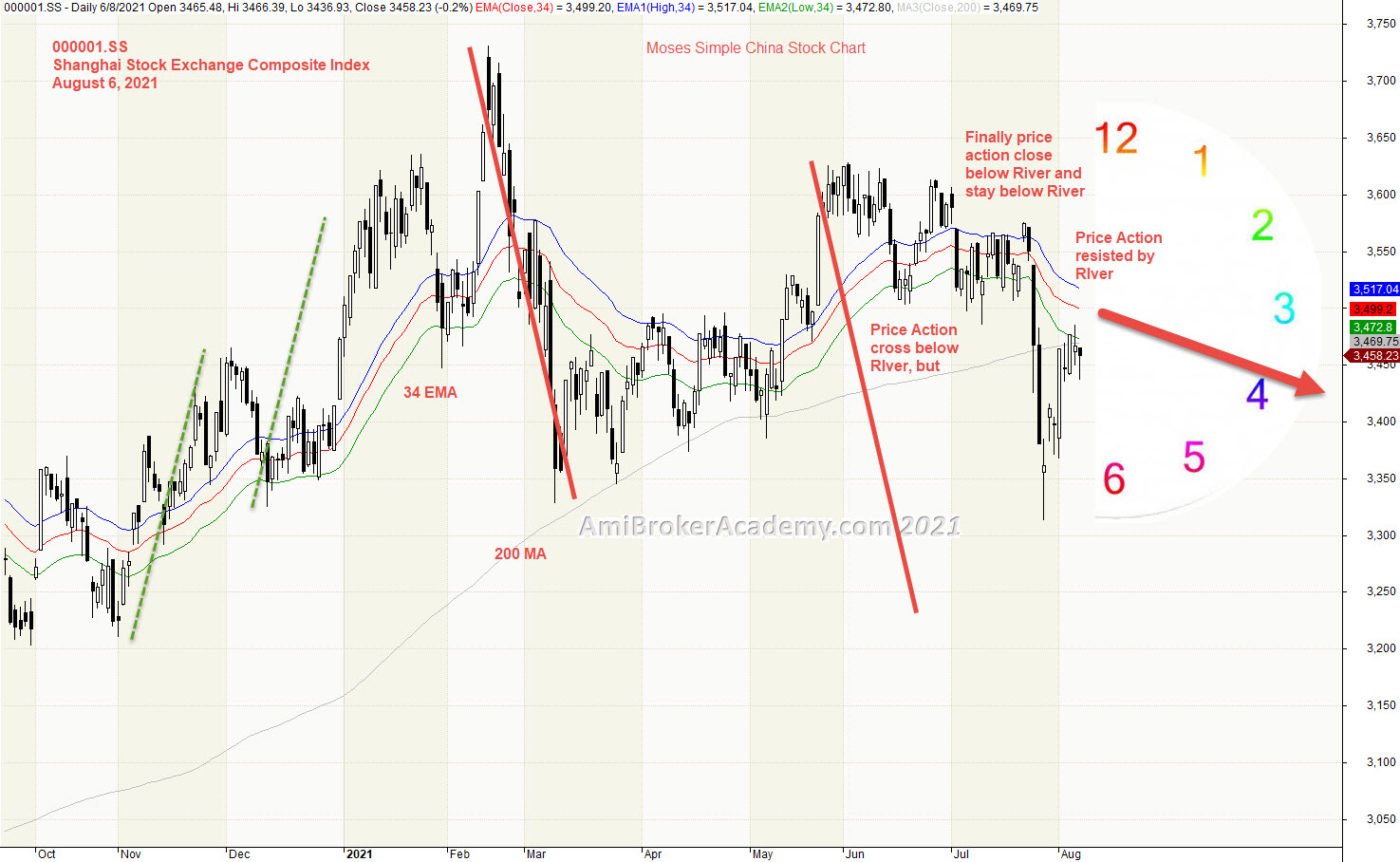
1) 000001.SS | Shanghai Stock Exchange Composite Index
Study China stock market, Shanghai Stock Exchange Composite Index price action. We use moving averages, moving average is a good visual tool. Raghee use 34 EMA, high, low and close moving averages. We call the band as River. From the River we can see price action either above or below river. River can act as support or resistance.
See chart, we find the stock price finally resisted by RIver. River is pointing between three and four o’clock.
Remember, we just read what the chart said. Have fun!
In our previous analysis, from the H M Gartley pattern, we see there is a potential bear ABCD pattern.
20210806 Shanghai Stock Exchange Composite Index and River
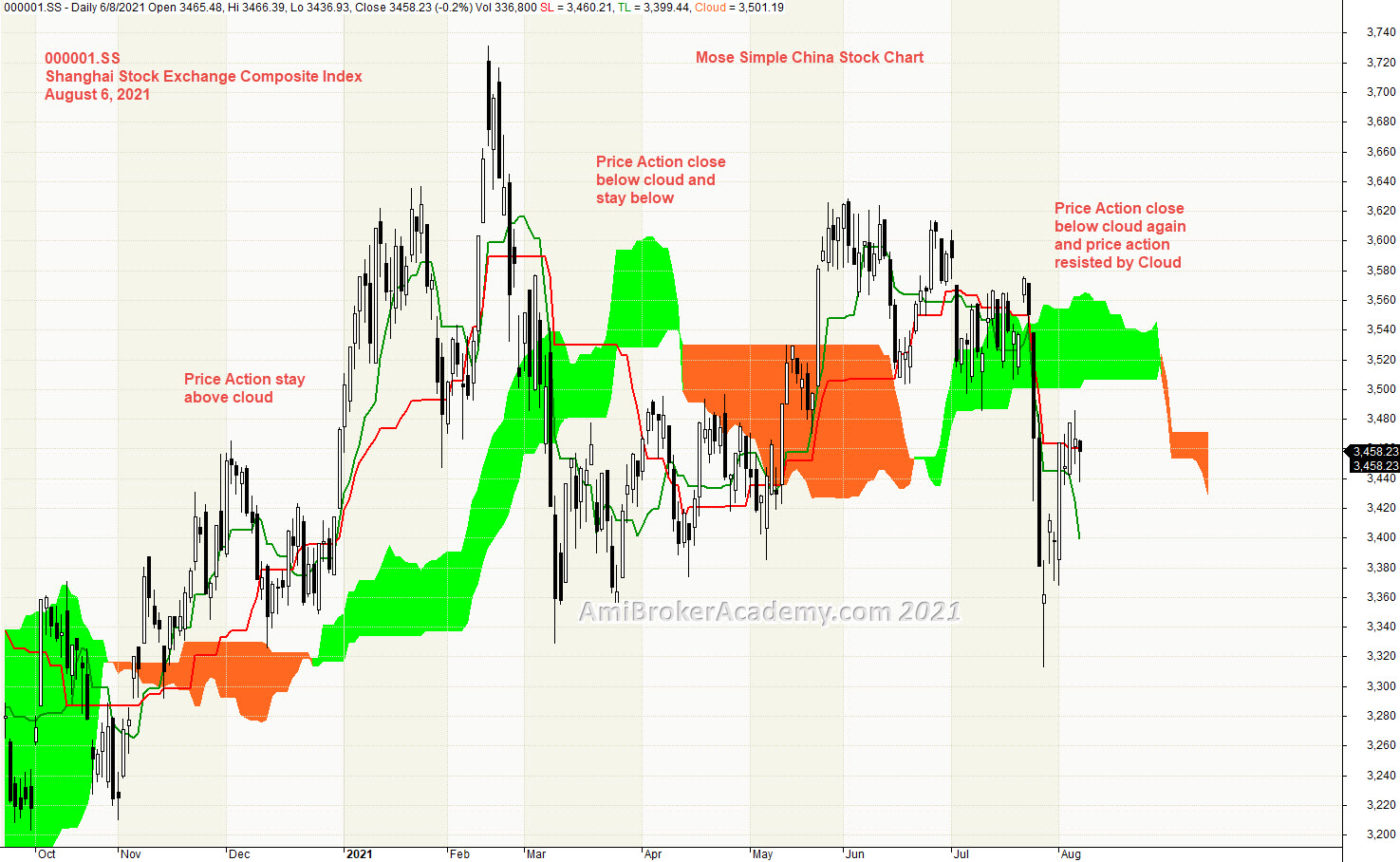
2)Shanghai Stock Exchange Composite Index
Ichimoku Cloud is a great trending tool, price action is either above or below cloud. Following the trend, the tool can prevent you from trading in a wrong direction.
From the chart, price action from above the cloud to finally below the cloud. Now price action is below cloud and become bear trend.
Trade what you see. Mange your risk.
August 6, 2021 Shanghai Stock Exchange Composite Index and Ichimoku Cloud
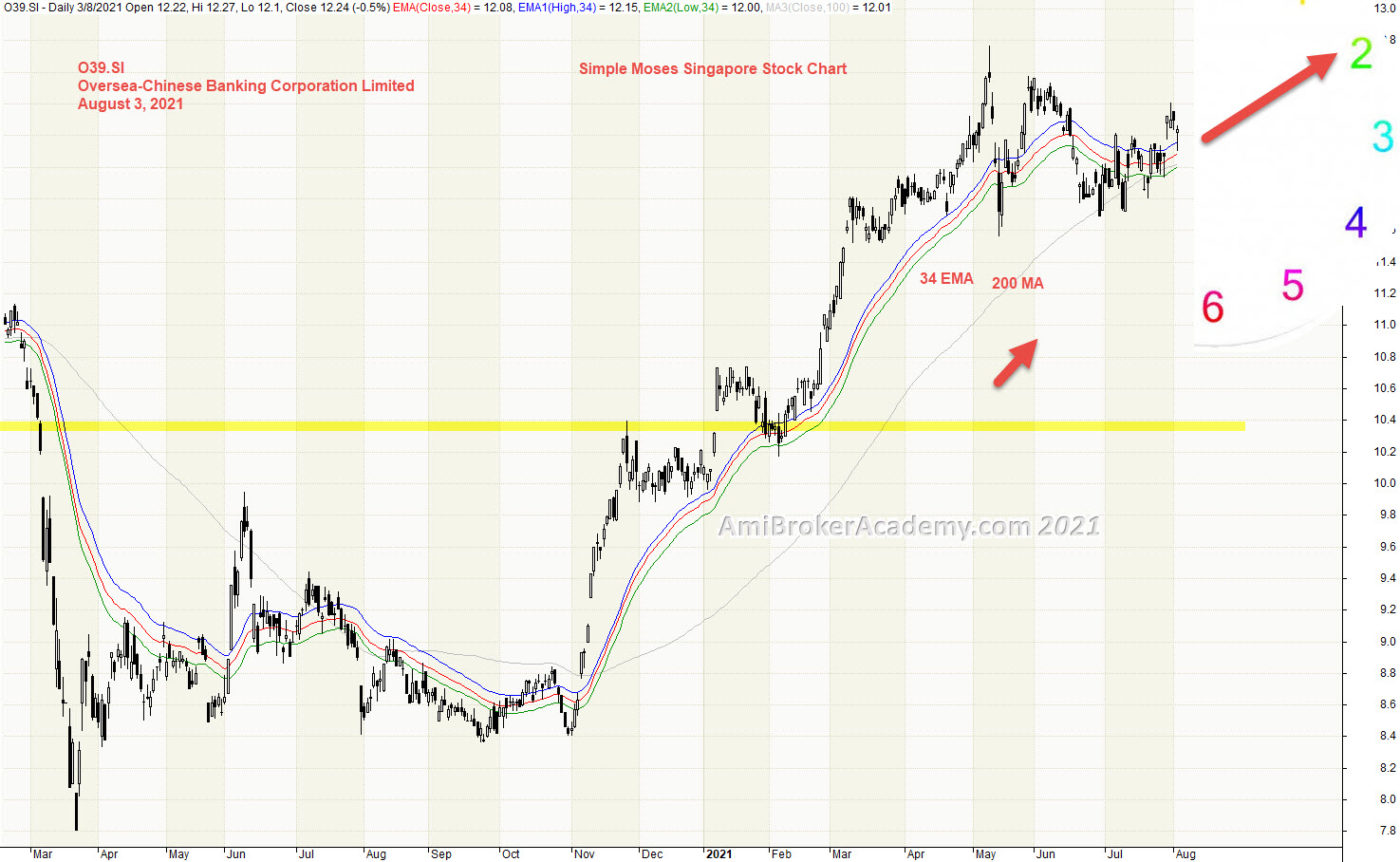
3) OCBC Oversea-Chinese Banking Corporation and River
Price Action is pointing to Two o’clock direction, price action is very bull bias. See chart, we see the trend is slopping up and up.
Moving Average is a great visual tool. Raghee uses high, low and close of 34 EMA to form a band to determine the wave direction. Price action goes from below 34 EMA to above River. Occasionally, price action deep below the RIver, very quickly go above again. Price Action may go higher
River is a great support resistance tool too. Catch the support to find the entry. Remember to reduce risk by buy support and take profit to sell resistance.
Manage your risk.
20210803 OCBC Oversea-Chinese Banking Corporation and River
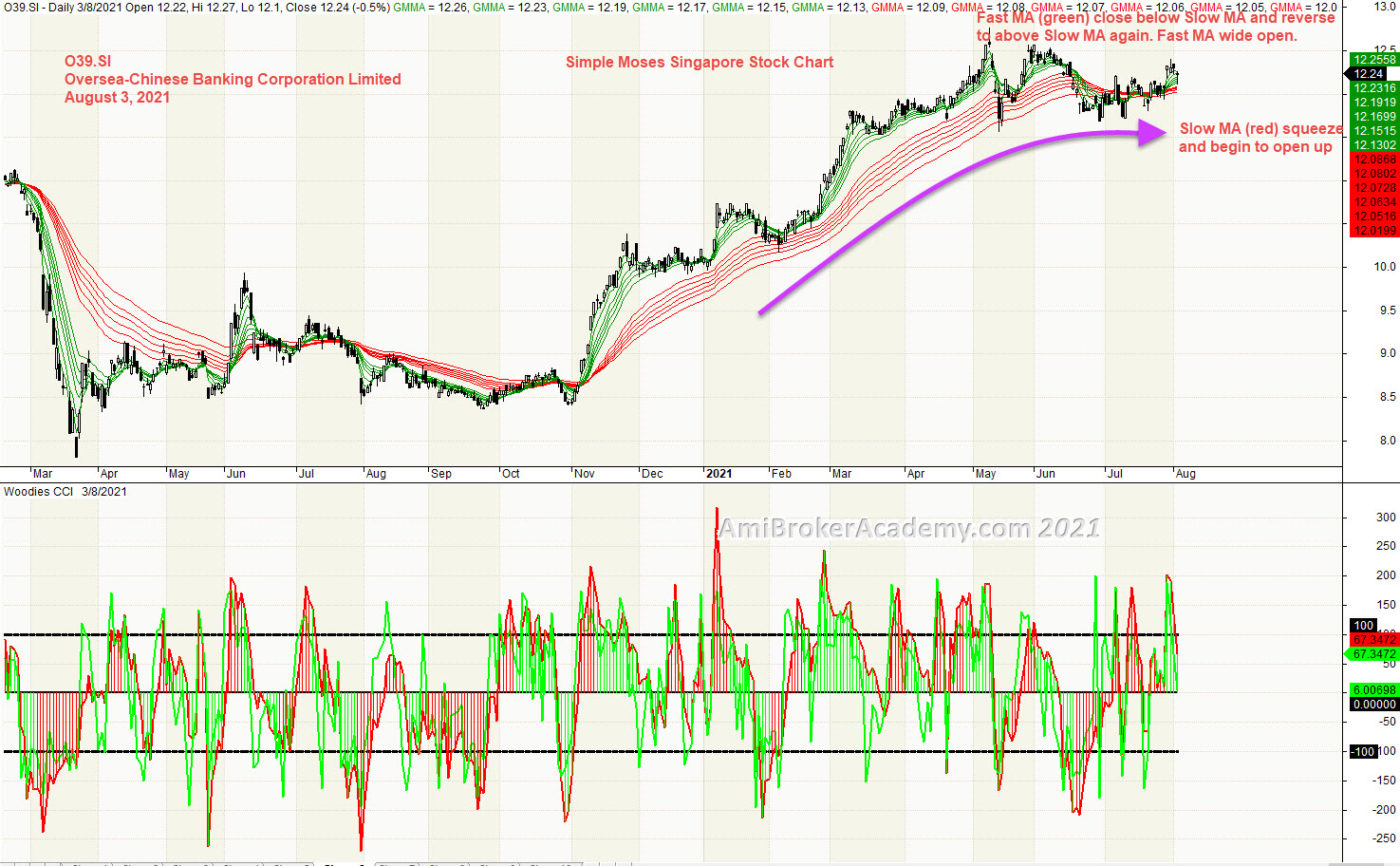
4) OCBC Oversea-Chinese Banking Corporation and GMMA and Woodies CCI
We ask you to stand aside when you are not sure. Study OCBC stock price action with GMMA and Woodies.
Bull trend, why? Price action and Fast MA (green) from bottom to above Slow MA (red) and stay above.
From Woodies CCI, price action continues to go higher. But, Woodies CCi is forming lower high. Divergence. Price Action might be topping. Trade with eyes open.
Mange your risk.
20210803 OCBC Oversea-Chinese Banking Corporation and GMMA and Woodies CCI
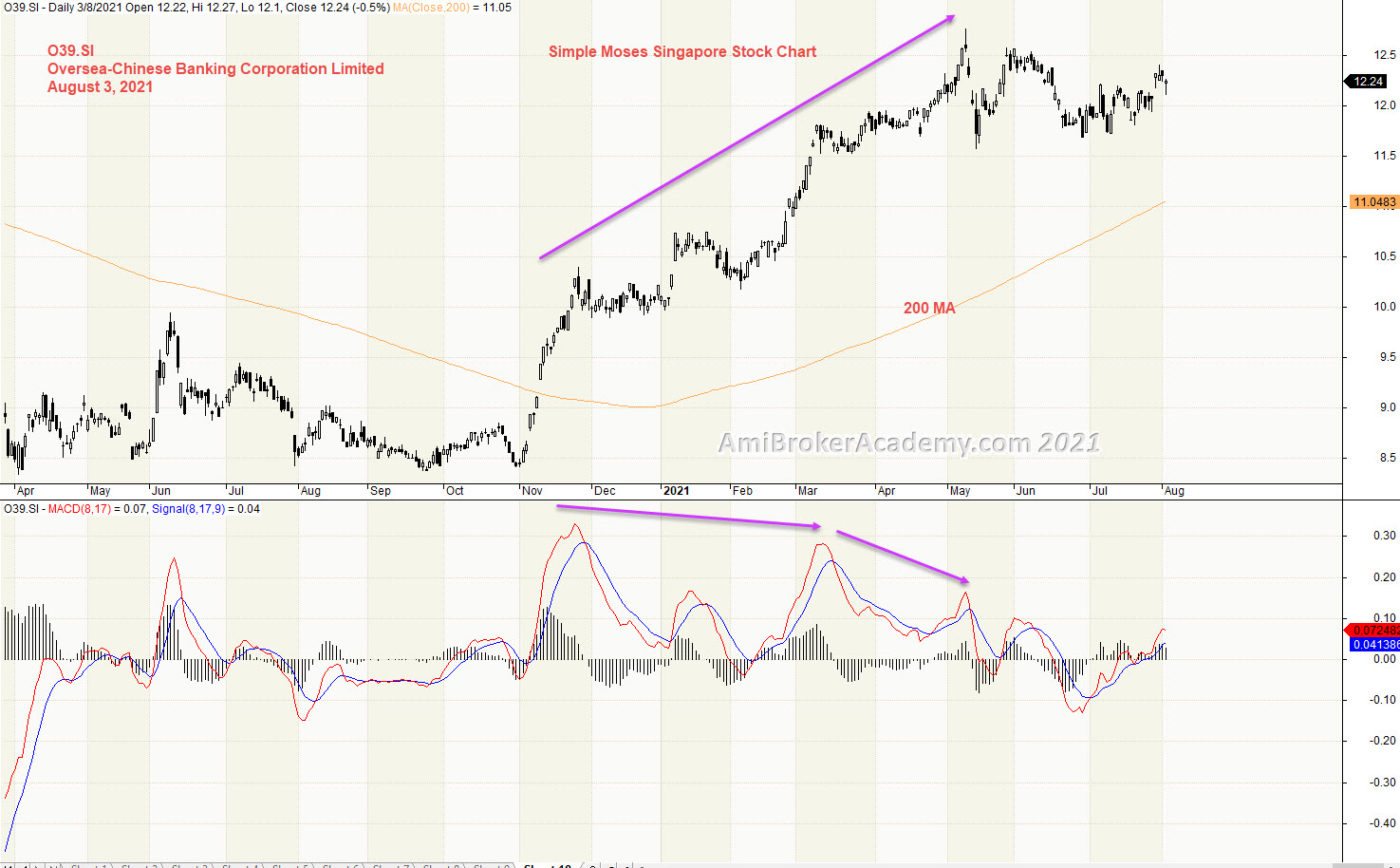
6) OCBC Oversea-Chinese Banking Corporation and MACD
We study price action we see MACD Divergence, price action continues to go higher, but MACD begin to form lower high and MACD Histogram to form lower high. So we expect a reversal is going to happen. But by now everyone has learnt that MACD Divergence is like a traffic light, you don’t stop at every traffic light. So, be the MACD Divergence. The price action may not pullback. But topping signal has now showed.
Trade what you see. We are looking for bear signal, and confirmation. MACD cross signal is a good indication to lookout for.
So, read the information you can get from the chart.
Remember, we just read what the chart said. Have fun!
But. don’t play play with MACD indicator. Very simple yet powerful.
20210803 OCBC Oversea-Chinese Banking Corporation and MACD
Moses Power Charting
Official AmiBrokerAcademy.com Charting
Disclaimer
The above result is for illustration purpose. It is not meant to be used for buy or sell decision. We do not recommend any particular stocks. If particular stocks of such are mentioned, they are meant as demonstration of Amibroker as a powerful charting software and MACD. Amibroker can program to scan the stocks for buy and sell signals.
These are script generated signals. Not all scan results are shown here. The MACD signal should use with price action. Users must understand what MACD and price action are all about before using them. If necessary you should attend a course to learn more on Technical Analysis (TA) and Moving Average Convergence Divergence, MACD.
Once again, the website does not guarantee any results or investment return based on the information and instruction you have read here. It should be used as learning aids only and if you decide to trade real money, all trading decision should be your own.
We learn from many past and present great traders. Kudo to these master.
Welcome to AmiBroker Academy dot com, amibrokeracademy.com.
We have been provide our stock chart and analysis for two decades. If you search for amibroker academy, you probably for get all the details about us.
We notice the landscape for trading search has change. We decide to start a deferent prospective for now on. We will try to do it from a inner thinking process. Will try.
1) How You Start?
There are many way to pick a stock for analysis. One is from friend recommendation. Another is from a stock scan script to identify a ‘good’ stock to analyse. Good stock is the script you run, has identified the stock potentially going to move soon or in a near future.
When you have a identified a stock. Use a reasonable stock charting software to study the stock.
2) Charting Software
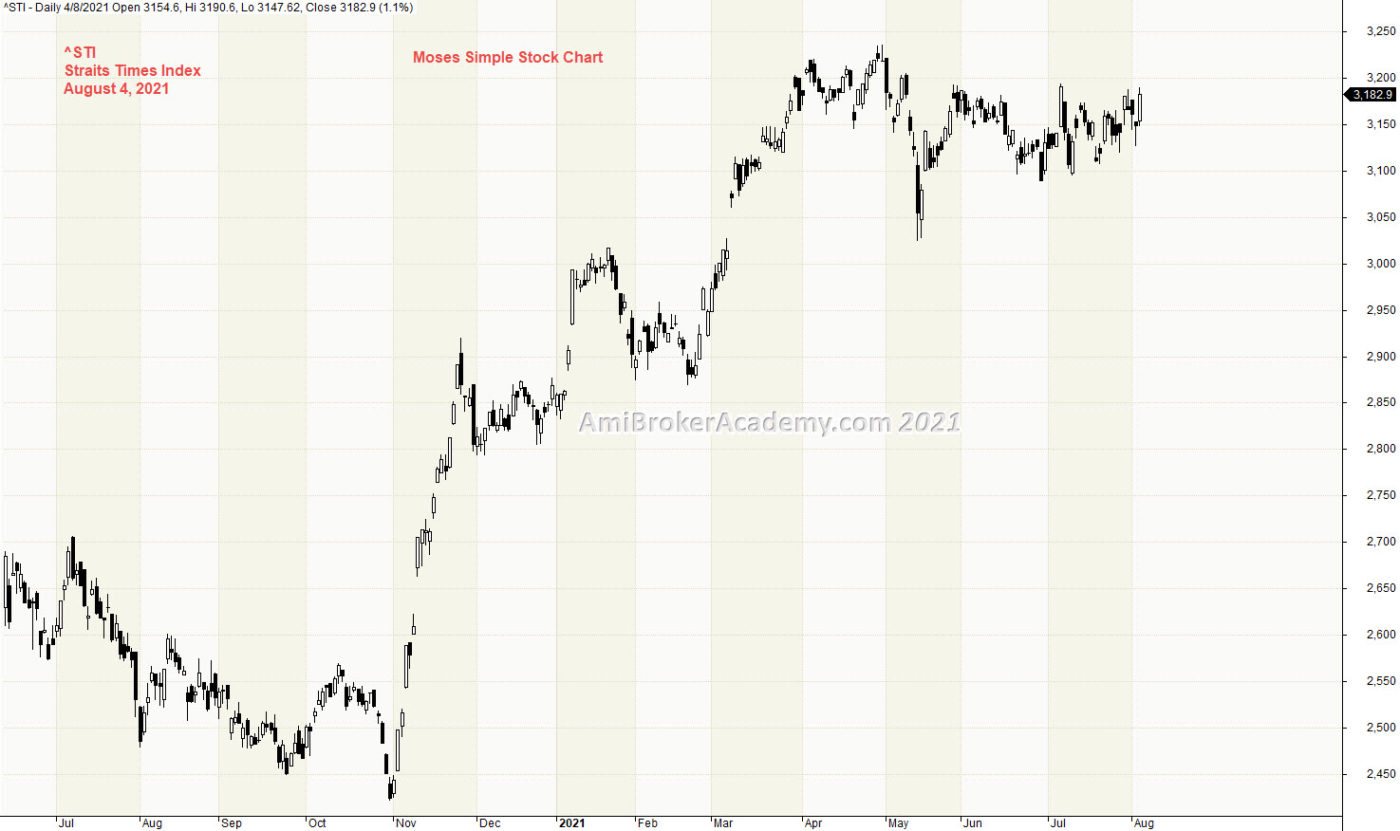
Let use Straits Times Index as an example.
20210804 Straits Times Index and Price Action
Most of the charting software provide different timeframe, such as 5 minutes, one hour, four hours, day, week, month, or year timeframe. Amibroker charting software is a great tool. You could even download a evaluation copy to check their features out.
Let’s use the daily chart. one key reason, we use the free stock data from Yahoo Finance, so we use EOD, End of Day chart.
Three hundred bars is a good number of candlesticks to study a stock chart. One month has around twenty bars, ten months are about two hundred bars. We use an average of ten, twelve or fourteen months in one chart.
3) What Are You looking for on a Chart? Buy or Sell
When you look at a chart, what are you looking for? First you are looking for buy or sell opportunity. And what will cause you to buy or sell. You buy if the stock is in bull trend. You sell if the stock price is in bear trend.
So, if price action move from low to high, bull trend. When price action moves from high to low, bear trend. When buy look for bull signals to buy. When sell look for bear signals to sell. So, one approach is buy low sell high, in other words buy support sell resistance.
4) What Chart to Look At?
In fact, for price action. There is only three things will happen on a stock chart, one, price action goes higher, two, price action pullback lower, three, price action not move at all.
So, one approach, is only study a bull trend chart to find bull signal to enter the buy entry.
5) So, the sequence on stock analysis
Identify a stock
Limit chart to 240 candlesticks
Find the stock trend
Skill those bear trend stock chart
Find bull signal for entry, if not sure stand aside
When spot the bull trend, look for confirmation before enter the trade
The above is the inner process of a trader.
Moses Power Charting
Official AmiBrokerAcademy.com Charting
Disclaimer
The above result is for illustration purpose. It is not meant to be used for buy or sell decision. We do not recommend any particular stocks. If particular stocks of such are mentioned, they are meant as demonstration of Amibroker as a powerful charting software and MACD. Amibroker can program to scan the stocks for buy and sell signals.
These are script generated signals. Not all scan results are shown here. The MACD signal should use with price action. Users must understand what MACD and price action are all about before using them. If necessary you should attend a course to learn more on Technical Analysis (TA) and Moving Average Convergence Divergence, MACD.
Once again, the website does not guarantee any results or investment return based on the information and instruction you have read here. It should be used as learning aids only and if you decide to trade real money, all trading decision should be your own.
We learn from many past and present great traders. Kudo to these master.
Welcome to AmiBroker Academy dot com, amibrokeracademy.com.
Secret Code
The analysis is not for everyone.
This is not a site for those whom just want to find buy or sell signal. Because we don’t provide you any buy or sell information, we only provide you the thought you can decide and take responsibility.
Trading is all about observation, reading the price bar and not news. By the time you hear the news it is already old and become history. Why? It is very simple, remember where the news come from? It has first someone release to the news agency like CNBC, and so on. Next, someone has to read the news to you after some research and summarize. This will be few hours later, by then the price action has already done.
As for price bar, it is what the market supply and remand. When market feel that is over price, the price will drop. All this reflected on the price bar almost instantly.
Next is how to read our price bar plus using some tools, such as MACD.
Here, we simply translate price action chart into layman language. This will help you in understand the financial instrument you are trading. We believe picture worth a thousand words. So, sometimes we use less words. You can learn the price action interpretation too. Give it a tray. You may not have the same view points as us. Remember all analysis read price action chart differently. It is just like reading an essay, we will have different conclusion.
Trade well.
Trade what you see. Manage your risk.
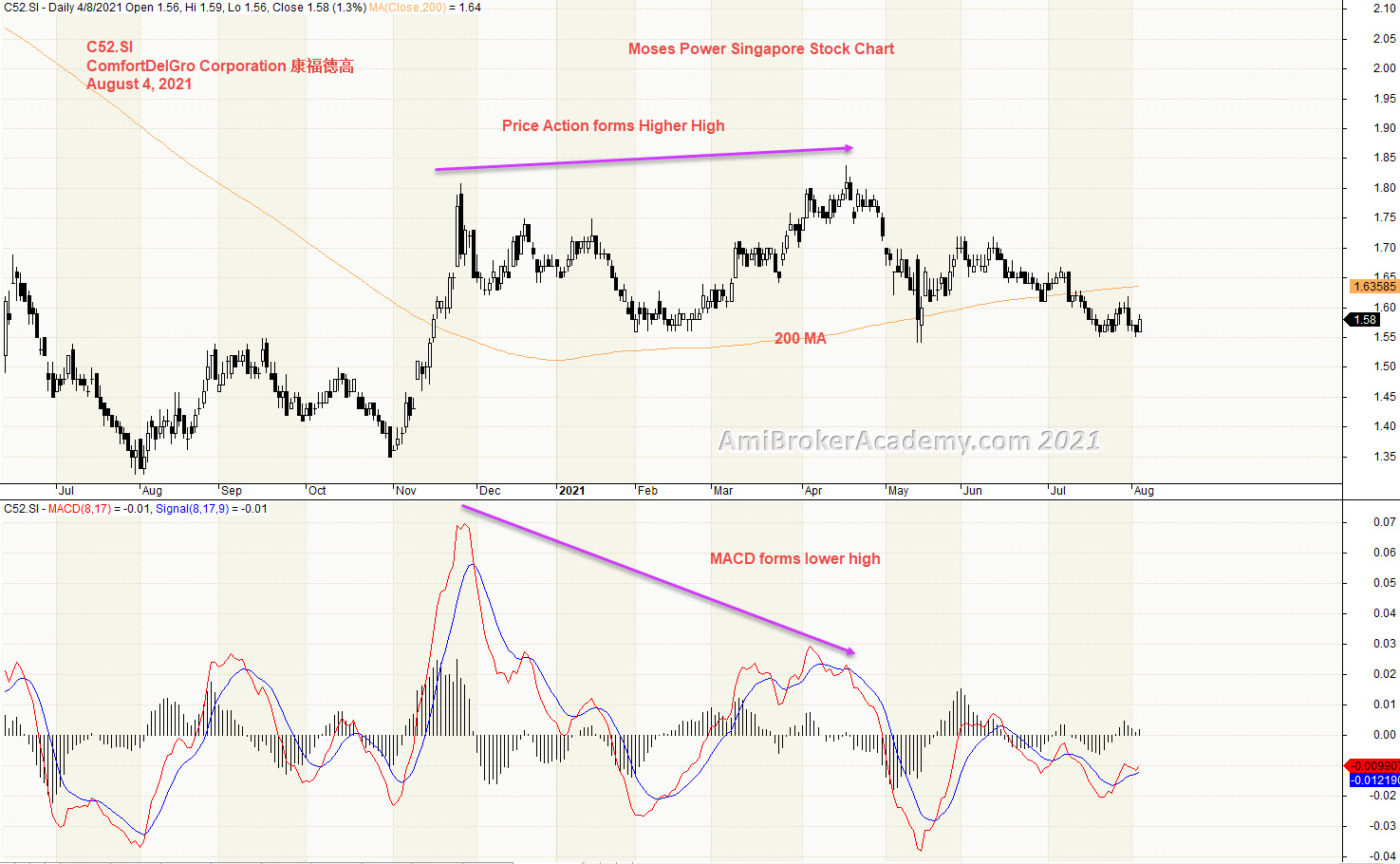
1) ComfortDelGro Corporation and MACD Divergence
Price Action goes from low to high. Price Action forms higher high. But, MACD forms lower high.
Look out price action to pullback. But MACD Divergence is like traffic light, you don’t stop at every traffic light. This is true for MACD Divergence. Look out for confirmation to take profit.
Manage your risk.
20210805 ComfortDelGro Corp and MACD
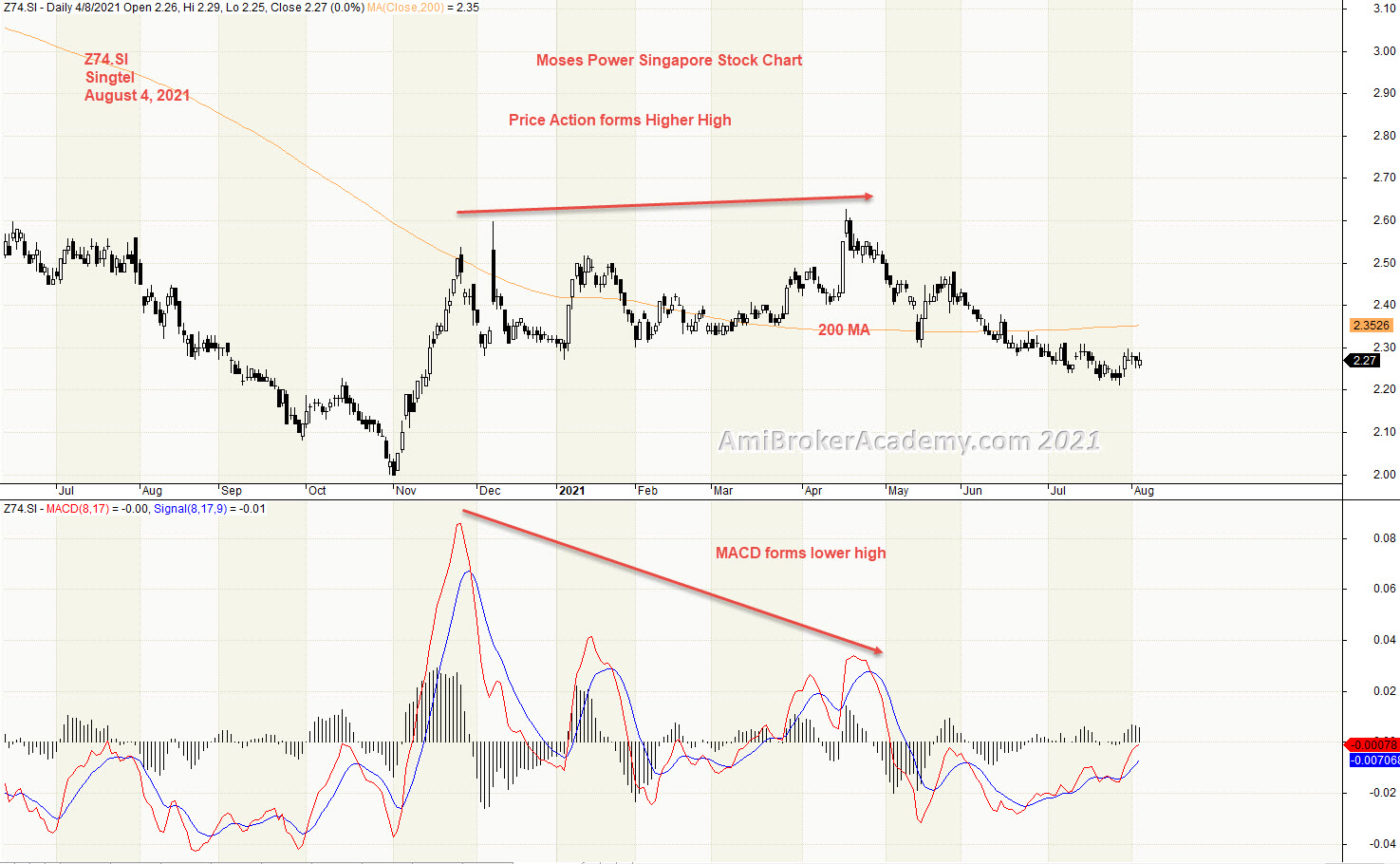
2) Singtel Singapore Telecommunications and MACD Divergence
Singtel has a similar MACD Divergence, price action forms higher high, and MACD forms lower high. Trade with eyes open.
20210804 Singtel Singapore Telecommunications and MACD Divergence
Moses Power Charting
Official AmiBrokerAcademy.com Charting
Disclaimer
The above result is for illustration purpose. It is not meant to be used for buy or sell decision. We do not recommend any particular stocks. If particular stocks of such are mentioned, they are meant as demonstration of Amibroker as a powerful charting software and MACD. Amibroker can program to scan the stocks for buy and sell signals.
These are script generated signals. Not all scan results are shown here. The MACD signal should use with price action. Users must understand what MACD and price action are all about before using them. If necessary you should attend a course to learn more on Technical Analysis (TA) and Moving Average Convergence Divergence, MACD.
Once again, the website does not guarantee any results or investment return based on the information and instruction you have read here. It should be used as learning aids only and if you decide to trade real money, all trading decision should be your own.
We learn from many past and present great traders. Kudo to these master.
Welcome to AmiBroker Academy. Thanks for visiting the site.
Moving Average Convergence Divergence, MACD Screener
MACD was developed by Gerald Appel in the late seventies.
MACD stands for Moving Average Convergence
Divergence, the MACD line (red line or called fast line) and MACD signal line
(blue line, or called slow line).
MACD
Bullish Signal Line Cross: MACD bullish signal when red line crosses above
the blue line or MACD line crosses above zero line.
MACD
Bearish Signal Line Cross: MACD bearish signal when blue line crosses below
red line or MACD line crosses below zero line.
MACD Scan
These are stocks picked for today.
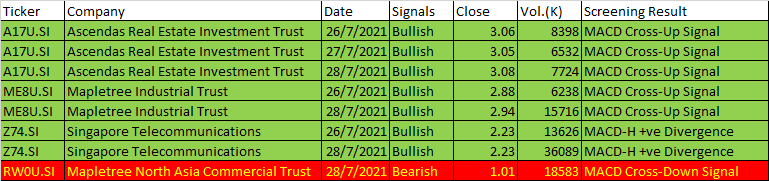
Some of 26 to 30 July, 2021 AmiBroker AFL Script Generated Five-day Singapore Stock MACD Signals
Ticker
Company
Date
Signals
Close
Vol.(K)
Screening Result
A17U.SI
Ascendas Real Estate Investment Trust
26/7/2021
Bullish
3.06
8398
MACD Cross-Up Signal
A17U.SI
Ascendas Real Estate Investment Trust
27/7/2021
Bullish
3.05
6532
MACD Cross-Up Signal
A17U.SI
Ascendas Real Estate Investment Trust
28/7/2021
Bullish
3.08
7724
MACD Cross-Up Signal
ME8U.SI
Mapletree Industrial Trust
26/7/2021
Bullish
2.88
6238
MACD Cross-Up Signal
ME8U.SI
Mapletree Industrial Trust
28/7/2021
Bullish
2.94
15716
MACD Cross-Up Signal
Z74.SI
Singapore Telecommunications
26/7/2021
Bullish
2.23
13626
MACD-H +ve Divergence
Z74.SI
Singapore Telecommunications
28/7/2021
Bullish
2.23
36089
MACD-H +ve Divergence
RW0U.SI
Mapletree North Asia Commercial Trust
28/7/2021
Bearish
1.01
18583
MACD Cross-Down Signal
202107 26 to 30 Singapore Fice (5)-day MACD Signals
Moses Stock Scan
Power Free Singapore Stock MACD Scan Signals AmiBroker Academy.com
Disclaimer: The above result is for illustration purpose. It is not meant to be used for buy or sell decision. We do not recommend any particular stocks on our website. If particular stocks of such are mentioned, they are meant as illustration or demonstration of Amibroker as a powerful charting software or MACD scanner. Amibroker can program to scan the stocks that have MACD buy or sell signals.
These are script generated signals. Not all scan results are shown here. The MACD signal should use with price action and confirmation. Users must understand what MACD and price action are all about before using them. If necessary you should attend a course to learn more about Technical Analysis (TA) and Moving Average Convergence Divergence, MACD.
Once again, the website does not guarantee any results or investment return based on the information and instruction you have read here. It should be used as learning aids only and if you decide to trade real money, all trading decision should be your own, and you should take your own responsibility.
Welcome to AmiBroker Academy. Thanks for visiting the site.
Moving Average Convergence Divergence, MACD Screener
MACD was developed by Gerald Appel in the late seventies.
MACD stands for Moving Average Convergence
Divergence, the MACD line (red line or called fast line) and MACD signal line
(blue line, or called slow line).
MACD
Bullish Signal Line Cross: MACD bullish signal when red line crosses above
the blue line or MACD line crosses above zero line.
MACD
Bearish Signal Line Cross: MACD bearish signal when blue line crosses below
red line or MACD line crosses below zero line.
MACD Scan
These are stocks picked for today.
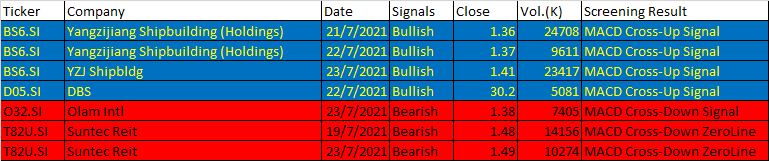
Some of 19 to 23 July, 2021 AmiBroker AFL Script Generated Five-day Singapore Stock MACD Signals
Ticker
Company
Date
Signals
Close
Vol.(K)
Screening Result
BS6.SI
Yangzijiang Shipbuilding (Holdings)
21/7/2021
Bullish
1.36
24708
MACD Cross-Up Signal
BS6.SI
Yangzijiang Shipbuilding (Holdings)
22/7/2021
Bullish
1.37
9611
MACD Cross-Up Signal
BS6.SI
YZJ Shipbldg
23/7/2021
Bullish
1.41
23417
MACD Cross-Up Signal
D05.SI
DBS
22/7/2021
Bullish
30.2
5081
MACD Cross-Up Signal
O32.SI
Olam Intl
23/7/2021
Bearish
1.38
7405
MACD Cross-Down Signal
T82U.SI
Suntec Reit
19/7/2021
Bearish
1.48
14156
MACD Cross-Down ZeroLine
T82U.SI
Suntec Reit
23/7/2021
Bearish
1.49
10274
MACD Cross-Down ZeroLine
202107 19 to 23 Singapore Stock Five-day MACD Signals
Moses Stock Scan
Power Free Singapore Stock MACD Scan Signals AmiBroker Academy.com
Disclaimer: The above result is for illustration purpose. It is not meant to be used for buy or sell decision. We do not recommend any particular stocks on our website. If particular stocks of such are mentioned, they are meant as illustration or demonstration of Amibroker as a powerful charting software or MACD scanner. Amibroker can program to scan the stocks that have MACD buy or sell signals.
These are script generated signals. Not all scan results are shown here. The MACD signal should use with price action and confirmation. Users must understand what MACD and price action are all about before using them. If necessary you should attend a course to learn more about Technical Analysis (TA) and Moving Average Convergence Divergence, MACD.
Once again, the website does not guarantee any results or investment return based on the information and instruction you have read here. It should be used as learning aids only and if you decide to trade real money, all trading decision should be your own, and you should take your own responsibility.
Welcome to AmiBroker Academy dot com, amibrokeracademy.com.
This is not a site for those just want to know buy or sell signals, We don’t provide you the buy or sell information, we provide you the thought you can decide and take responsibility.
Trading is all about observation, reading the price bar and not news. By the time you hear the news it is already old and become history. Why? It is very simple, remember where the news come from? It has first someone release to the news agency like CNBC, and so on. Next, someone has to read the news to you after some research and summarize. This will be few hours later, by then the price action has already done.
As for price bar, it is what the market supply and remand. When market feel that is over price, the price will drop. All this reflected on the price bar almost instantly.
Next is how to read our price bar plus using some tools, such as MACD.
Here, we simply translate price action chart into layman language. This will help you in understand the financial instrument you are trading. We believe picture worth a thousand words. So, sometimes we use less words. You can learn the price action interpretation too. Give it a tray. You may not have the same view points as us. Remember all analysis read price action chart differently. It is just like reading an essay, we will have different conclusion.
Trade well.
Trade what you see. Manage your risk.
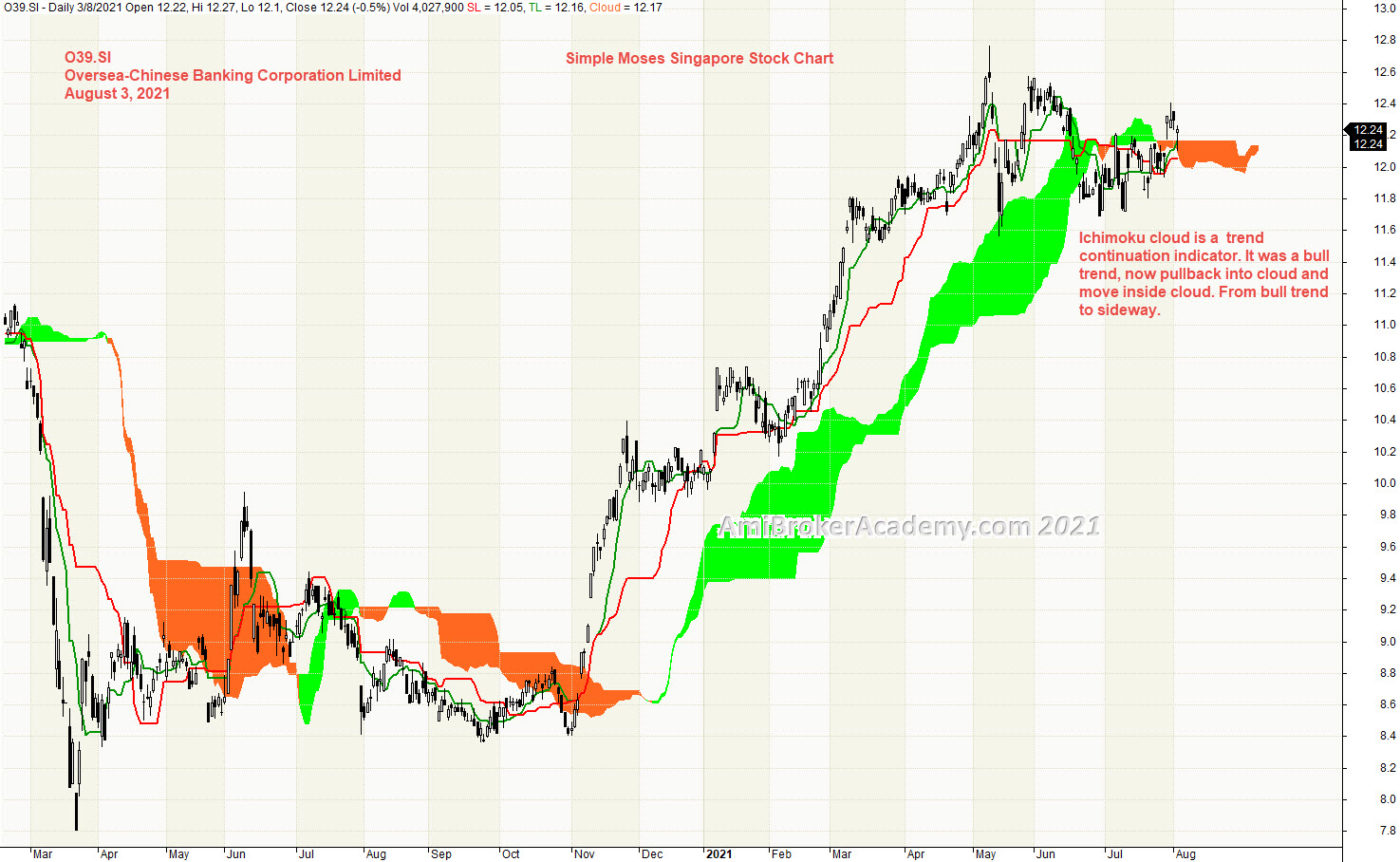
1) OCBC Oversea-Chinese Banking Corporation and Ichimoku Cloud
Ichimoku Cloud is a trend following strategy tool, can use in any market and any timeframe. Ichimoku indicator emphasize to trade in the trend direction. We see price action emerge from the cloud and stay above. Finally, price action pullback into cloud again. From bull trend to sideways. Price action has bounced above the cloud. Remember one thing, buy support sell resistance. Price Action now is at resistance, not sure. When we are not sure, stand aside and wait.
We see Tenkan Sen (green) after zigzag with Kijun Sen (red) and finally stay above and zigzag again. Trade what you see.
Remember, we just read what the chart said. Have fun!
20210803 OCBC Oversea-Chinese Banking Corporation and Ichimoku Cloud
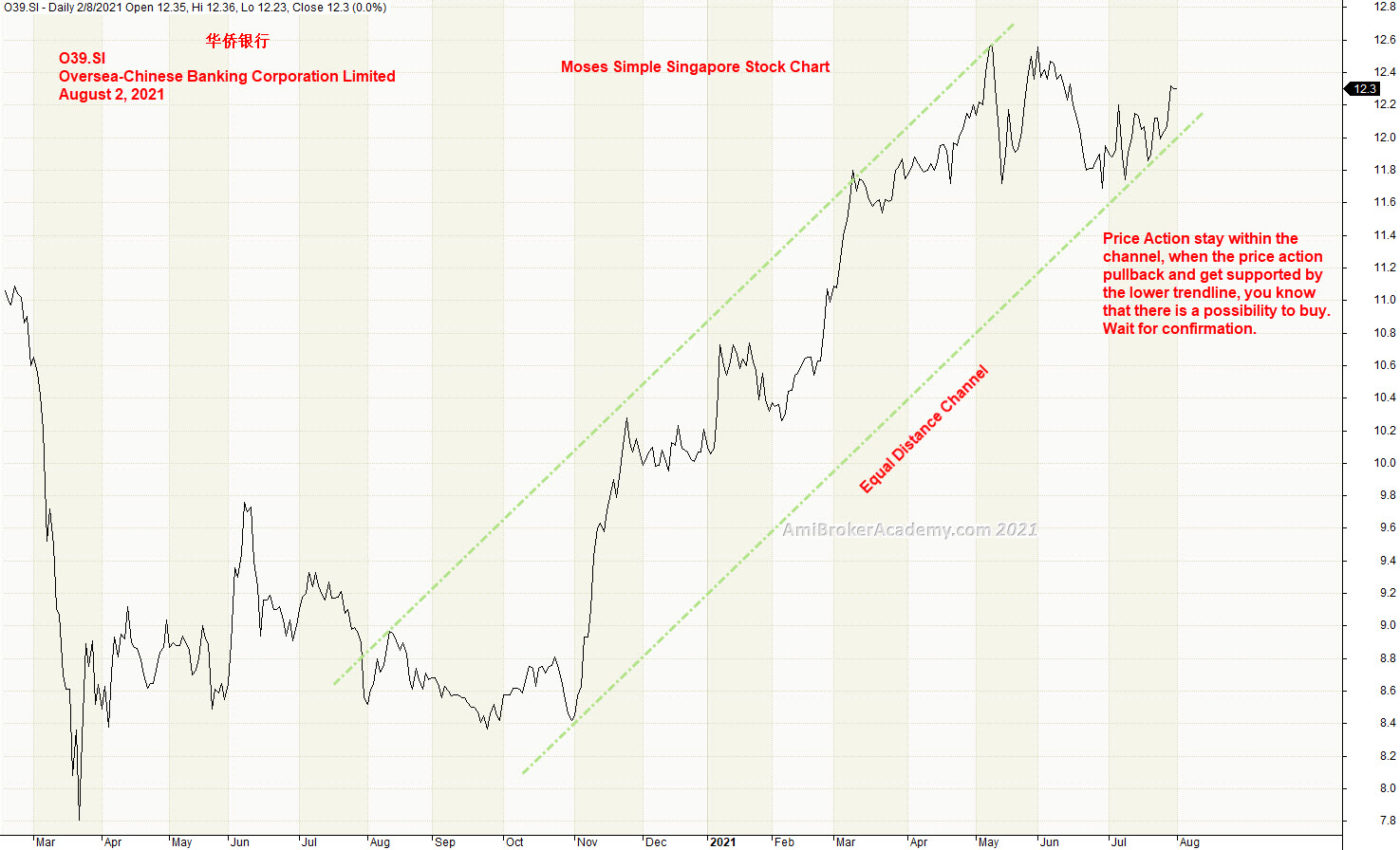
We use a line chart. Study OCBC stock price action, price action goes from low to high, from bottom left to top right. If we connect the low to add a trendline, copy and paste the trendline to the peak. You will realize the price action trapped within the two trendline, or we called it equal distance channel.
If you observant enough, you will see the price action get support or resistance from the equal distance channel. So, I way to trade buy support sell resistance is to wait for price action to draw near the bottom trendline to buy. And wait for price action to reject by the upper trendline. Of course, you have to wait for confirmation before take action.
3) OCBC Oversea-Chinese Banking Corporation and River
Price Action is pointing to Two o’clock direction, price action is very bull bias. See chart, we see the trend is slopping up and up.
Moving Average is a great visual tool. Raghee uses high, low and close of 34 EMA to form a band to determine the wave direction. Price action goes from below 34 EMA to above River. Occasionally, price action deep below the RIver, very quickly go above again. Price Action may go higher
River is a great support resistance tool too. Catch the support to find the entry. Remember to reduce risk by buy support and take profit to sell resistance.
Manage your risk.
20210803 OCBC Oversea-Chinese Banking Corporation and River
4) OCBC Oversea-Chinese Banking Corporation and GMMA and Woodies CCI
We ask you to stand aside when you are not sure. Study OCBC stock price action with GMMA and Woodies.
Bull trend, why? Price action and Fast MA (green) from bottom to above Slow MA (red) and stay above.
From Woodies CCI, price action continues to go higher. But, Woodies CCi is forming lower high. Divergence. Price Action might be topping. Trade with eyes open.
Mange your risk.
20210803 OCBC Oversea-Chinese Banking Corporation and GMMA and Woodies CCI
6) OCBC Oversea-Chinese Banking Corporation and MACD
We study price action we see MACD Divergence, price action continues to go higher, but MACD begin to form lower high and MACD Histogram to form lower high. So we expect a reversal is going to happen. But by now everyone has learnt that MACD Divergence is like a traffic light, you don’t stop at every traffic light. So, be the MACD Divergence. The price action may not pullback. But topping signal has now showed.
Trade what you see. We are looking for bear signal, and confirmation. MACD cross signal is a good indication to lookout for.
So, read the information you can get from the chart.
Remember, we just read what the chart said. Have fun!
But. don’t play play with MACD indicator. Very simple yet powerful.
20210803 OCBC Oversea-Chinese Banking Corporation and MACD
Moses Power Charting
Official AmiBrokerAcademy.com Charting
Disclaimer
The above result is for illustration purpose. It is not meant to be used for buy or sell decision. We do not recommend any particular stocks. If particular stocks of such are mentioned, they are meant as demonstration of Amibroker as a powerful charting software and MACD. Amibroker can program to scan the stocks for buy and sell signals.
These are script generated signals. Not all scan results are shown here. The MACD signal should use with price action. Users must understand what MACD and price action are all about before using them. If necessary you should attend a course to learn more on Technical Analysis (TA) and Moving Average Convergence Divergence, MACD.
Once again, the website does not guarantee any results or investment return based on the information and instruction you have read here. It should be used as learning aids only and if you decide to trade real money, all trading decision should be your own.
We learn from many past and present great traders. Kudo to these master.
Welcome to AmiBroker Academy. Thanks for visiting the site.
Besides we post simple chart using different indicator to read price action, we do MACD scan too. Instead of checking stock by stock, we use MACD to screen near eight hundred stock to spot stock that have MACD signals. Have fun!
Moving Average Convergence Divergence, MACD Screener
MACD was developed by Gerald Appel in the late seventies.
MACD stands for Moving Average Convergence
Divergence, the MACD line (red line or called fast line) and MACD signal line
(blue line, or called slow line).
MACD
Bullish Signal Line Cross: MACD bullish signal when red line crosses above
the blue line or MACD line crosses above zero line.
MACD
Bearish Signal Line Cross: MACD bearish signal when blue line crosses below
red line or MACD line crosses below zero line.
MACD Scan
These are stocks picked for today.
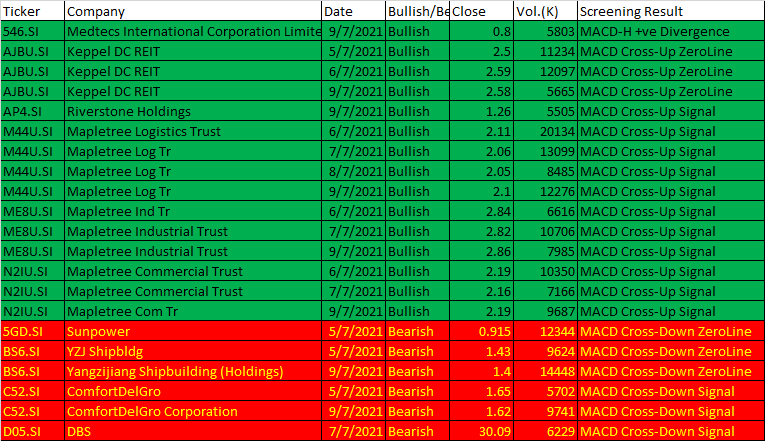
Some of 5 to 9 July, 2021 AmiBroker AFL Script Generated Five-day Singapore Stock MACD Signals
Ticker
Company
Date
Bullish/Bearish
Close
Vol.(K)
Screening Result
546.SI
Medtecs International Corporation Limited
9/7/2021
Bullish
0.8
5803
MACD-H +ve Divergence
AJBU.SI
Keppel DC REIT
5/7/2021
Bullish
2.5
11234
MACD Cross-Up ZeroLine
AJBU.SI
Keppel DC REIT
6/7/2021
Bullish
2.59
12097
MACD Cross-Up ZeroLine
AJBU.SI
Keppel DC REIT
9/7/2021
Bullish
2.58
5665
MACD Cross-Up ZeroLine
AP4.SI
Riverstone Holdings
9/7/2021
Bullish
1.26
5505
MACD Cross-Up Signal
M44U.SI
Mapletree Logistics Trust
6/7/2021
Bullish
2.11
20134
MACD Cross-Up Signal
M44U.SI
Mapletree Log Tr
7/7/2021
Bullish
2.06
13099
MACD Cross-Up Signal
M44U.SI
Mapletree Log Tr
8/7/2021
Bullish
2.05
8485
MACD Cross-Up Signal
M44U.SI
Mapletree Log Tr
9/7/2021
Bullish
2.1
12276
MACD Cross-Up Signal
ME8U.SI
Mapletree Ind Tr
6/7/2021
Bullish
2.84
6616
MACD Cross-Up Signal
ME8U.SI
Mapletree Industrial Trust
7/7/2021
Bullish
2.82
10706
MACD Cross-Up Signal
ME8U.SI
Mapletree Industrial Trust
9/7/2021
Bullish
2.86
7985
MACD Cross-Up Signal
N2IU.SI
Mapletree Commercial Trust
6/7/2021
Bullish
2.19
10350
MACD Cross-Up Signal
N2IU.SI
Mapletree Commercial Trust
7/7/2021
Bullish
2.16
7166
MACD Cross-Up Signal
N2IU.SI
Mapletree Com Tr
9/7/2021
Bullish
2.19
9687
MACD Cross-Up Signal
5GD.SI
Sunpower
5/7/2021
Bearish
0.915
12344
MACD Cross-Down ZeroLine
BS6.SI
YZJ Shipbldg
5/7/2021
Bearish
1.43
9624
MACD Cross-Down ZeroLine
BS6.SI
Yangzijiang Shipbuilding (Holdings)
9/7/2021
Bearish
1.4
14448
MACD Cross-Down ZeroLine
C52.SI
ComfortDelGro
5/7/2021
Bearish
1.65
5702
MACD Cross-Down Signal
C52.SI
ComfortDelGro Corporation
9/7/2021
Bearish
1.62
9741
MACD Cross-Down Signal
D05.SI
DBS
7/7/2021
Bearish
30.09
6229
MACD Cross-Down Signal
202107 5 to 9 Singapore Stock five-day MACD Signals
Moses Stock Scan
Power Free Singapore Stock MACD Scan Signals AmiBroker Academy.com
Disclaimer: The above result is for illustration purpose. It is not meant to be used for buy or sell decision. We do not recommend any particular stocks on our website. If particular stocks of such are mentioned, they are meant as illustration or demonstration of Amibroker as a powerful charting software or MACD scanner. Amibroker can program to scan the stocks that have MACD buy or sell signals.
These are script generated signals. Not all scan results are shown here. The MACD signal should use with price action and confirmation. Users must understand what MACD and price action are all about before using them. If necessary you should attend a course to learn more about Technical Analysis (TA) and Moving Average Convergence Divergence, MACD.
Once again, the website does not guarantee any results or investment return based on the information and instruction you have read here. It should be used as learning aids only and if you decide to trade real money, all trading decision should be your own, and you should take your own responsibility.
Welcome to AmiBroker Academy dot com, amibrokeracademy.com.
Secret Code
The analysis is not for everyone.
This is not a site for those whom just want to find buy or sell signal. Because we don’t provide you any buy or sell information, we only provide you the thought you can decide and take responsibility.
Trading is all about observation, reading the price bar and not news. By the time you hear the news it is already old and become history. Why? It is very simple, remember where the news come from? It has first someone release to the news agency like CNBC, and so on. Next, someone has to read the news to you after some research and summarize. This will be few hours later, by then the price action has already done.
As for price bar, it is what the market supply and remand. When market feel that is over price, the price will drop. All this reflected on the price bar almost instantly.
Next is how to read our price bar plus using some tools, such as MACD.
Here, we simply translate price action chart into layman language. This will help you in understand the financial instrument you are trading. We believe picture worth a thousand words. So, sometimes we use less words. You can learn the price action interpretation too. Give it a tray. You may not have the same view points as us. Remember all analysis read price action chart differently. It is just like reading an essay, we will have different conclusion.
Price Action goes from low to top. If we connect the low and add a trendline, copy and paste the trendline to the peak to add an equal distance channel. Price action trapped within a equal distance channel.
Equal Channel Distance provides support and resistance to price action. Buy support and sell resistance. Now price action is currently at support. Find the confirmation to buy support.
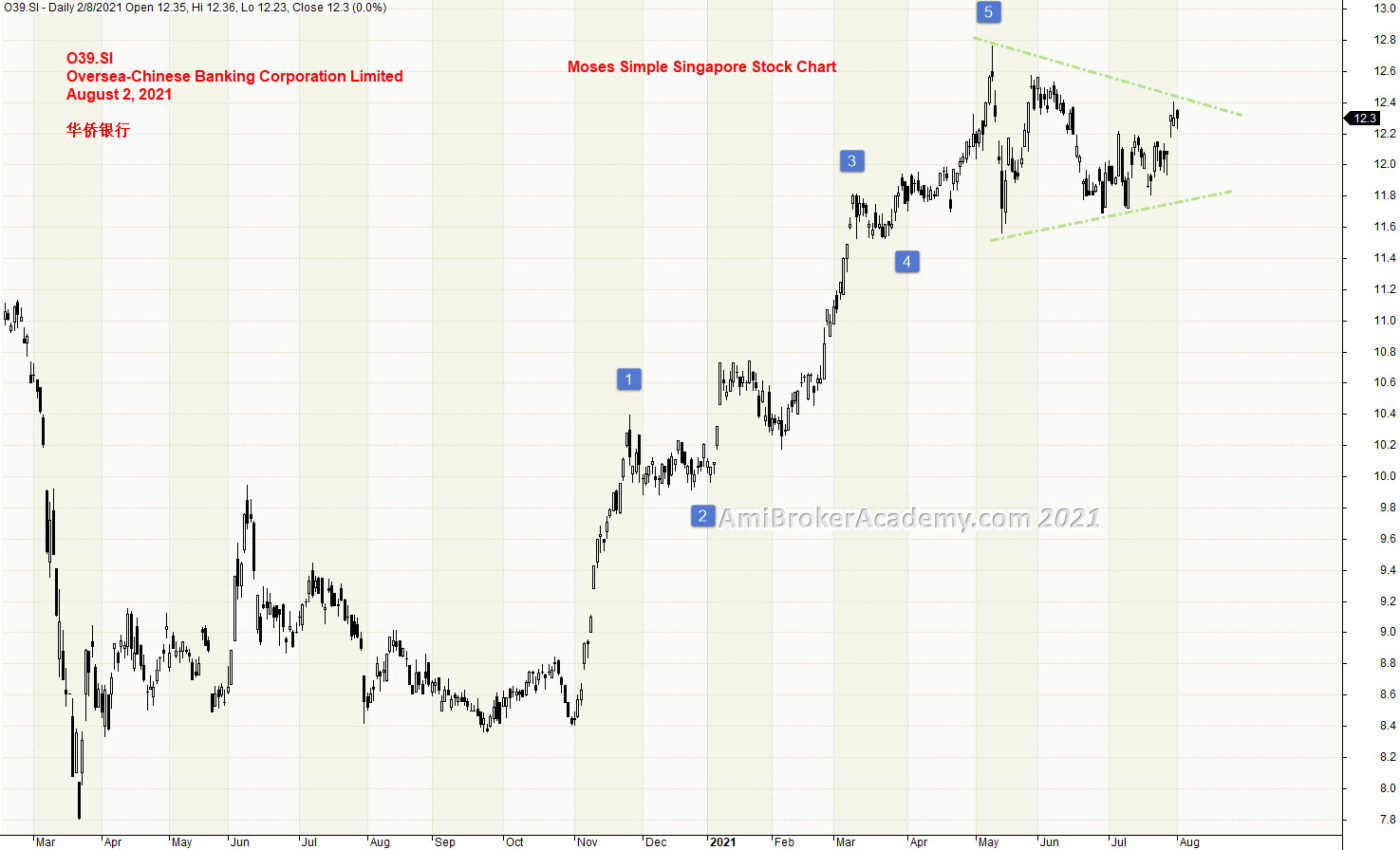
When you are a fan of Elliott Waves, everything must be Elliott Waves. See the chart for the Elliott Waves count. If you find the wave one, we expect a pullback. When you find the wave two, you are waiting for a long bull for wave three (when like OCBC is a bull trend). Next, after Wave three, expect a pullback for wave four. After wave four should be another bull, trend continuation to complete the five wave.
Be aware, the wave count is not universal. All the Elliott Wave analysts have different ways to view the wave count.
The above result is for illustration purpose. It is not meant to be used for buy or sell decision. We do not recommend any particular stocks. If particular stocks of such are mentioned, they are meant as demonstration of Amibroker as a powerful charting software and MACD. Amibroker can program to scan the stocks for buy and sell signals.
These are script generated signals. Not all scan results are shown here. The MACD signal should use with price action. Users must understand what MACD and price action are all about before using them. If necessary you should attend a course to learn more on Technical Analysis (TA) and Moving Average Convergence Divergence, MACD.
Once again, the website does not guarantee any results or investment return based on the information and instruction you have read here. It should be used as learning aids only and if you decide to trade real money, all trading decision should be your own.
We learn from many past and present great traders. Kudo to these master.
Welcome to AmiBroker Academy. Thanks for visiting the site.
Moving Average Convergence Divergence, MACD Screener
MACD was developed by Gerald Appel in the late seventies.
MACD stands for Moving Average Convergence
Divergence, the MACD line (red line or called fast line) and MACD signal line
(blue line, or called slow line).
MACD
Bullish Signal Line Cross: MACD bullish signal when red line crosses above
the blue line or MACD line crosses above zero line.
MACD
Bearish Signal Line Cross: MACD bearish signal when blue line crosses below
red line or MACD line crosses below zero line.
MACD Scan
These are stocks picked for today.
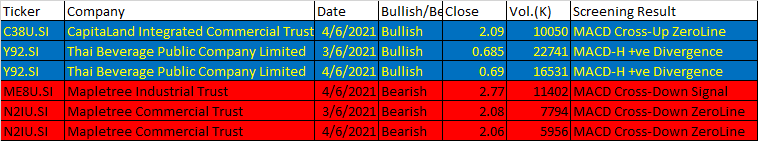
Some of 31 May to 4 June, 2021 AmiBroker AFL Script Generated Five-day Singapore Stock MACD Signals
Ticker
Company
Date
Bullish/Bearish
Close
Vol.(K)
Screening Result
C38U.SI
CapitaLand Integrated Commercial Trust
4/6/2021
Bullish
2.09
10050
MACD Cross-Up ZeroLine
Y92.SI
Thai Beverage Public Company Limited
3/6/2021
Bullish
0.685
22741
MACD-H +ve Divergence
Y92.SI
Thai Beverage Public Company Limited
4/6/2021
Bullish
0.69
16531
MACD-H +ve Divergence
ME8U.SI
Mapletree Industrial Trust
4/6/2021
Bearish
2.77
11402
MACD Cross-Down Signal
N2IU.SI
Mapletree Commercial Trust
3/6/2021
Bearish
2.08
7794
MACD Cross-Down ZeroLine
N2IU.SI
Mapletree Commercial Trust
4/6/2021
Bearish
2.06
5956
MACD Cross-Down ZeroLine
20210531 to 0604 Singapore Stock Five-day MACD Signals
Moses Stock Scan
Power Free Singapore Stock MACD Scan Signals AmiBroker Academy.com
Disclaimer: The above result is for illustration purpose. It is not meant to be used for buy or sell decision. We do not recommend any particular stocks on our website. If particular stocks of such are mentioned, they are meant as illustration or demonstration of Amibroker as a powerful charting software or MACD scanner. Amibroker can program to scan the stocks that have MACD buy or sell signals.
These are script generated signals. Not all scan results are shown here. The MACD signal should use with price action and confirmation. Users must understand what MACD and price action are all about before using them. If necessary you should attend a course to learn more about Technical Analysis (TA) and Moving Average Convergence Divergence, MACD.
Once again, the website does not guarantee any results or investment return based on the information and instruction you have read here. It should be used as learning aids only and if you decide to trade real money, all trading decision should be your own, and you should take your own responsibility.
Welcome to AmiBroker Academy. Thanks for visiting the site.
Moving Average Convergence Divergence, MACD Screener
MACD was developed by Gerald Appel in the late seventies.
MACD stands for Moving Average Convergence
Divergence, the MACD line (red line or called fast line) and MACD signal line
(blue line, or called slow line).
MACD
Bullish Signal Line Cross: MACD bullish signal when red line crosses above
the blue line or MACD line crosses above zero line.
MACD
Bearish Signal Line Cross: MACD bearish signal when blue line crosses below
red line or MACD line crosses below zero line.
MACD Scan
These are stocks picked for today.
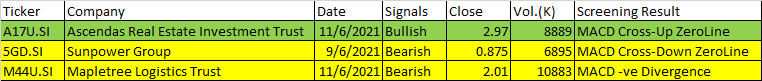
Some of 7 to 11 June, 2021 AmiBroker AFL Script Generated Five-day Singapore Stock MACD Signals
Ticker
Company
Date
Signals
Close
Vol.(K)
Screening Result
A17U.SI
Ascendas Real Estate Investment Trust
11/6/2021
Bullish
2.97
8889
MACD Cross-Up ZeroLine
5GD.SI
Sunpower Group
9/6/2021
Bearish
0.875
6895
MACD Cross-Down ZeroLine
M44U.SI
Mapletree Logistics Trust
11/6/2021
Bearish
2.01
10883
MACD -ve Divergence
202106 7 to 11 Singapore Stock Five-day MACD Signals
Moses Stock Scan
Power Free Singapore Stock MACD Scan Signals AmiBroker Academy.com
Disclaimer: The above result is for illustration purpose. It is not meant to be used for buy or sell decision. We do not recommend any particular stocks on our website. If particular stocks of such are mentioned, they are meant as illustration or demonstration of Amibroker as a powerful charting software or MACD scanner. Amibroker can program to scan the stocks that have MACD buy or sell signals.
These are script generated signals. Not all scan results are shown here. The MACD signal should use with price action and confirmation. Users must understand what MACD and price action are all about before using them. If necessary you should attend a course to learn more about Technical Analysis (TA) and Moving Average Convergence Divergence, MACD.
Once again, the website does not guarantee any results or investment return based on the information and instruction you have read here. It should be used as learning aids only and if you decide to trade real money, all trading decision should be your own, and you should take your own responsibility.