Welcome to AmiBroker Academy dot com, amibrokeracademy.com.
This is not a site for those whom just want to get buy or sell signals. We read the stock chart bar by bar to understand the market trend.
You take responsibility and decide buy or sell.
Trading is all probability. The price action is either up, down or sideways.
Trade what you see. Manage your risk.
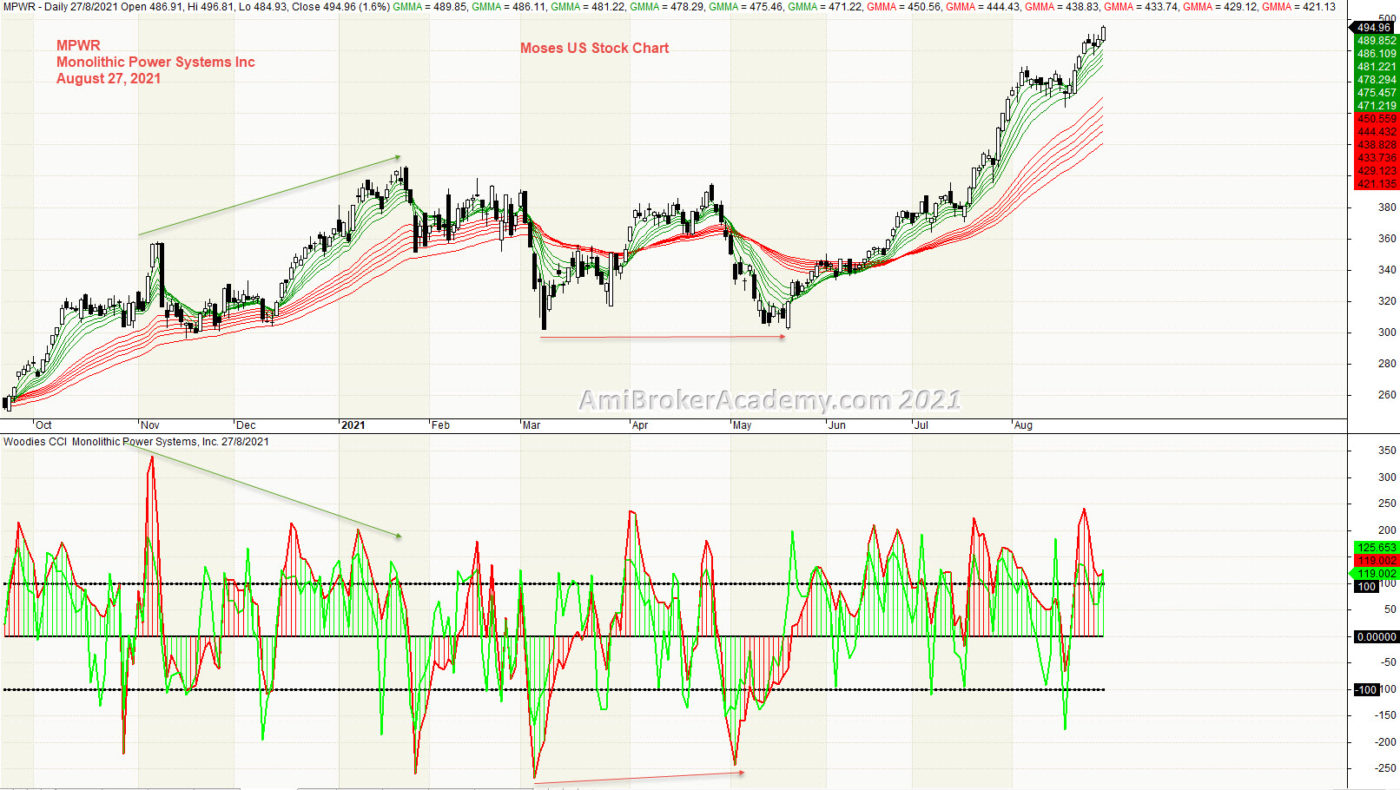
1) MPWR | Monolithic Power Systems Inc and GMMA and Woodies CCI
Picture worth a thousand words.
20210827 Monolithic Power Systems Inc and GMMA and Woodies CCI
Moses Power Charting
Official AmiBrokerAcademy.com Charting
Disclaimer
The above result is for illustration purpose. It is not meant to be used for buy or sell decision. We do not recommend any particular stocks. If particular stocks of such are mentioned, they are meant as demonstration of Amibroker as a powerful charting software and MACD. Amibroker can program to scan the stocks for buy and sell signals.
These are script generated signals. Not all scan results are shown here. The MACD signal should use with price action. Users must understand what MACD and price action are all about before using them. If necessary you should attend a course to learn more on Technical Analysis (TA) and Moving Average Convergence Divergence, MACD.
Once again, the website does not guarantee any results or investment return based on the information and instruction you have read here. It should be used as learning aids only and if you decide to trade real money, all trading decision should be your own.
We learn from many past and present great traders. Kudo to these master.
Welcome to AmiBroker Academy dot com, amibrokeracademy.com.
This is not a site for those whom just want to get buy or sell signals. We read the stock chart bar by bar to understand the market trend.
You take responsibility and decide buy or sell.
Trading is all probability. The price action is either up, down or sideways.
Trade what you see. Manage your risk.
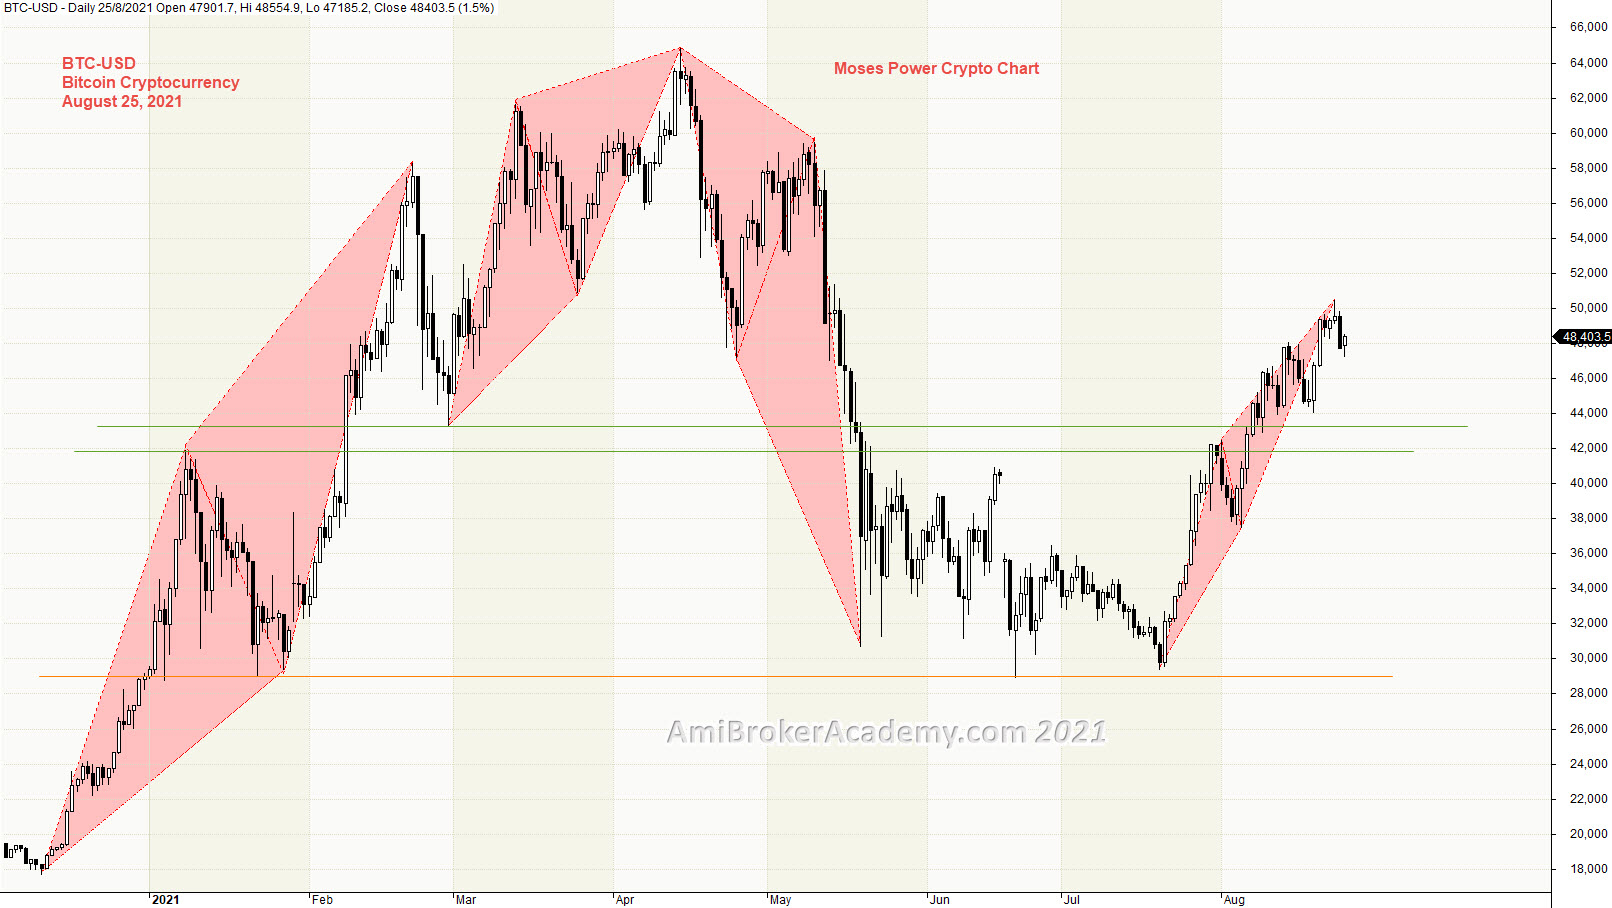
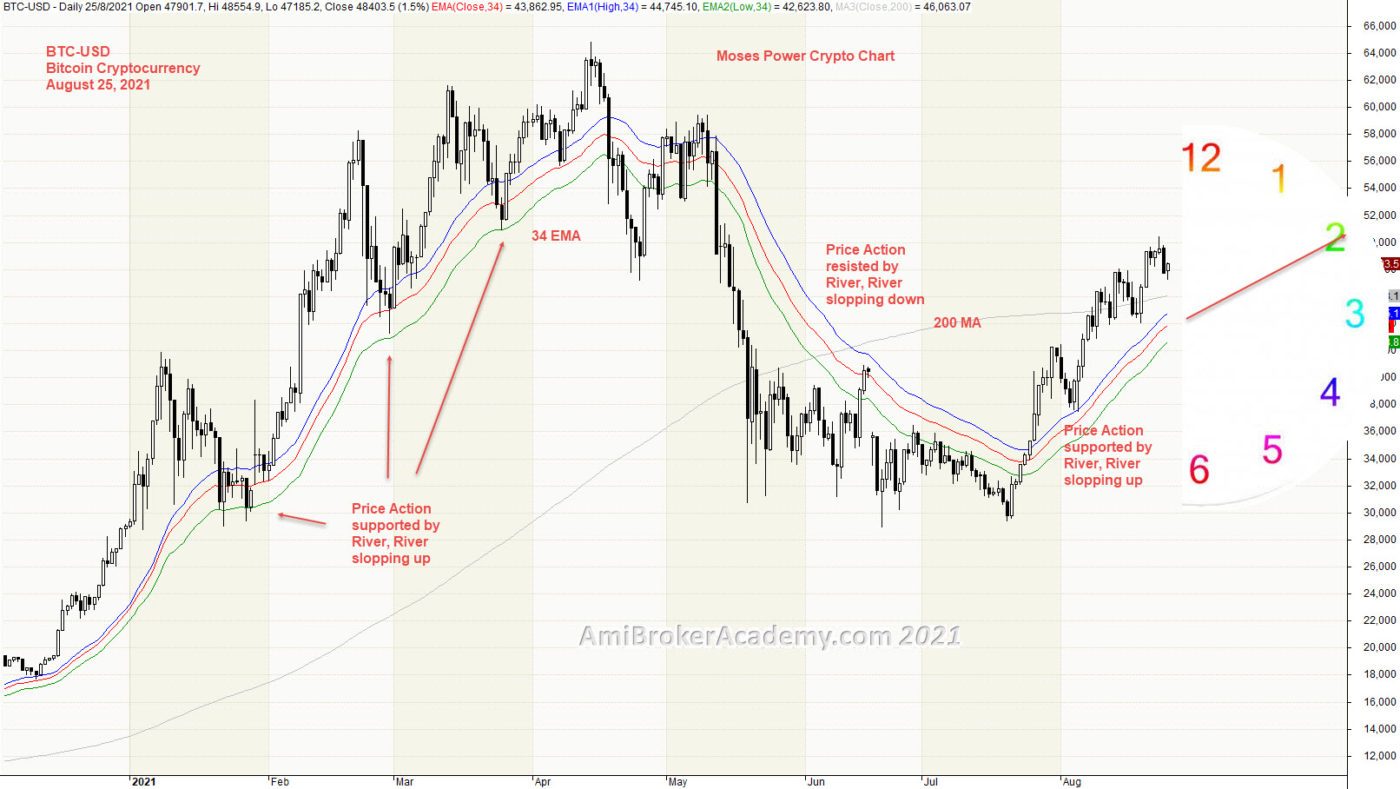
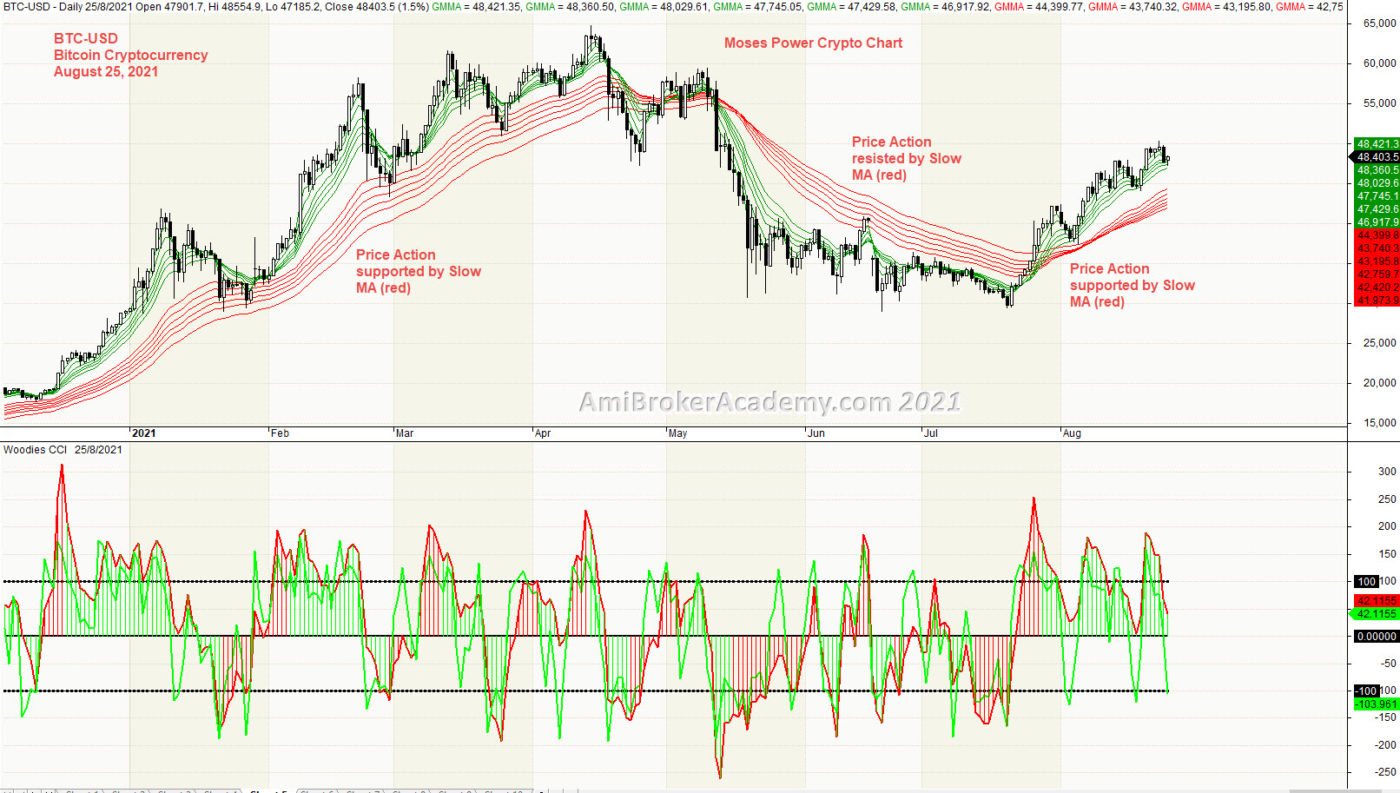
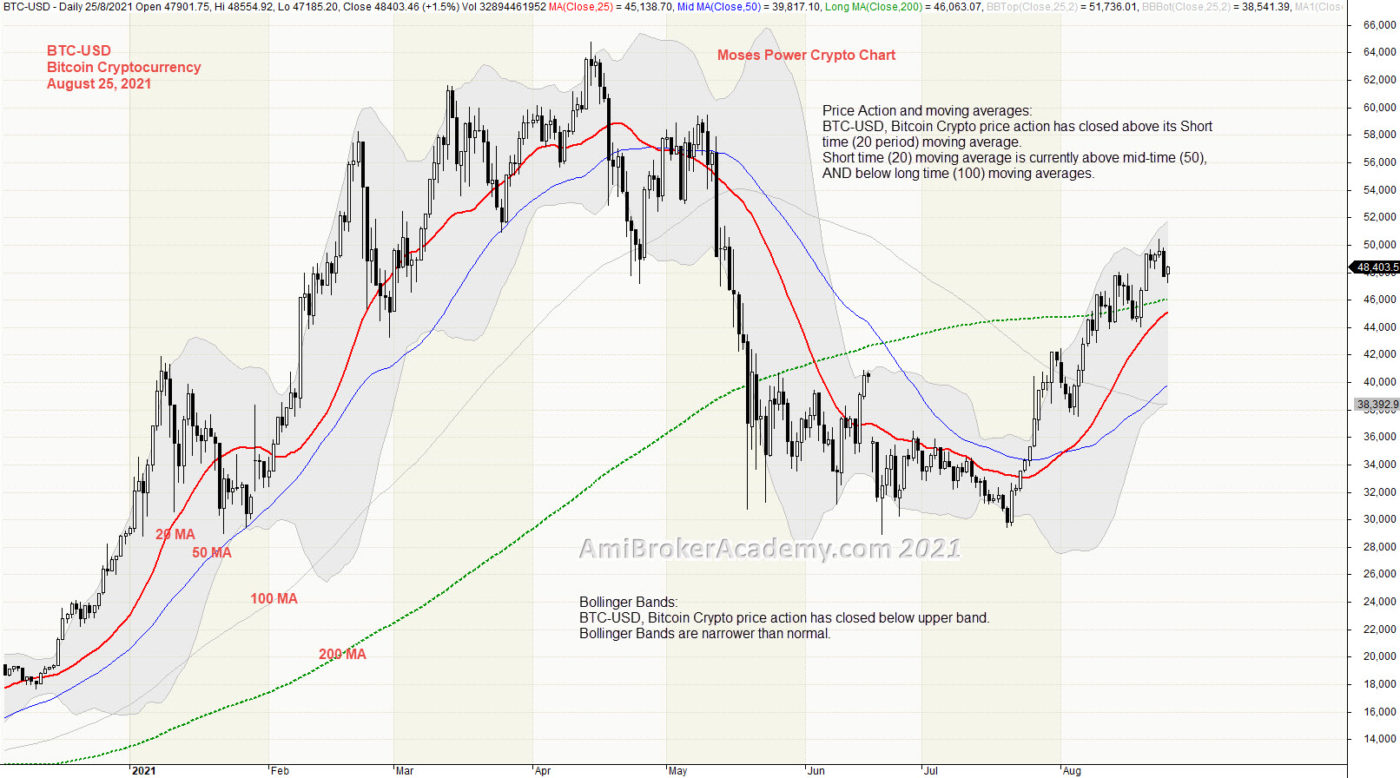
1) Bitcoin Cryptocurency Price Action
Picture worth a thousand words.
August 25, 2021 Bitcoin Cryptocurency price action and geometry pattern
Moses Power Charting
Official AmiBrokerAcademy.com Charting
Disclaimer
The above result is for illustration purpose. It is not meant to be used for buy or sell decision. We do not recommend any particular stocks. If particular stocks of such are mentioned, they are meant as demonstration of Amibroker as a powerful charting software and MACD. Amibroker can program to scan the stocks for buy and sell signals.
These are script generated signals. Not all scan results are shown here. The MACD signal should use with price action. Users must understand what MACD and price action are all about before using them. If necessary you should attend a course to learn more on Technical Analysis (TA) and Moving Average Convergence Divergence, MACD.
Once again, the website does not guarantee any results or investment return based on the information and instruction you have read here. It should be used as learning aids only and if you decide to trade real money, all trading decision should be your own.
We learn from many past and present great traders. Kudo to these master.
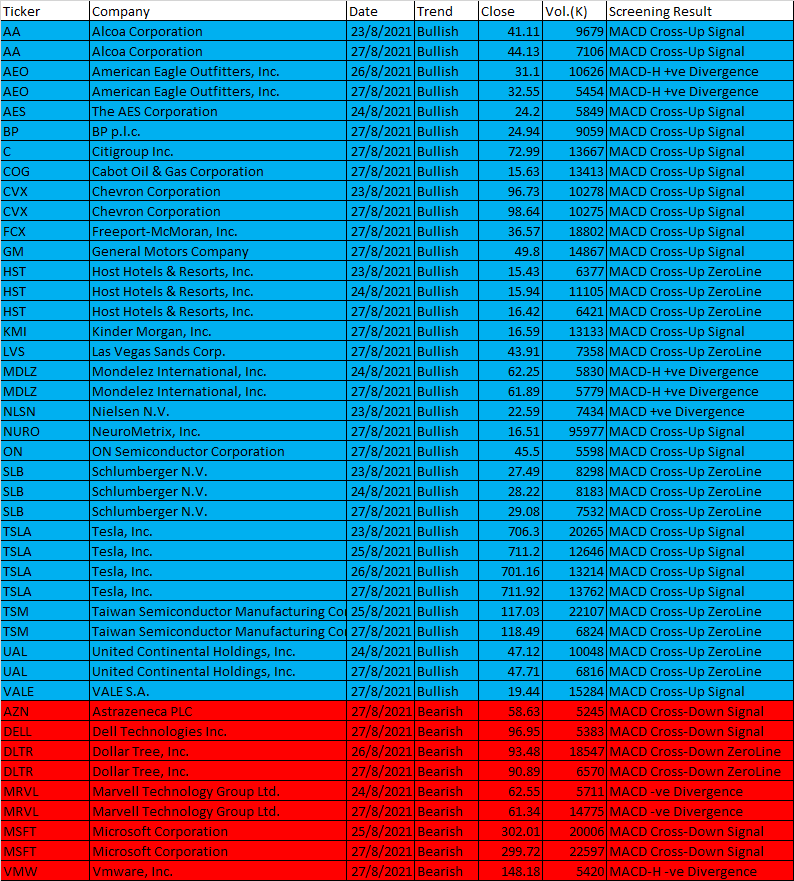
To identify any stock will move in near eight thousand stocks will take a lot of time. But, when you use script like AmiBroker AFL Script, it will only take less than fifteen minutes.
Welcome!
Welcome to AmiBroker Academy. Thanks for visiting the site.
Moving Average Convergence Divergence, MACD Screener
MACD was developed by Gerald Appel in the late seventies.
MACD stands for Moving Average Convergence Divergence, the MACD line (red line or called fast line) and MACD signal line (blue line, or called slow line).
MACD Bullish Signal Line Cross: MACD bullish signal when red line crosses above the blue line or MACD line crosses above zero line.
MACD Bearish Signal Line Cross: MACD bearish signal when blue line crosses below red line or MACD line crosses below zero line.
MACD Scan
These are stocks picked for today.
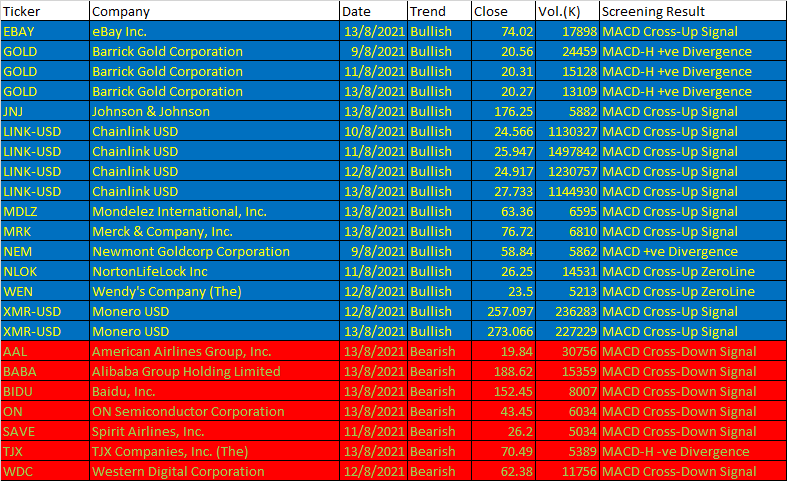
Some of August 23 to 27, 2021 AmiBroker AFL Script Generated Five-day US Stock MACD Signals
Ticker
Company
Date
Trend
Close
Vol.(K)
Screening Result
AA
Alcoa Corporation
23/8/2021
Bullish
41.11
9679
MACD Cross-Up Signal
AA
Alcoa Corporation
27/8/2021
Bullish
44.13
7106
MACD Cross-Up Signal
AEO
American Eagle Outfitters, Inc.
26/8/2021
Bullish
31.1
10626
MACD-H +ve Divergence
AEO
American Eagle Outfitters, Inc.
27/8/2021
Bullish
32.55
5454
MACD-H +ve Divergence
AES
The AES Corporation
24/8/2021
Bullish
24.2
5849
MACD Cross-Up Signal
BP
BP p.l.c.
27/8/2021
Bullish
24.94
9059
MACD Cross-Up Signal
C
Citigroup Inc.
27/8/2021
Bullish
72.99
13667
MACD Cross-Up Signal
COG
Cabot Oil & Gas Corporation
27/8/2021
Bullish
15.63
13413
MACD Cross-Up Signal
CVX
Chevron Corporation
23/8/2021
Bullish
96.73
10278
MACD Cross-Up Signal
CVX
Chevron Corporation
27/8/2021
Bullish
98.64
10275
MACD Cross-Up Signal
FCX
Freeport-McMoran, Inc.
27/8/2021
Bullish
36.57
18802
MACD Cross-Up Signal
GM
General Motors Company
27/8/2021
Bullish
49.8
14867
MACD Cross-Up Signal
HST
Host Hotels & Resorts, Inc.
23/8/2021
Bullish
15.43
6377
MACD Cross-Up ZeroLine
HST
Host Hotels & Resorts, Inc.
24/8/2021
Bullish
15.94
11105
MACD Cross-Up ZeroLine
HST
Host Hotels & Resorts, Inc.
27/8/2021
Bullish
16.42
6421
MACD Cross-Up ZeroLine
KMI
Kinder Morgan, Inc.
27/8/2021
Bullish
16.59
13133
MACD Cross-Up Signal
LVS
Las Vegas Sands Corp.
27/8/2021
Bullish
43.91
7358
MACD Cross-Up ZeroLine
MDLZ
Mondelez International, Inc.
24/8/2021
Bullish
62.25
5830
MACD-H +ve Divergence
MDLZ
Mondelez International, Inc.
27/8/2021
Bullish
61.89
5779
MACD-H +ve Divergence
NLSN
Nielsen N.V.
23/8/2021
Bullish
22.59
7434
MACD +ve Divergence
NURO
NeuroMetrix, Inc.
27/8/2021
Bullish
16.51
95977
MACD Cross-Up Signal
ON
ON Semiconductor Corporation
27/8/2021
Bullish
45.5
5598
MACD Cross-Up Signal
SLB
Schlumberger N.V.
23/8/2021
Bullish
27.49
8298
MACD Cross-Up ZeroLine
SLB
Schlumberger N.V.
24/8/2021
Bullish
28.22
8183
MACD Cross-Up ZeroLine
SLB
Schlumberger N.V.
27/8/2021
Bullish
29.08
7532
MACD Cross-Up ZeroLine
TSLA
Tesla, Inc.
23/8/2021
Bullish
706.3
20265
MACD Cross-Up Signal
TSLA
Tesla, Inc.
25/8/2021
Bullish
711.2
12646
MACD Cross-Up Signal
TSLA
Tesla, Inc.
26/8/2021
Bullish
701.16
13214
MACD Cross-Up Signal
TSLA
Tesla, Inc.
27/8/2021
Bullish
711.92
13762
MACD Cross-Up Signal
TSM
Taiwan Semiconductor Manufacturing Company Ltd.
25/8/2021
Bullish
117.03
22107
MACD Cross-Up ZeroLine
TSM
Taiwan Semiconductor Manufacturing Company Ltd.
27/8/2021
Bullish
118.49
6824
MACD Cross-Up ZeroLine
UAL
United Continental Holdings, Inc.
24/8/2021
Bullish
47.12
10048
MACD Cross-Up ZeroLine
UAL
United Continental Holdings, Inc.
27/8/2021
Bullish
47.71
6816
MACD Cross-Up ZeroLine
VALE
VALE S.A.
27/8/2021
Bullish
19.44
15284
MACD Cross-Up Signal
AZN
Astrazeneca PLC
27/8/2021
Bearish
58.63
5245
MACD Cross-Down Signal
DELL
Dell Technologies Inc.
27/8/2021
Bearish
96.95
5383
MACD Cross-Down Signal
DLTR
Dollar Tree, Inc.
26/8/2021
Bearish
93.48
18547
MACD Cross-Down ZeroLine
DLTR
Dollar Tree, Inc.
27/8/2021
Bearish
90.89
6570
MACD Cross-Down ZeroLine
MRVL
Marvell Technology Group Ltd.
24/8/2021
Bearish
62.55
5711
MACD -ve Divergence
MRVL
Marvell Technology Group Ltd.
27/8/2021
Bearish
61.34
14775
MACD -ve Divergence
MSFT
Microsoft Corporation
25/8/2021
Bearish
302.01
20006
MACD Cross-Down Signal
MSFT
Microsoft Corporation
27/8/2021
Bearish
299.72
22597
MACD Cross-Down Signal
VMW
Vmware, Inc.
27/8/2021
Bearish
148.18
5420
MACD-H -ve Divergence
202108 23 to 27 US Stock Five-day MACD Signals
Moses Stock Scan
Free Power US Stock MACD Scan Signals AmiBroker Academy.com
Disclaimer: The above result is for illustration purpose. It is not meant to be used for buy or sell decision. We do not recommend any particular stocks on our website. If particular stocks of such are mentioned, they are meant as illustration or demonstration of Amibroker as a powerful charting software or MACD scanner. Amibroker can program to scan the stocks that have MACD buy or sell signals.
These are script generated signals. Not all scan results are shown here. The MACD signal should use with price action and confirmation. Users must understand what MACD and price action are all about before using them. If necessary you should attend a course to learn more about Technical Analysis (TA) and Moving Average Convergence Divergence, MACD.
Once again, the website does not guarantee any results or investment return based on the information and instruction you have read here. It should be used as learning aids only and if you decide to trade real money, all trading decision should be your own, and you should take your own responsibility.
To identify any stock will move in near eight thousand stocks will take a lot of time. But, when you use script like AmiBroker AFL Script, it will only take less than fifteen minutes.
Welcome!
Welcome to AmiBroker Academy. Thanks for visiting the site.
Moving Average Convergence Divergence, MACD Screener
MACD was developed by Gerald Appel in the late seventies.
MACD stands for Moving Average Convergence Divergence, the MACD line (red line or called fast line) and MACD signal line (blue line, or called slow line).
MACD Bullish Signal Line Cross: MACD bullish signal when red line crosses above the blue line or MACD line crosses above zero line.
MACD Bearish Signal Line Cross: MACD bearish signal when blue line crosses below red line or MACD line crosses below zero line.
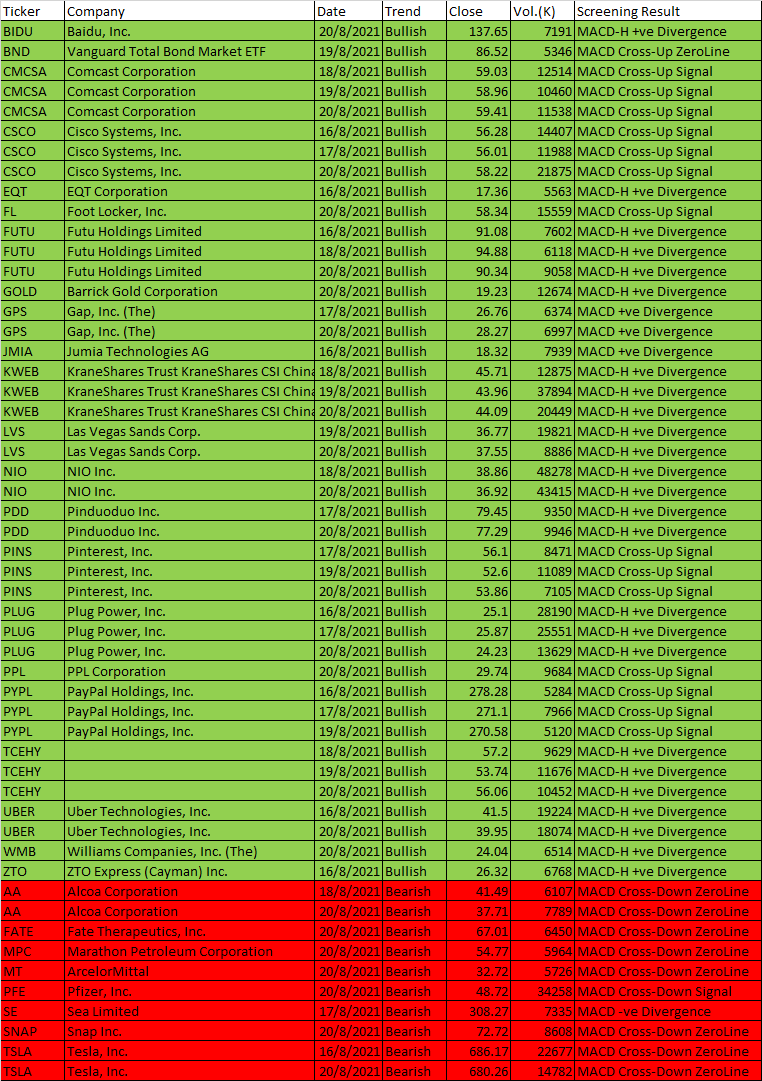
MACD Scan
These are stocks picked for today.
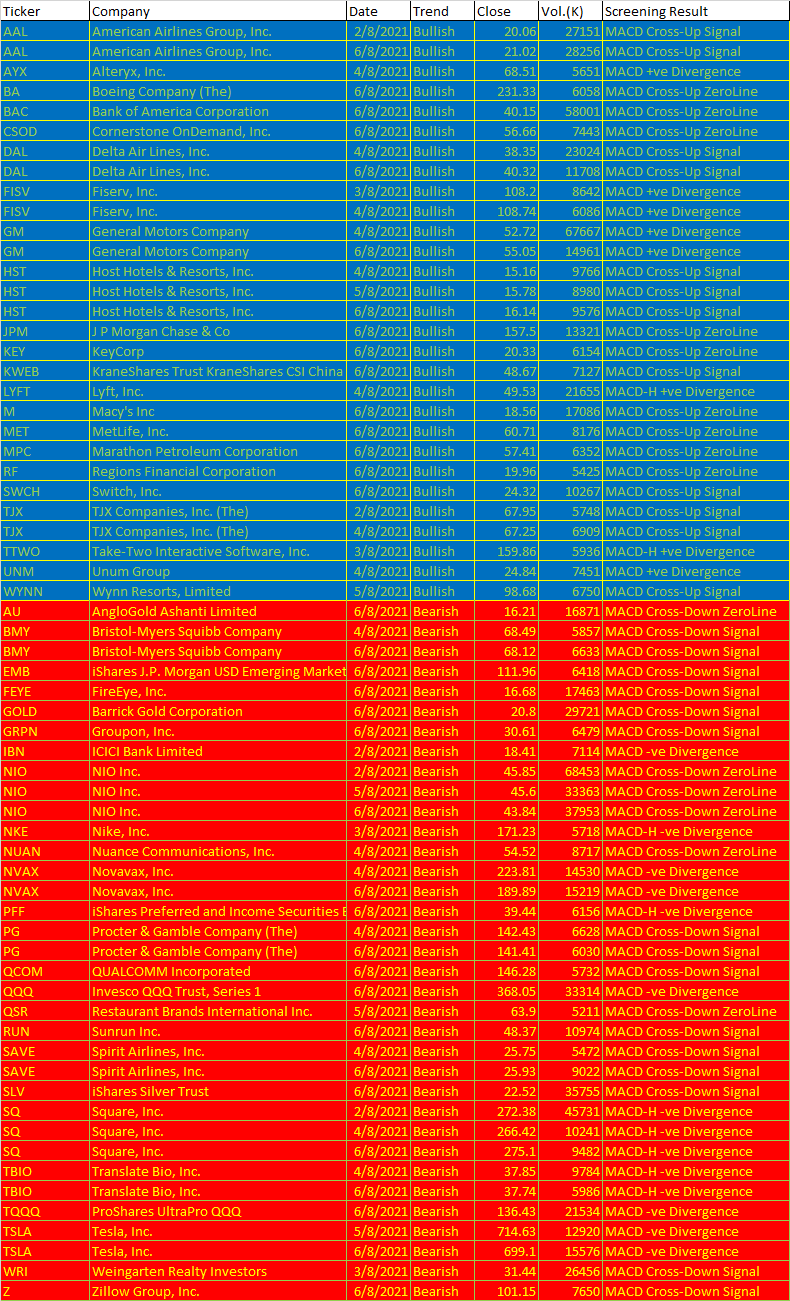
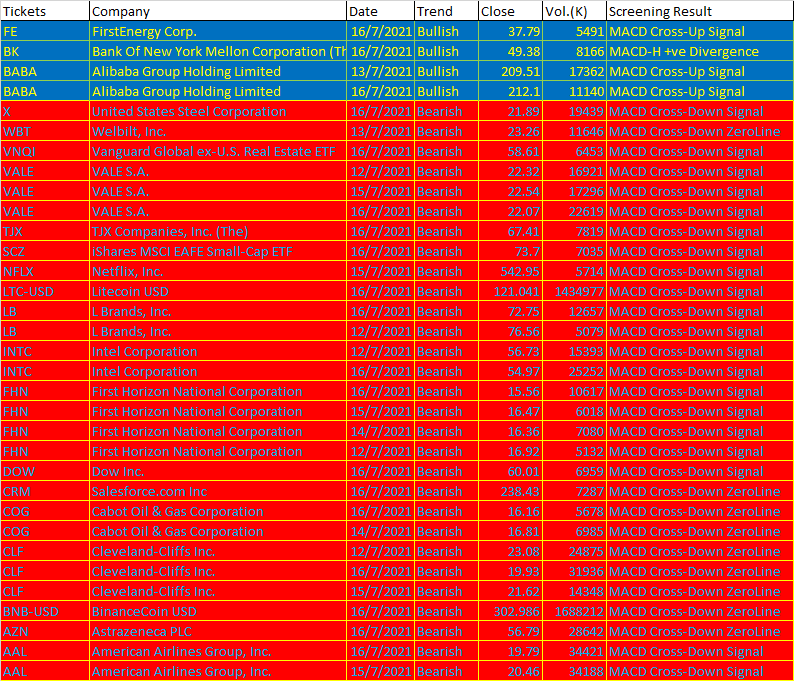
Some of August 16 to 20, 2021 AmiBroker AFL Script Generated Five-day US Stock MACD Signals
Ticker
Company
Date
Trend
Close
Vol.(K)
Screening Result
BIDU
Baidu, Inc.
20/8/2021
Bullish
137.65
7191
MACD-H +ve Divergence
BND
Vanguard Total Bond Market ETF
19/8/2021
Bullish
86.52
5346
MACD Cross-Up ZeroLine
CMCSA
Comcast Corporation
18/8/2021
Bullish
59.03
12514
MACD Cross-Up Signal
CMCSA
Comcast Corporation
19/8/2021
Bullish
58.96
10460
MACD Cross-Up Signal
CMCSA
Comcast Corporation
20/8/2021
Bullish
59.41
11538
MACD Cross-Up Signal
CSCO
Cisco Systems, Inc.
16/8/2021
Bullish
56.28
14407
MACD Cross-Up Signal
CSCO
Cisco Systems, Inc.
17/8/2021
Bullish
56.01
11988
MACD Cross-Up Signal
CSCO
Cisco Systems, Inc.
20/8/2021
Bullish
58.22
21875
MACD Cross-Up Signal
EQT
EQT Corporation
16/8/2021
Bullish
17.36
5563
MACD-H +ve Divergence
FL
Foot Locker, Inc.
20/8/2021
Bullish
58.34
15559
MACD Cross-Up Signal
FUTU
Futu Holdings Limited
16/8/2021
Bullish
91.08
7602
MACD-H +ve Divergence
FUTU
Futu Holdings Limited
18/8/2021
Bullish
94.88
6118
MACD-H +ve Divergence
FUTU
Futu Holdings Limited
20/8/2021
Bullish
90.34
9058
MACD-H +ve Divergence
GOLD
Barrick Gold Corporation
20/8/2021
Bullish
19.23
12674
MACD-H +ve Divergence
GPS
Gap, Inc. (The)
17/8/2021
Bullish
26.76
6374
MACD +ve Divergence
GPS
Gap, Inc. (The)
20/8/2021
Bullish
28.27
6997
MACD +ve Divergence
JMIA
Jumia Technologies AG
16/8/2021
Bullish
18.32
7939
MACD +ve Divergence
KWEB
KraneShares Trust KraneShares CSI China Internet ETF
18/8/2021
Bullish
45.71
12875
MACD-H +ve Divergence
KWEB
KraneShares Trust KraneShares CSI China Internet ETF
19/8/2021
Bullish
43.96
37894
MACD-H +ve Divergence
KWEB
KraneShares Trust KraneShares CSI China Internet ETF
20/8/2021
Bullish
44.09
20449
MACD-H +ve Divergence
LVS
Las Vegas Sands Corp.
19/8/2021
Bullish
36.77
19821
MACD-H +ve Divergence
LVS
Las Vegas Sands Corp.
20/8/2021
Bullish
37.55
8886
MACD-H +ve Divergence
NIO
NIO Inc.
18/8/2021
Bullish
38.86
48278
MACD-H +ve Divergence
NIO
NIO Inc.
20/8/2021
Bullish
36.92
43415
MACD-H +ve Divergence
PDD
Pinduoduo Inc.
17/8/2021
Bullish
79.45
9350
MACD-H +ve Divergence
PDD
Pinduoduo Inc.
20/8/2021
Bullish
77.29
9946
MACD-H +ve Divergence
PINS
Pinterest, Inc.
17/8/2021
Bullish
56.1
8471
MACD Cross-Up Signal
PINS
Pinterest, Inc.
19/8/2021
Bullish
52.6
11089
MACD Cross-Up Signal
PINS
Pinterest, Inc.
20/8/2021
Bullish
53.86
7105
MACD Cross-Up Signal
PLUG
Plug Power, Inc.
16/8/2021
Bullish
25.1
28190
MACD-H +ve Divergence
PLUG
Plug Power, Inc.
17/8/2021
Bullish
25.87
25551
MACD-H +ve Divergence
PLUG
Plug Power, Inc.
20/8/2021
Bullish
24.23
13629
MACD-H +ve Divergence
PPL
PPL Corporation
20/8/2021
Bullish
29.74
9684
MACD Cross-Up Signal
PYPL
PayPal Holdings, Inc.
16/8/2021
Bullish
278.28
5284
MACD Cross-Up Signal
PYPL
PayPal Holdings, Inc.
17/8/2021
Bullish
271.1
7966
MACD Cross-Up Signal
PYPL
PayPal Holdings, Inc.
19/8/2021
Bullish
270.58
5120
MACD Cross-Up Signal
TCEHY
18/8/2021
Bullish
57.2
9629
MACD-H +ve Divergence
TCEHY
19/8/2021
Bullish
53.74
11676
MACD-H +ve Divergence
TCEHY
20/8/2021
Bullish
56.06
10452
MACD-H +ve Divergence
UBER
Uber Technologies, Inc.
16/8/2021
Bullish
41.5
19224
MACD-H +ve Divergence
UBER
Uber Technologies, Inc.
20/8/2021
Bullish
39.95
18074
MACD-H +ve Divergence
WMB
Williams Companies, Inc. (The)
20/8/2021
Bullish
24.04
6514
MACD-H +ve Divergence
ZTO
ZTO Express (Cayman) Inc.
16/8/2021
Bullish
26.32
6768
MACD-H +ve Divergence
AA
Alcoa Corporation
18/8/2021
Bearish
41.49
6107
MACD Cross-Down ZeroLine
AA
Alcoa Corporation
20/8/2021
Bearish
37.71
7789
MACD Cross-Down ZeroLine
FATE
Fate Therapeutics, Inc.
20/8/2021
Bearish
67.01
6450
MACD Cross-Down ZeroLine
MPC
Marathon Petroleum Corporation
20/8/2021
Bearish
54.77
5964
MACD Cross-Down ZeroLine
MT
ArcelorMittal
20/8/2021
Bearish
32.72
5726
MACD Cross-Down ZeroLine
PFE
Pfizer, Inc.
20/8/2021
Bearish
48.72
34258
MACD Cross-Down Signal
SE
Sea Limited
17/8/2021
Bearish
308.27
7335
MACD -ve Divergence
SNAP
Snap Inc.
20/8/2021
Bearish
72.72
8608
MACD Cross-Down ZeroLine
TSLA
Tesla, Inc.
16/8/2021
Bearish
686.17
22677
MACD Cross-Down ZeroLine
TSLA
Tesla, Inc.
20/8/2021
Bearish
680.26
14782
MACD Cross-Down ZeroLine
202108 16 to 20 US Stock Five-day MACD Signals
Moses Stock Scan
Free Power US Stock MACD Scan Signals AmiBroker Academy.com
Disclaimer: The above result is for illustration purpose. It is not meant to be used for buy or sell decision. We do not recommend any particular stocks on our website. If particular stocks of such are mentioned, they are meant as illustration or demonstration of Amibroker as a powerful charting software or MACD scanner. Amibroker can program to scan the stocks that have MACD buy or sell signals.
These are script generated signals. Not all scan results are shown here. The MACD signal should use with price action and confirmation. Users must understand what MACD and price action are all about before using them. If necessary you should attend a course to learn more about Technical Analysis (TA) and Moving Average Convergence Divergence, MACD.
Once again, the website does not guarantee any results or investment return based on the information and instruction you have read here. It should be used as learning aids only and if you decide to trade real money, all trading decision should be your own, and you should take your own responsibility.
Welcome to AmiBroker Academy dot com, amibrokeracademy.com.
This not a site for those whom just want to know, buy or sell signals. We don’t provide, we provide you the thought. You can decide when to buy and sell and take responsibility.
Trading is all about observation, trade what you see reading the price bar by bar and not checking the news.
By the time you hear the news it is already old and become history. Why? It is very simple, remember where the news come from? It has first someone read the chart and project the change in price action direction. They release their thought to the news agency like CNBC, and so on. Next, someone has to read the news to you after some research and summarize. This will be few hours later, by then the price action has already move.
As for price bar, it is what the market supply and remand. When market feel that is over price, the price will drop. All this reflected on the price bar almost instantly.
Next is how to read our price bar plus using some tools, such as MACD.
Here, we simply translate price action chart into layman language. This will help you in understand the financial instrument you are trading. We believe picture worth a thousand words. So, sometimes we use less words. You can learn the price action interpretation too. Give it a tray. You may not have the same view points as us. Remember all analysis read price action chart differently. It is just like reading an essay, we will have different conclusion.
Trade well.
Trade what you see. Manage your risk.
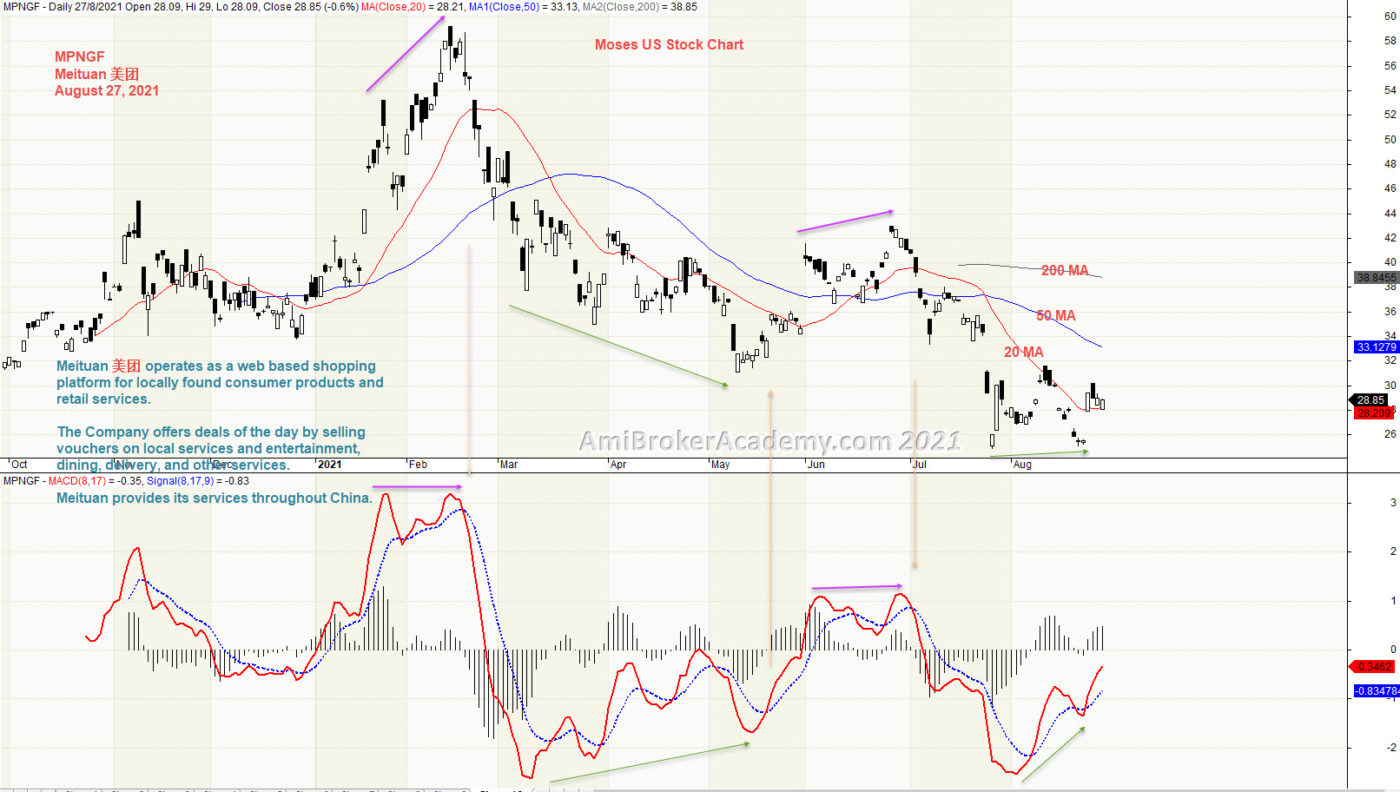
1) Meituan 美团 and MACD Divergence
MACD Divergence.
20210827 Meituan 美团 and MACD Divergence
Moses Power Charting
Official AmiBrokerAcademy.com Charting
Disclaimer
The above result is for illustration purpose. It is not meant to be used for buy or sell decision. We do not recommend any particular stocks. If particular stocks of such are mentioned, they are meant as demonstration of Amibroker as a powerful charting software and MACD. Amibroker can program to scan the stocks for buy and sell signals.
These are script generated signals. Not all scan results are shown here. The MACD signal should use with price action. Users must understand what MACD and price action are all about before using them. If necessary you should attend a course to learn more on Technical Analysis (TA) and Moving Average Convergence Divergence, MACD.
Once again, the website does not guarantee any results or investment return based on the information and instruction you have read here. It should be used as learning aids only and if you decide to trade real money, all trading decision should be your own.
We learn from many past and present great traders. Kudo to these master.
Welcome to AmiBroker Academy dot com, amibrokeracademy.com.
This not a site for those whom just want to know, buy or sell signals. We don’t provide, we provide you the thought. You can decide when to buy and sell and take responsibility.
Trading is all about observation, trade what you see reading the price bar by bar and not checking the news.
By the time you hear the news it is already old and become history. Why? It is very simple, remember where the news come from? It has first someone read the chart and project the change in price action direction. They release their thought to the news agency like CNBC, and so on. Next, someone has to read the news to you after some research and summarize. This will be few hours later, by then the price action has already move.
As for price bar, it is what the market supply and remand. When market feel that is over price, the price will drop. All this reflected on the price bar almost instantly.
Next is how to read our price bar plus using some tools, such as MACD.
Here, we simply translate price action chart into layman language. This will help you in understand the financial instrument you are trading. We believe picture worth a thousand words. So, sometimes we use less words. You can learn the price action interpretation too. Give it a tray. You may not have the same view points as us. Remember all analysis read price action chart differently. It is just like reading an essay, we will have different conclusion.
Trade well.
Trade what you see. Manage your risk.
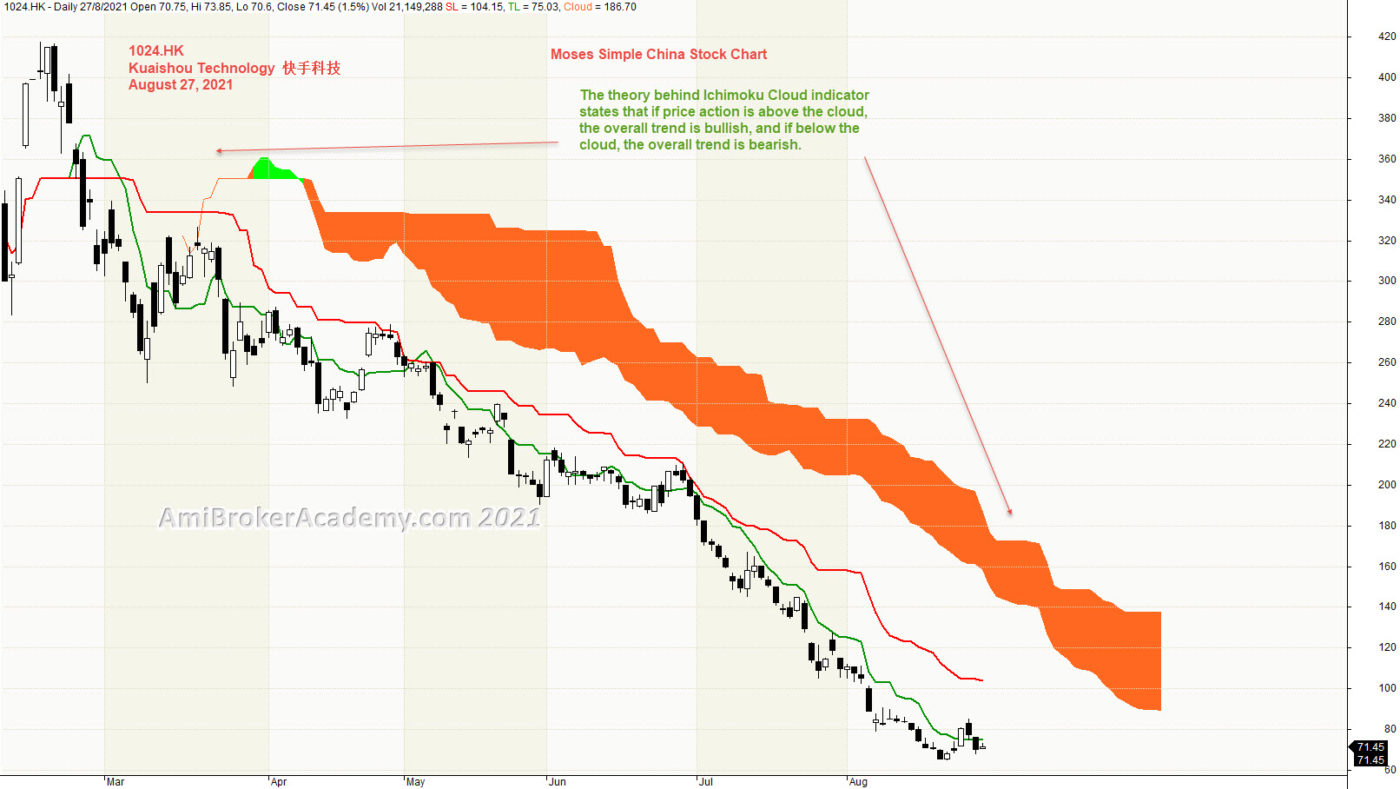
1) Kuaishou Technology 快手科技 and Ichimoku Cloud
Ichimoku Cloud is a trend following strategy tool, can be used in any market and any timeframe.
Using Ichimoku indicator is to emphasize to trade in the trend direction.
The theory behind Ichimoku Cloud indicator states that if price action is above the cloud, the overall trend is bullish, and if below the cloud, the overall trend is bearish.
For the current chart, the trend is in bear trend. For short term maybe to stand aside to wait for price action begin to reverse then look for confirmation before buy.
Don’t play play with Ichimoku indicator. Very simple. Yet powerful. AmiBrokerAcademy provides you simple yet easy to understand stock chart. Check out Moses power stock chart.
20210827 Kuaishou Technology 快手科技 and Ichimoku Cloud
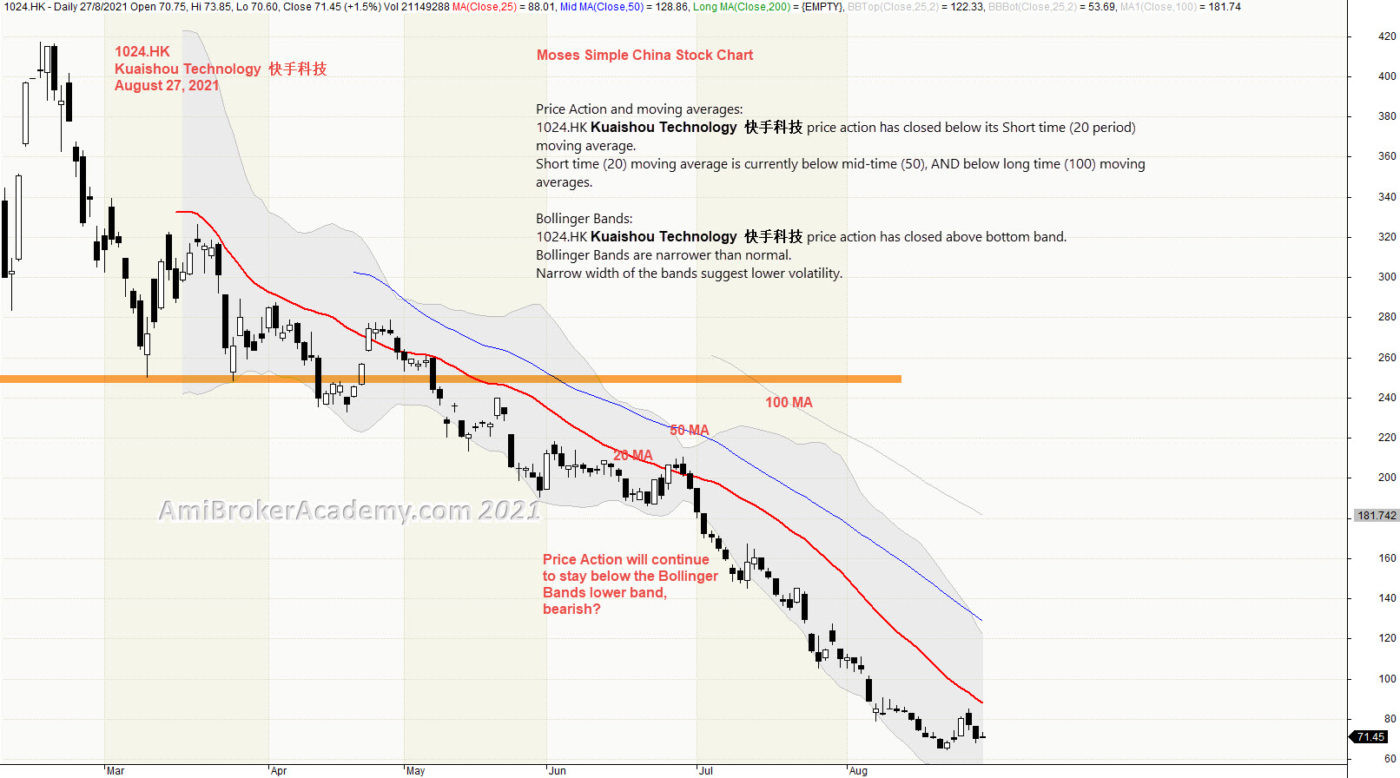
2) Kuaishou Technology 快手科技 and Bollinger Bands and Moving Averages
Price Action and moving averages: 1024.HK Kuaishou Technology 快手科技 price action has closed below its Short time (20 period) moving average. Short time (20) moving average is currently below mid-time (50), AND below long time (100) moving averages.
Bollinger Bands: 1024.HK Kuaishou Technology 快手科技 price action has closed above bottom band. Bollinger Bands are narrower than normal. Narrow width of the bands suggest lower volatility.
Trade what you see. Mange your risk.
20210827 Kuaishou Technology 快手科技 and Bollinger Bands and Moving Averages
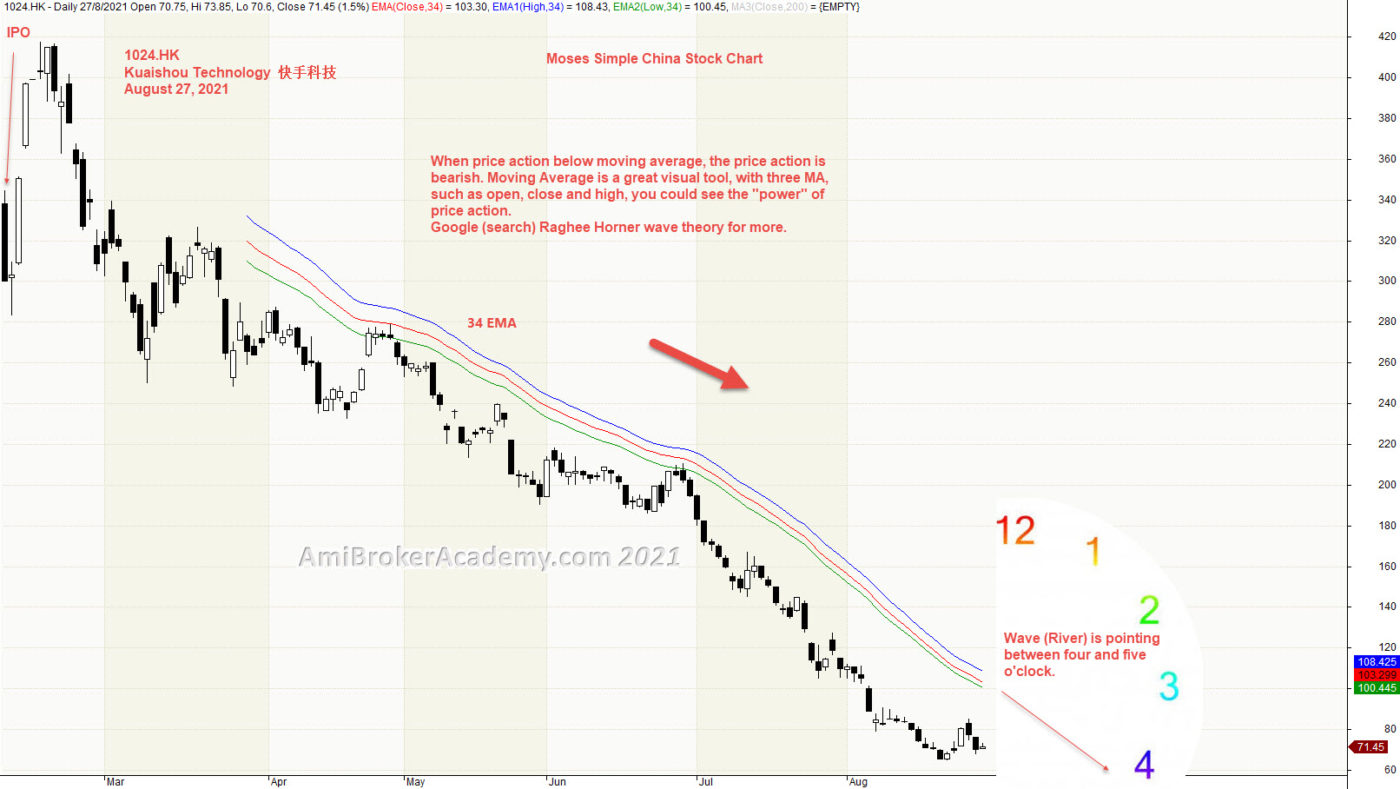
3) Kuaishou Technology 快手科技 and Moving Averages
Price Action is pointing to four and five o’clock direction, price action continues to go south (down). See chart.
Moving Average is a great visual tool. Raghee uses high, low and close of 34 EMA to form a band to determine the wave direction. Price action goes from below 34 EMA to above River and deep down again.
River is a great support resistance tool. Now, price action is resisted by River.
To learn more, you can google (search) Raghee Horner wave theory for more.
Manage your risk.
20210827 Kuaishou Technology 快手科技 and River
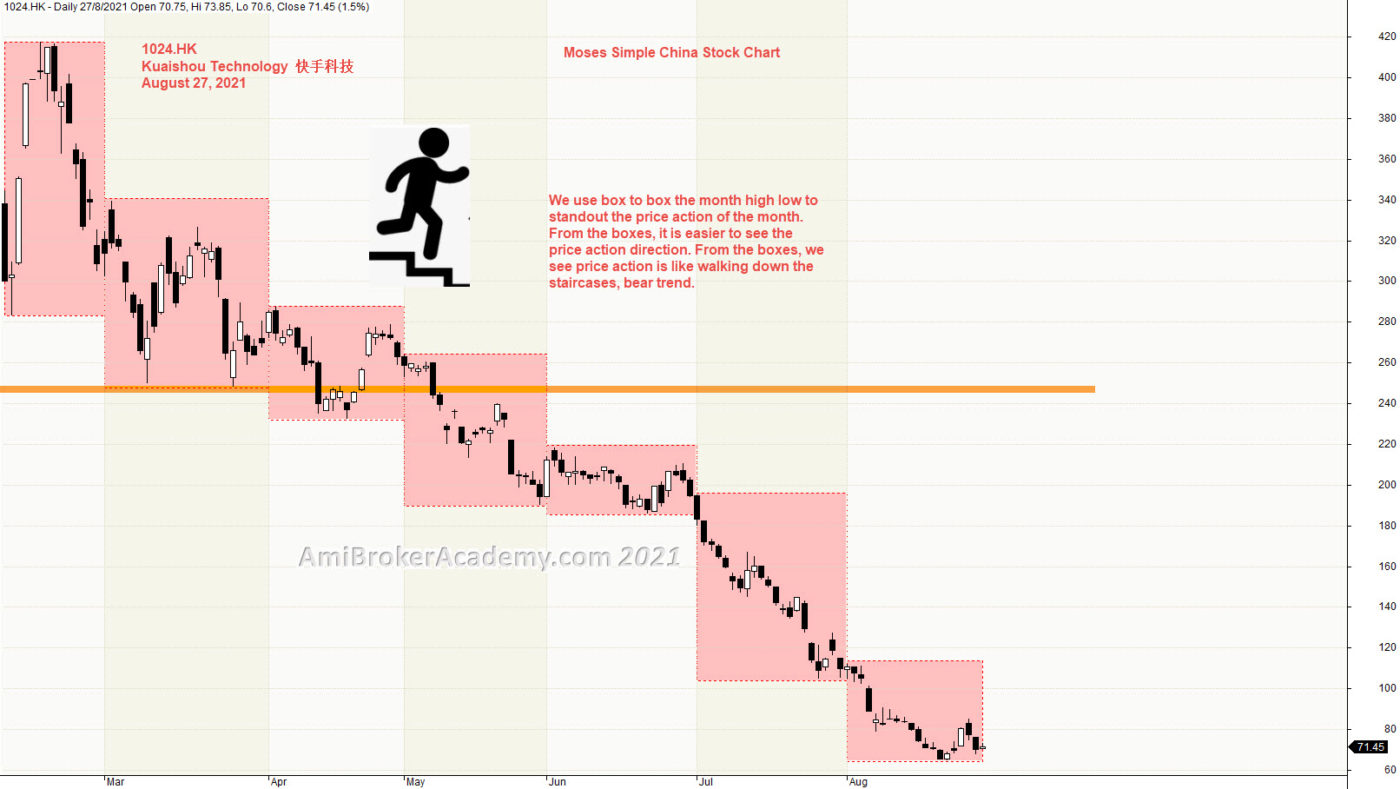
4) Kuaishou Technology 快手科技 and Price Action and Boxes
Picture worth a thousand words. See chart, walking down the steps, bearish trend.
20210827 Kuaishou Technology 快手科技 and Price Action and Boxes
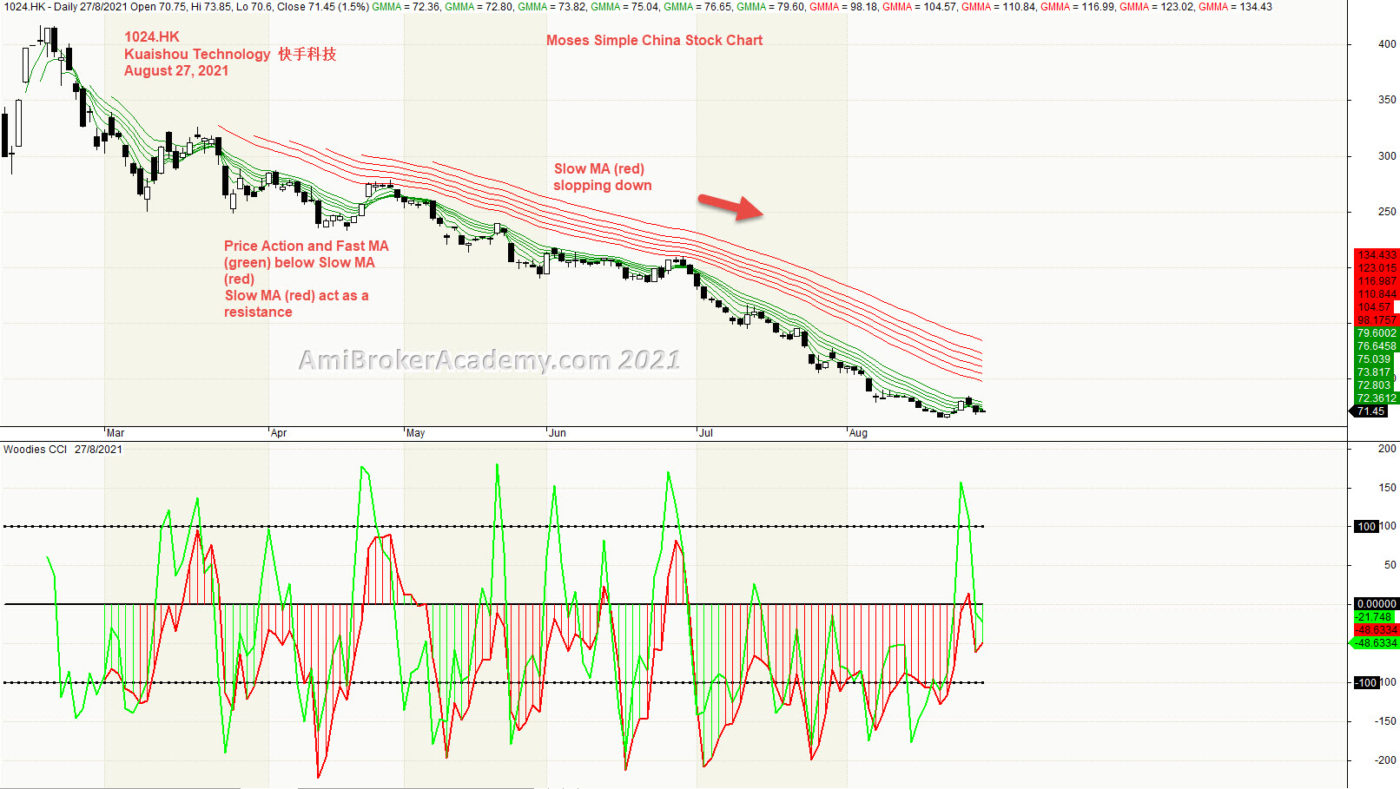
5) Kuaishou Technology 快手科技 and GMMA and Woodies CCI
See chart, picture worth a thousand words.
20210827 Kuaishou Technology 快手科技 and GMMA and Woodies CCI
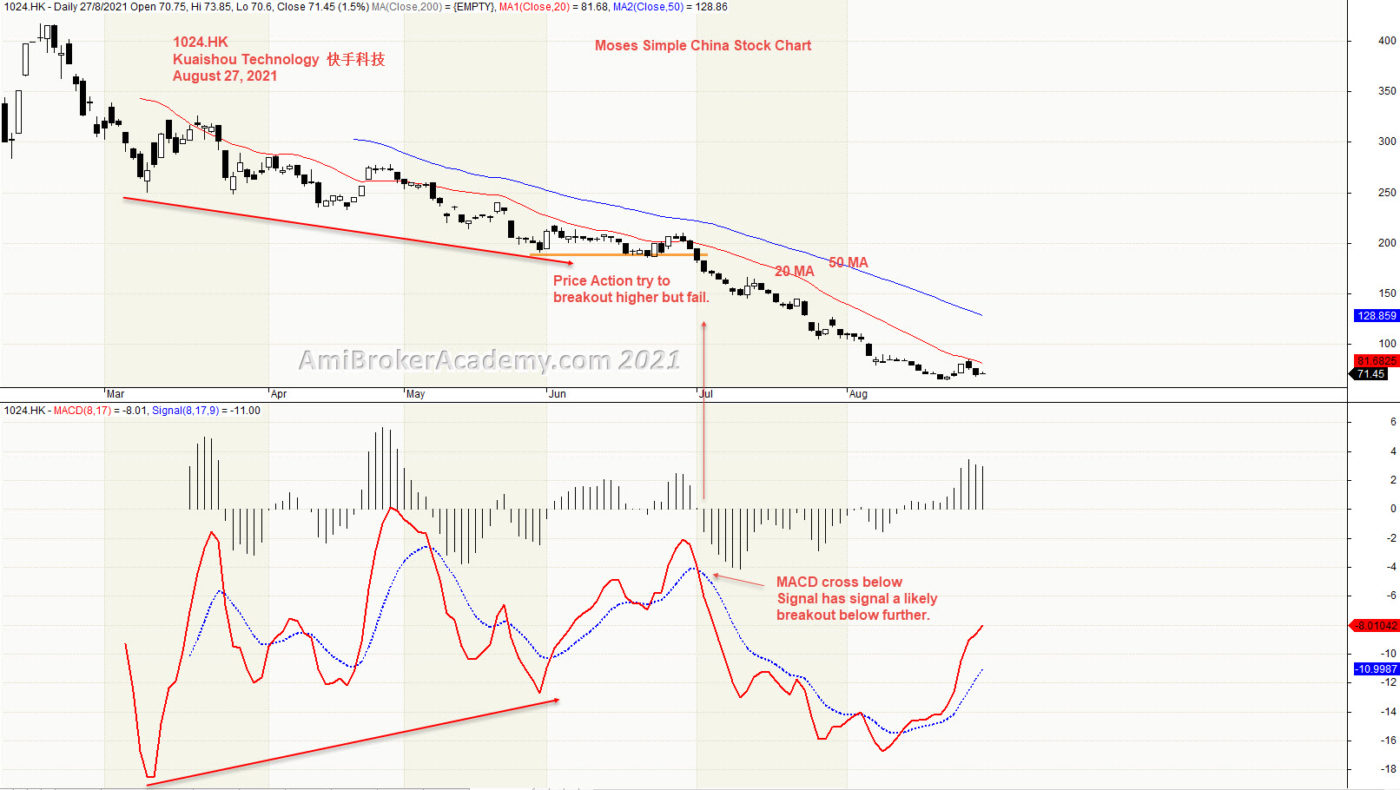
6) Kuaishou Technology 快手科技 and MACD
MACD Divergence.
20210827 Kuaishou Technology 快手科技 and MACD
Moses Power Charting
Official AmiBrokerAcademy.com Charting
Disclaimer
The above result is for illustration purpose. It is not meant to be used for buy or sell decision. We do not recommend any particular stocks. If particular stocks of such are mentioned, they are meant as demonstration of Amibroker as a powerful charting software and MACD. Amibroker can program to scan the stocks for buy and sell signals.
These are script generated signals. Not all scan results are shown here. The MACD signal should use with price action. Users must understand what MACD and price action are all about before using them. If necessary you should attend a course to learn more on Technical Analysis (TA) and Moving Average Convergence Divergence, MACD.
Once again, the website does not guarantee any results or investment return based on the information and instruction you have read here. It should be used as learning aids only and if you decide to trade real money, all trading decision should be your own.
We learn from many past and present great traders. Kudo to these master.
Welcome to AmiBroker Academy dot com, amibrokeracademy.com.
This not a site for those whom just want to know, buy or sell signals. We don’t provide, we provide you the thought. You can decide when to buy and sell and take responsibility.
Trading is all about observation, trade what you see reading the price bar by bar and not checking the news.
By the time you hear the news it is already old and become history. Why? It is very simple, remember where the news come from? It has first someone read the chart and project the change in price action direction. They release their thought to the news agency like CNBC, and so on. Next, someone has to read the news to you after some research and summarize. This will be few hours later, by then the price action has already move.
As for price bar, it is what the market supply and remand. When market feel that is over price, the price will drop. All this reflected on the price bar almost instantly.
Next is how to read our price bar plus using some tools, such as MACD.
Here, we simply translate price action chart into layman language. This will help you in understand the financial instrument you are trading. We believe picture worth a thousand words. So, sometimes we use less words. You can learn the price action interpretation too. Give it a tray. You may not have the same view points as us. Remember all analysis read price action chart differently. It is just like reading an essay, we will have different conclusion.
Trade well.
Trade what you see. Manage your risk.
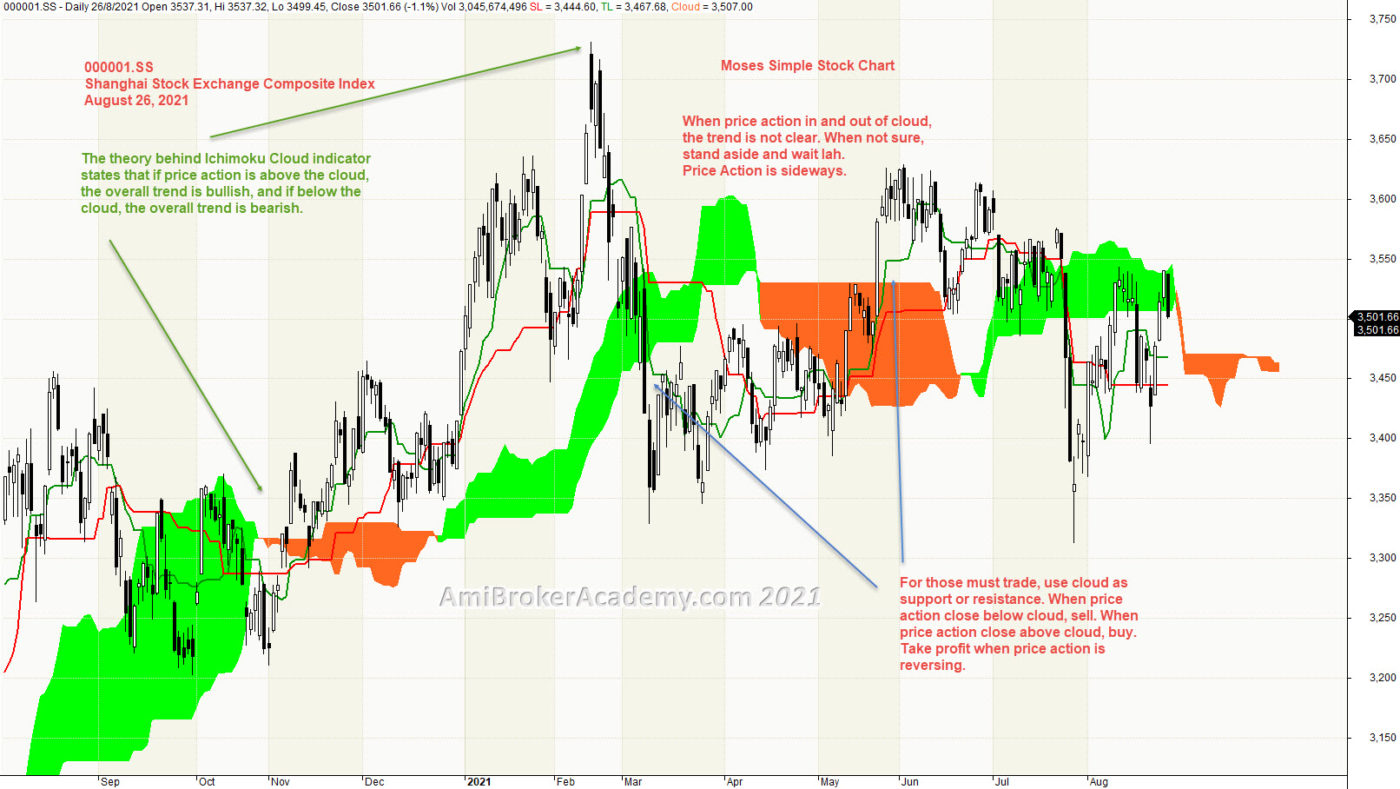
1) Shanghai Stock Exchange Composite Index and Ichimoku Cloud
Ichimoku Cloud is a trend following strategy tool, can be used in any market and any timeframe.
Using Ichimoku indicator is to emphasize to trade in the trend direction.
The theory behind Ichimoku Cloud indicator states that if price action is above the cloud, the overall trend is bullish, and if below the cloud, the overall trend is bearish.
When price action in and out of cloud, the trend is not clear. When not sure, stand aside and wait lah. Price Action is sideways.
For those die die must trade, use cloud as support or resistance. When price action close below cloud, sell. When price action close above cloud, buy. Take profit when price action is reversing.
Don’t play play with Ichimoku indicator. Very simple. Yet powerful. AmiBrokerAcademy provides you simple yet easy to understand stock chart. Check out Moses power stock chart.
20210826 Shanghai Stock Exchange Composite Index and Ichimoku Cloud
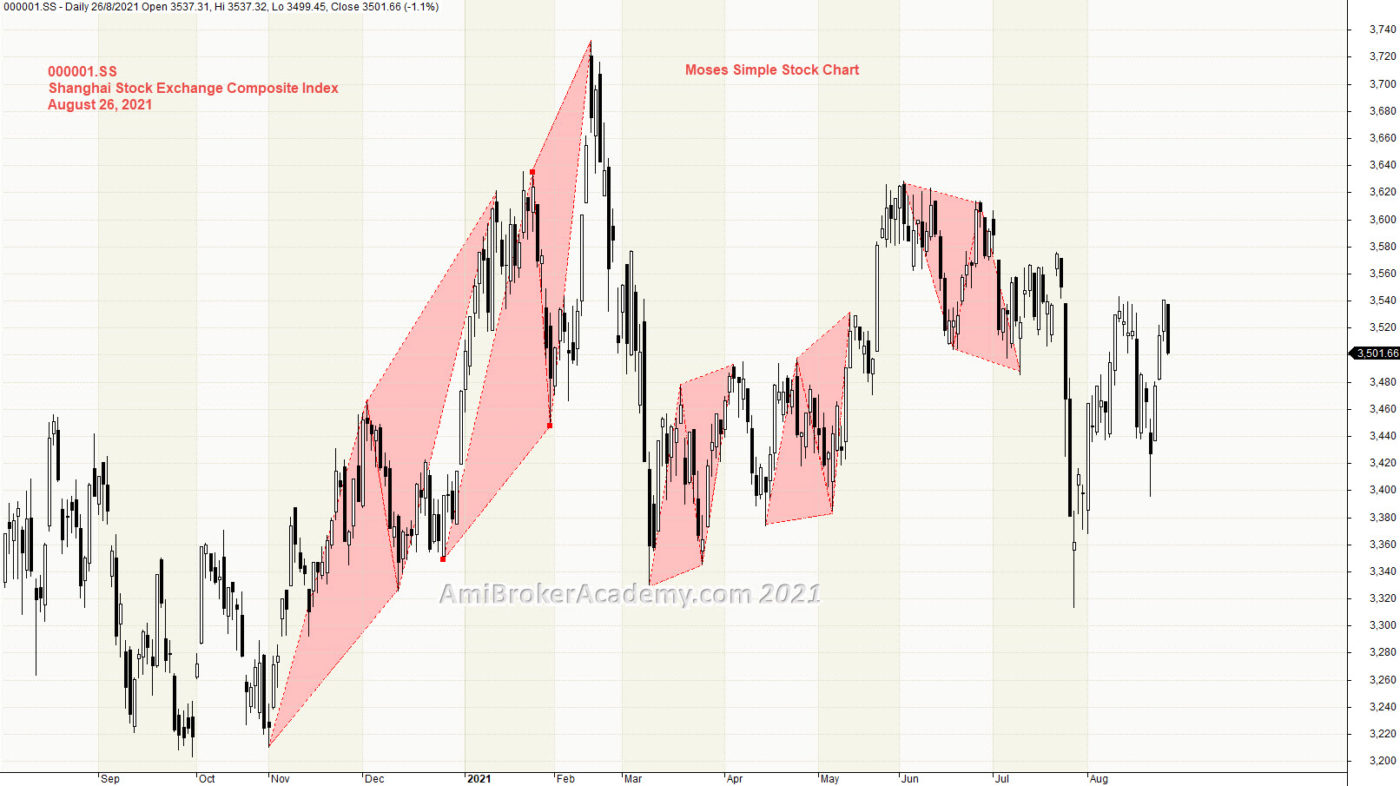
2) Shanghai Stock Exchange Composite Index and Price Action and Symmetrical triangle pattern
Study China Stock Index, Shanghai Stock Exchange Composite Index price action, price action goes from low to high and pullback. If we add the symmetry triangle, you could see the price action pattern, such as AB=CD.
Trade what you see. Mange your risk.
20210826 Shanghai Stock Exchange Composite Index and Price Action and Symmetrical triangle pattern
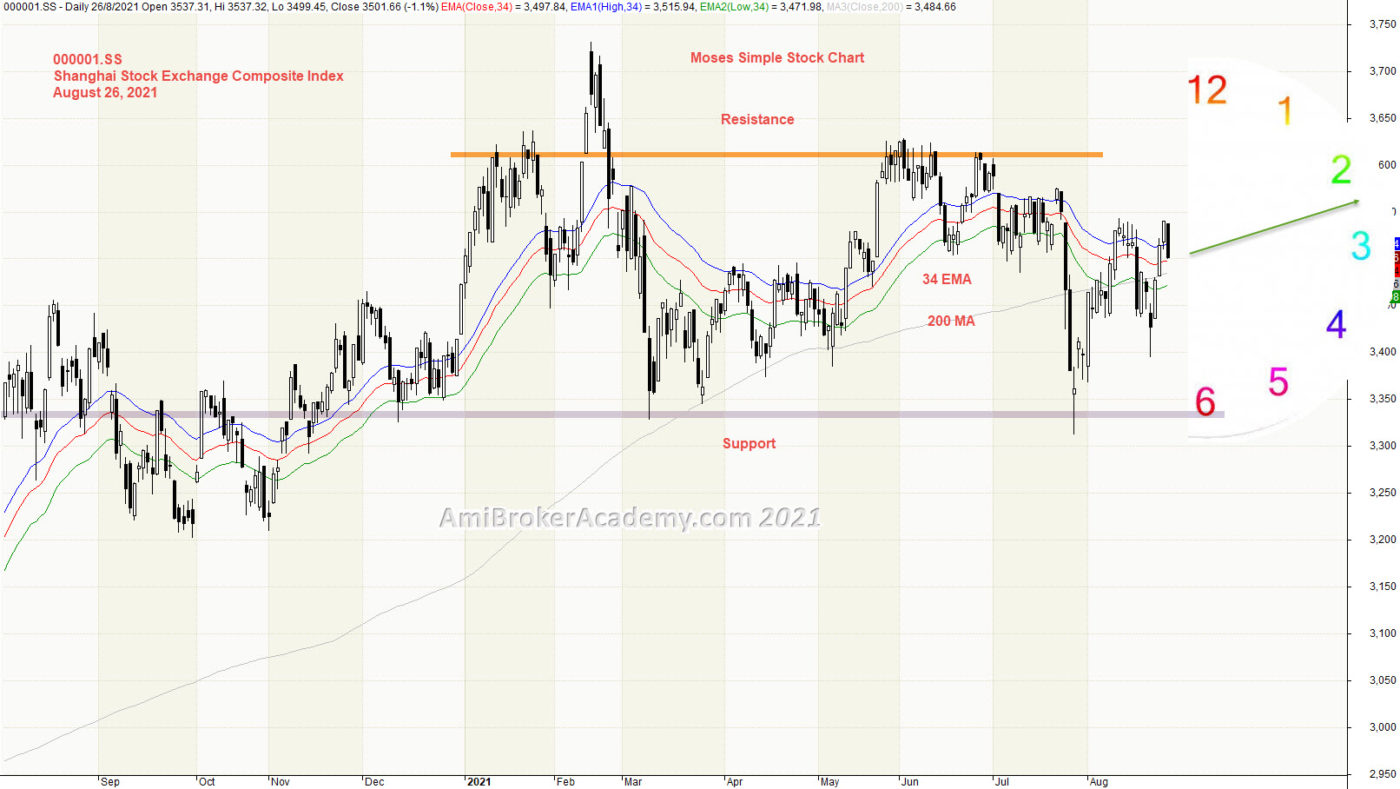
4) Shanghai Stock Exchange Composite Index and River
Price Action is pointing to two and three o’clock direction, price action begin to go sideways. See chart.
Moving Average is a great visual tool. Raghee uses high, low and close of 34 EMA to form a band to determine the wave direction. Price action goes from below 34 EMA to above River and deep down again.
River is a great support resistance tool. Now, price action is resisted by River.
Manage your risk.
20210826 Shanghai Stock Exchange Composite Index and River
Moses Power Charting
Official AmiBrokerAcademy.com Charting
Disclaimer
The above result is for illustration purpose. It is not meant to be used for buy or sell decision. We do not recommend any particular stocks. If particular stocks of such are mentioned, they are meant as demonstration of Amibroker as a powerful charting software and MACD. Amibroker can program to scan the stocks for buy and sell signals.
These are script generated signals. Not all scan results are shown here. The MACD signal should use with price action. Users must understand what MACD and price action are all about before using them. If necessary you should attend a course to learn more on Technical Analysis (TA) and Moving Average Convergence Divergence, MACD.
Once again, the website does not guarantee any results or investment return based on the information and instruction you have read here. It should be used as learning aids only and if you decide to trade real money, all trading decision should be your own.
We learn from many past and present great traders. Kudo to these master.
Welcome to AmiBroker Academy dot com, amibrokeracademy.com.
This not a site for those just want to know, buy or sell. We don’t provide you the buy or sell information, we provide you the thought you can decide and take responsibility.
Trading is all about observation, reading the price bar and not news. By the time you hear the news it is already old and become history. Why? It is very simple, remember where the news come from? It has first someone release to the news agency like CNBC, and so on. Next, someone has to read the news to you after some research and summarize. This will be few hours later, by then the price action has already done.
As for price bar, it is what the market supply and remand. When market feel that is over price, the price will drop. All this reflected on the price bar almost instantly.
Next is how to read our price bar plus using some tools, such as MACD.
Here, we simply translate price action chart into layman language. This will help you in understand the financial instrument you are trading. We believe picture worth a thousand words. So, sometimes we use less words. You can learn the price action interpretation too. Give it a tray. You may not have the same view points as us. Remember all analysis read price action chart differently. It is just like reading an essay, we will have different conclusion.
Trade well.
Trade what you see. Manage your risk.
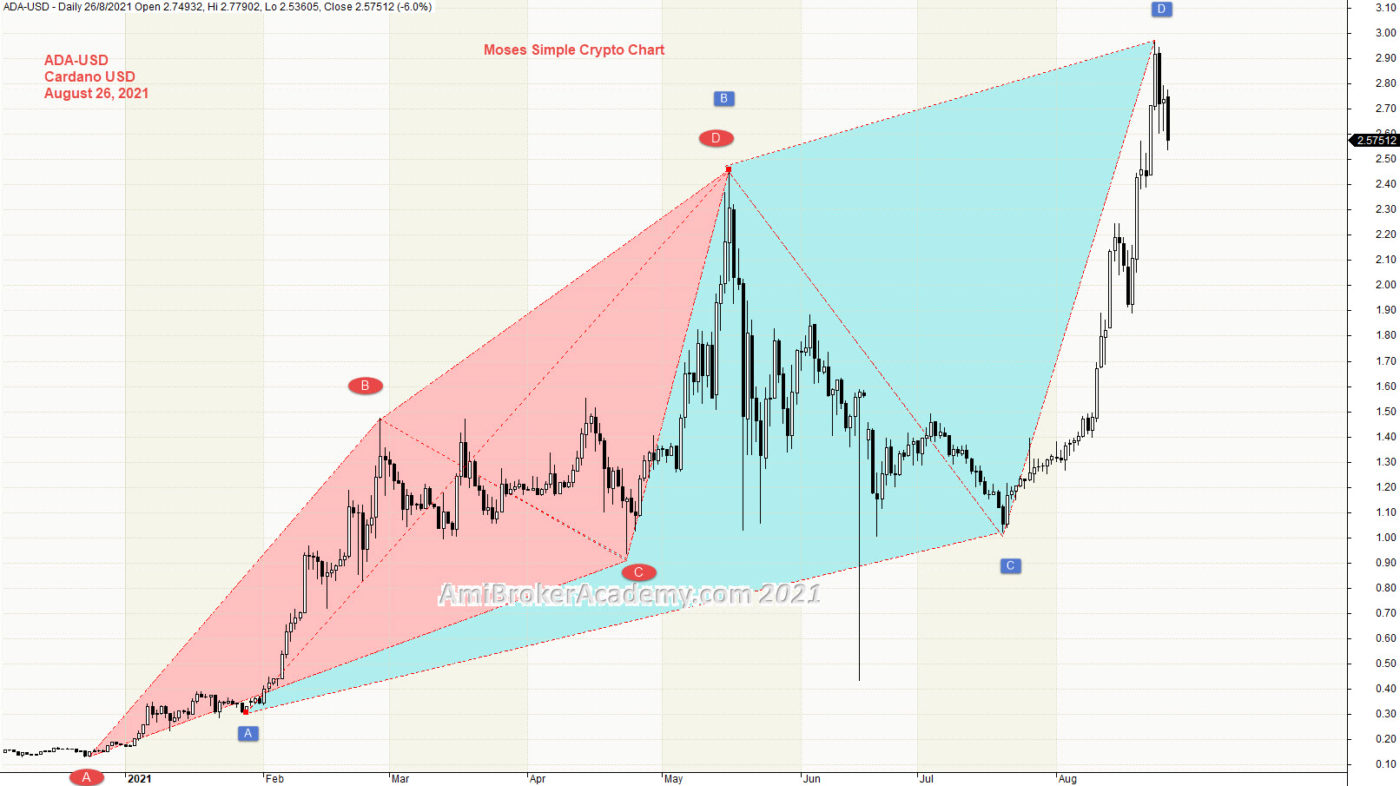
1) Cardano Crypto and Price Action
Trading is actually very simple. Buy low and sell high. Price Action is either moves up or down or sideways. Study Cardano Crypto price action, price action goes from low to high and pullback and breakout higher. If we add the symmetry triangle, you could easily see the price action pattern, such as AB=CD.
Trade what you see. Mange your risk.
20210826 Cardano Crypto and Price Action
Moses Power Charting
Official AmiBrokerAcademy.com Charting
Disclaimer
The above result is for illustration purpose. It is not meant to be used for buy or sell decision. We do not recommend any particular stocks. If particular stocks of such are mentioned, they are meant as demonstration of Amibroker as a powerful charting software and MACD. Amibroker can program to scan the stocks for buy and sell signals.
These are script generated signals. Not all scan results are shown here. The MACD signal should use with price action. Users must understand what MACD and price action are all about before using them. If necessary you should attend a course to learn more on Technical Analysis (TA) and Moving Average Convergence Divergence, MACD.
Once again, the website does not guarantee any results or investment return based on the information and instruction you have read here. It should be used as learning aids only and if you decide to trade real money, all trading decision should be your own.
We learn from many past and present great traders. Kudo to these master.
Welcome to AmiBroker Academy dot com, amibrokeracademy.com.
This not a site for those whom just want to know, buy or sell signals. We don’t provide, we provide you the thought. You can decide when to buy and sell and take responsibility.
Trading is all about observation, trade what you see reading the price bar by bar and not checking the news.
By the time you hear the news it is already old and become history. Why? It is very simple, remember where the news come from? It has first someone read the chart and project the change in price action direction. They release their thought to the news agency like CNBC, and so on. Next, someone has to read the news to you after some research and summarize. This will be few hours later, by then the price action has already move.
As for price bar, it is what the market supply and remand. When market feel that is over price, the price will drop. All this reflected on the price bar almost instantly.
Next is how to read our price bar plus using some tools, such as MACD.
Here, we simply translate price action chart into layman language. This will help you in understand the financial instrument you are trading. We believe picture worth a thousand words. So, sometimes we use less words. You can learn the price action interpretation too. Give it a tray. You may not have the same view points as us. Remember all analysis read price action chart differently. It is just like reading an essay, we will have different conclusion.
Trade well.
Trade what you see. Manage your risk.
1) Bitcoin Crypto and Ichimoku Cloud
Ichimoku Cloud is a trend following strategy tool, can be used in any market and any timeframe. Using Ichimoku indicator is to emphasize to trade in the trend direction. We see price action stay above. Bull trend. First, we see Tenkan Sen (green) above Kijun Sen (red). Next, price action close below cloud and stay below. Finally price action emerge above cloud again. Remember, price action moves in zigzag manner. Trade what you see.
Ichimoku is a great visual tool to help in avoid trading in the wrong direction.
Don’t play play with Ichimoku indicator. Very simple. Yet powerful. AmiBrokerAcademy provides you simple yet easy to understand stock chart. Check out Moses power stock chart.
20210825 Bitcoin Crypto and Ichimoku Cloud
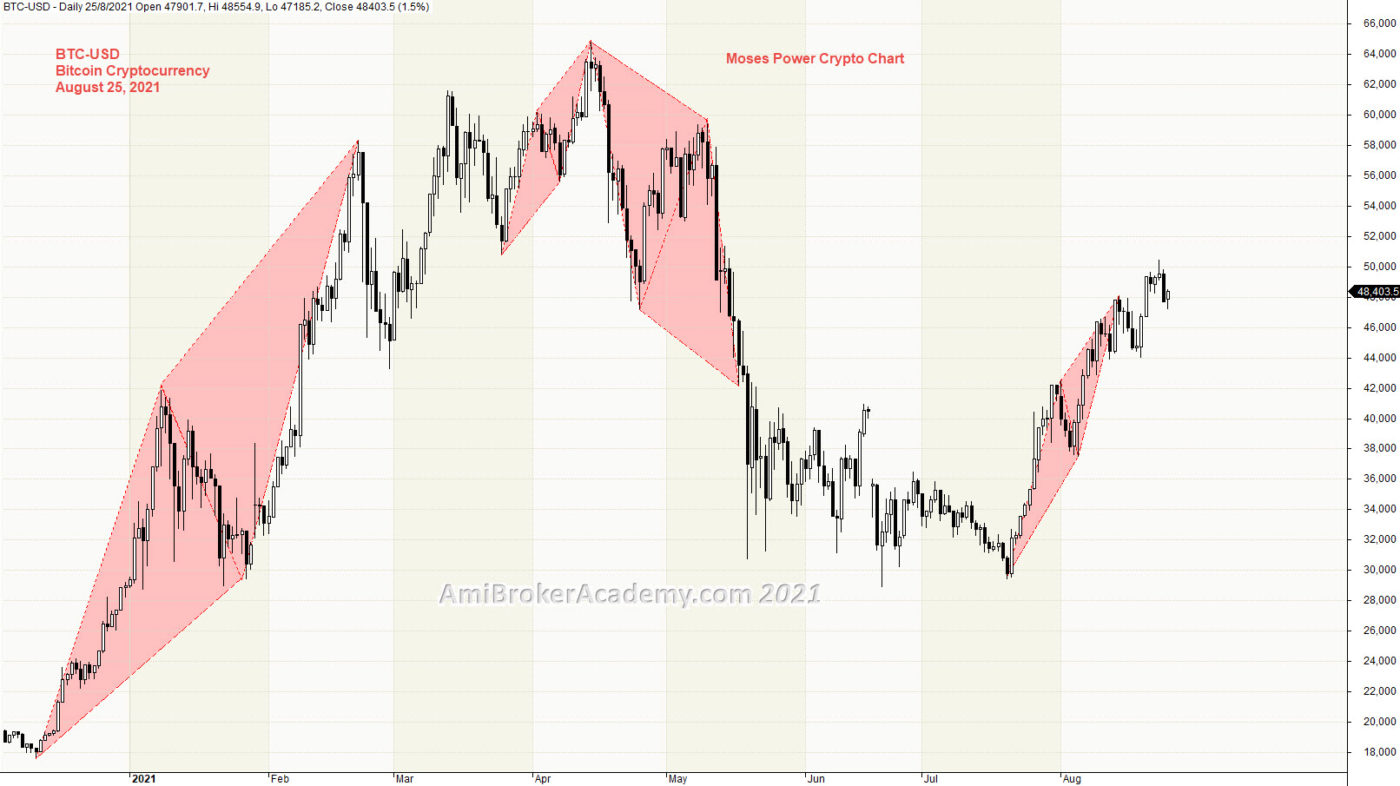
2) Bitcoin Crypto and Price Action and Symmetry Triangle
Study Bitcoin Crypto price action, price action goes from low to high and pullback. If we add the symmetry triangle, you could see the price action pattern, such as AB=CD.
Trade what you see. Mange your risk.
20210825 Bitcoin Crypto and Price Action and Symmetry Triangle
3) Bitcoin Crypto and Price Action and Symmetry Pattern
From a different geometry view, see below. Trade with eyes open.
20210825 Bitcoin Crypto and Price Action and Symmetry Pattern
4) Bitcoin Crypto and River
Price Action is pointing to two o’clock direction, price action still in bull trend. See chart.
Moving Average is a great visual tool. Raghee uses high, low and close of 34 EMA to form a band to determine the wave direction. Price action goes from below 34 EMA to above River and deep down again.
River is a great support resistance tool too. Catch the support to find the entry. Remember to reduce risk by buy support and take profit to sell resistance.
Manage your risk.
20210825 Bitcoin Crypto and River
5) Bitcoin Crypto and GMMA and Woodies CCI
When you are not sure, you should stand aside. Study BTC price action with GMMA and Woodies. Price action goes from low to high, from bottom left to top and right.
It starts from price action and Fast MA (green) from top to below Slow MA (red) and finally stay above.
Mange your risk.
20210825 Bitcoin Crypto and GMMA and Woodies CCI
6) Bitcoin Crypto and Bollinger Bands and Moving Averages
Price Action and moving averages: BTC-USD, Bitcoin Crypto price action has closed above its Short time (20 period) moving average. Short time (20) moving average is currently above mid-time (50), AND below long time (100) moving averages.
Bollinger Bands: BTC-USD, Bitcoin Crypto price action has closed below upper band. Bollinger Bands are narrower than normal.
Mange your risk.
20210825 Bitcoin Crypto and Bollinger Bands and Moving Averages
7) Bitcoin Crypto and MACD
We study price action we see MACD Divergence, price action continues to go higher, but MACD begin to form lower high and MACD Histogram to form lower high. So we expect a reversal is going to happen. But by now everyone has learnt that MACD Divergence is like a traffic light, you don’t stop at every traffic light. So, be the MACD Divergence. The price action may not pullback. But topping signal has now showed.
Trade what you see.
20210825 Bitcoin Crypto and MACD
Moses Power Charting
Official AmiBrokerAcademy.com Charting
Disclaimer
The above result is for illustration purpose. It is not meant to be used for buy or sell decision. We do not recommend any particular stocks. If particular stocks of such are mentioned, they are meant as demonstration of Amibroker as a powerful charting software and MACD. Amibroker can program to scan the stocks for buy and sell signals.
These are script generated signals. Not all scan results are shown here. The MACD signal should use with price action. Users must understand what MACD and price action are all about before using them. If necessary you should attend a course to learn more on Technical Analysis (TA) and Moving Average Convergence Divergence, MACD.
Once again, the website does not guarantee any results or investment return based on the information and instruction you have read here. It should be used as learning aids only and if you decide to trade real money, all trading decision should be your own.
We learn from many past and present great traders. Kudo to these master.
Welcome to AmiBroker Academy dot com, amibrokeracademy.com.
This not a site for those just want to know, buy or sell. We don’t provide you the buy or sell information, we provide you the thought you can decide and take responsibility.
Trading is all about observation, reading the price bar and not news. By the time you hear the news it is already old and become history. Why? It is very simple, remember where the news come from? It has first someone release to the news agency like CNBC, and so on. Next, someone has to read the news to you after some research and summarize. This will be few hours later, by then the price action has already done.
As for price bar, it is what the market supply and remand. When market feel that is over price, the price will drop. All this reflected on the price bar almost instantly.
Next is how to read our price bar plus using some tools, such as MACD.
Here, we simply translate price action chart into layman language. This will help you in understand the financial instrument you are trading. We believe picture worth a thousand words. So, sometimes we use less words. You can learn the price action interpretation too. Give it a tray. You may not have the same view points as us. Remember all analysis read price action chart differently. It is just like reading an essay, we will have different conclusion.
Trade well.
Trade what you see. Manage your risk.
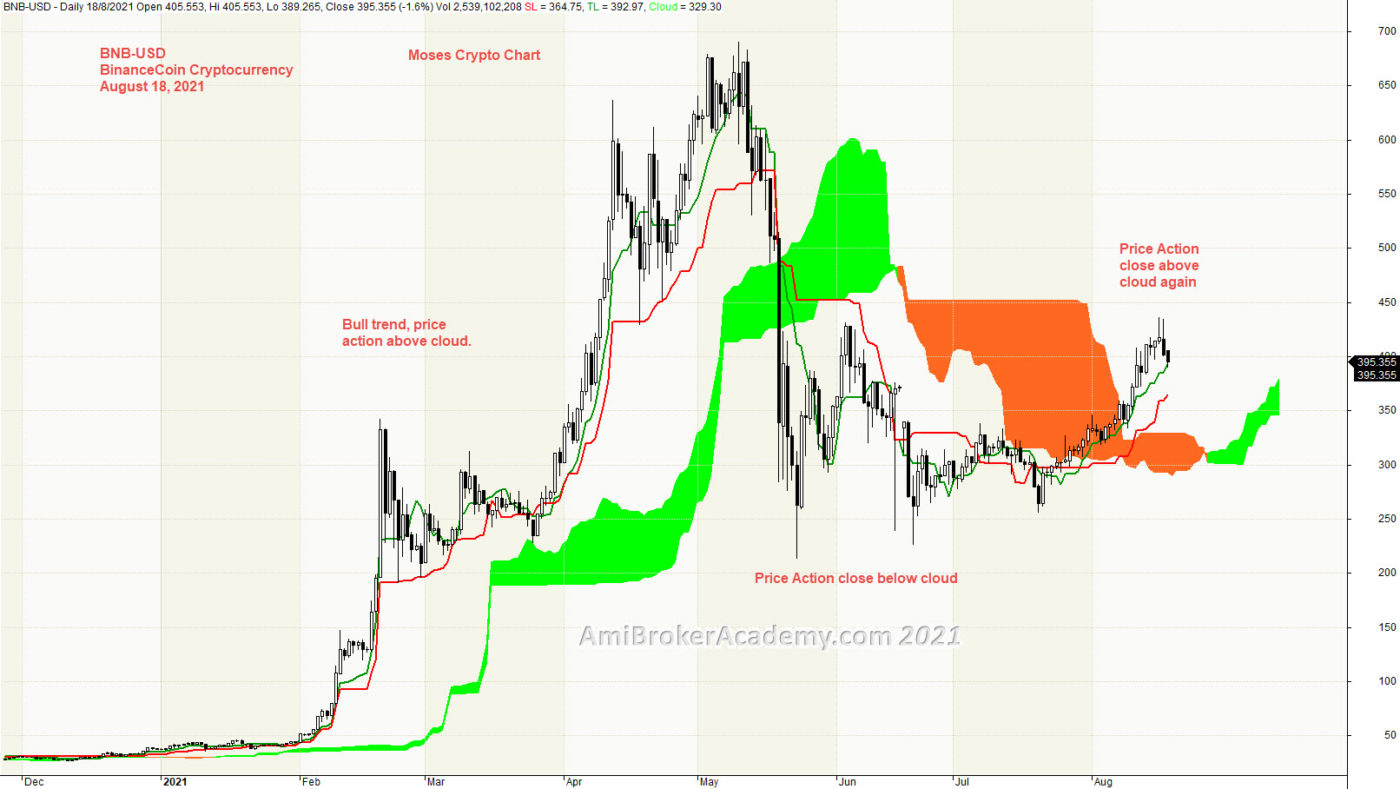
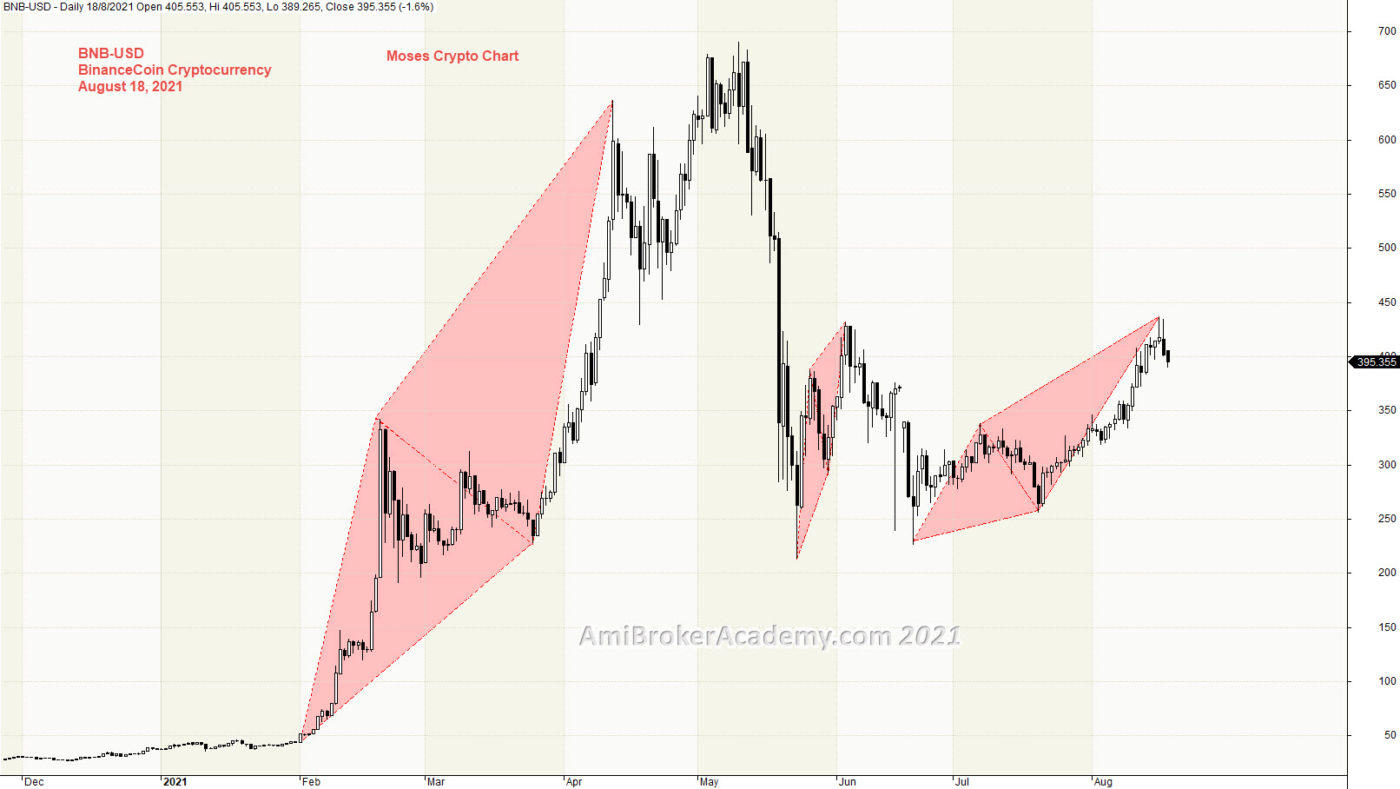
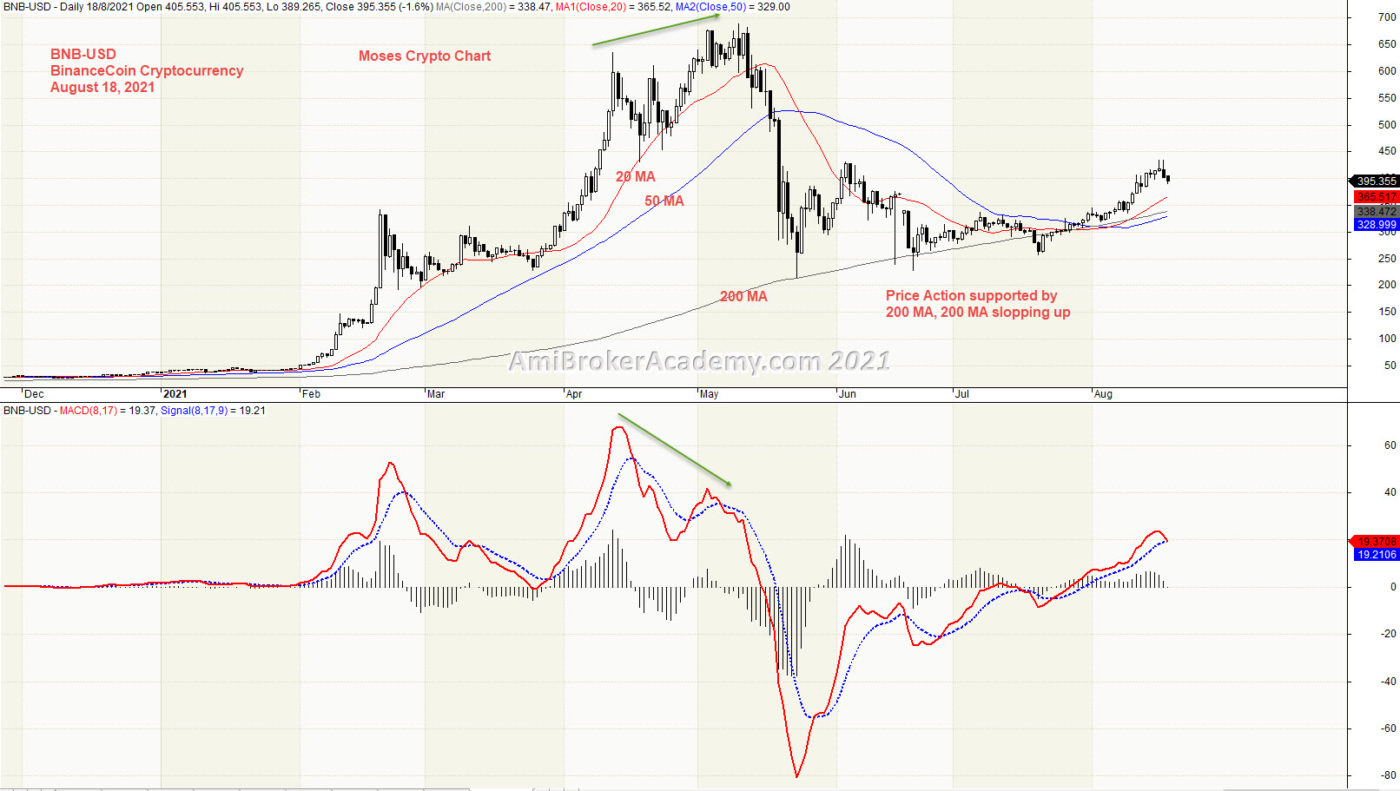
1) BinanceCoin Crypto and Ichimoku Cloud
Ichimoku Cloud is a trend following strategy tool, can be used in any market and any timeframe. Using Ichimoku indicator is to emphasize to trade in the trend direction. We see price action stay above. Bull trend. We see Tenkan Sen (green) after zigzag with Kijun Sen (red) and stay above. Next, price action close below cloud and stay below. Finally price action emerge above cloud. Trade what you see.
Ichimoku is a great visual tool to help in avoid trading in the wrong direction.
Don’t play play with Ichimoku indicator. Very simple. Yet powerful. AmiBrokerAcademy provides you simple yet easy to understand stock chart. Check out Moses power stock chart.
20210818 BinanceCoin Crypto and Ichimoku Cloud
2) BinanceCoin Crypto and Price Action
Study BinanceCoin Crypto price action, price action goes from low to high and pullback. If we add the symmetry triangle, you could see the price action pattern, such as AB=CD.
Trade what you see. Mange your risk.
20210818 BinanceCoin Crypto and Price Action
3) BinanceCoin Crypto and Chart Pattern
From a different geometry view, see below. Trade with eyes open.
20210818 BinanceCoin Crypto and Chart Pattern
4) BinanceCoin Crypto and River
Price Action is pointing to two and three o’clock direction, price action still in bull trend. See chart.
Moving Average is a great visual tool. Raghee uses high, low and close of 34 EMA to form a band to determine the wave direction. Price action goes from below 34 EMA to above River and deep down again.
River is a great support resistance tool too. Catch the support to find the entry. Remember to reduce risk by buy support and take profit to sell resistance.
Manage your risk.
20210818 BinanceCoin Crypto and River
5) BinanceCoin Crypto and GMMA and Woodies CCI
When you are not sure, you should stand aside. Study BNB price action with GMMA and Woodies. Price action goes from low to high, from bottom left to top and right.
It starts from price action and Fast MA (green) from top to below Slow MA (red) and finally stay above.
From Woodies CCI, price action continues to go higher. But, Woodies CCi is forming lower high. Divergence. Price Action was topping. Trade with eyes open.
Mange your risk.
20210818 BinanceCoin Crypto and GMMA and Woodies CCI
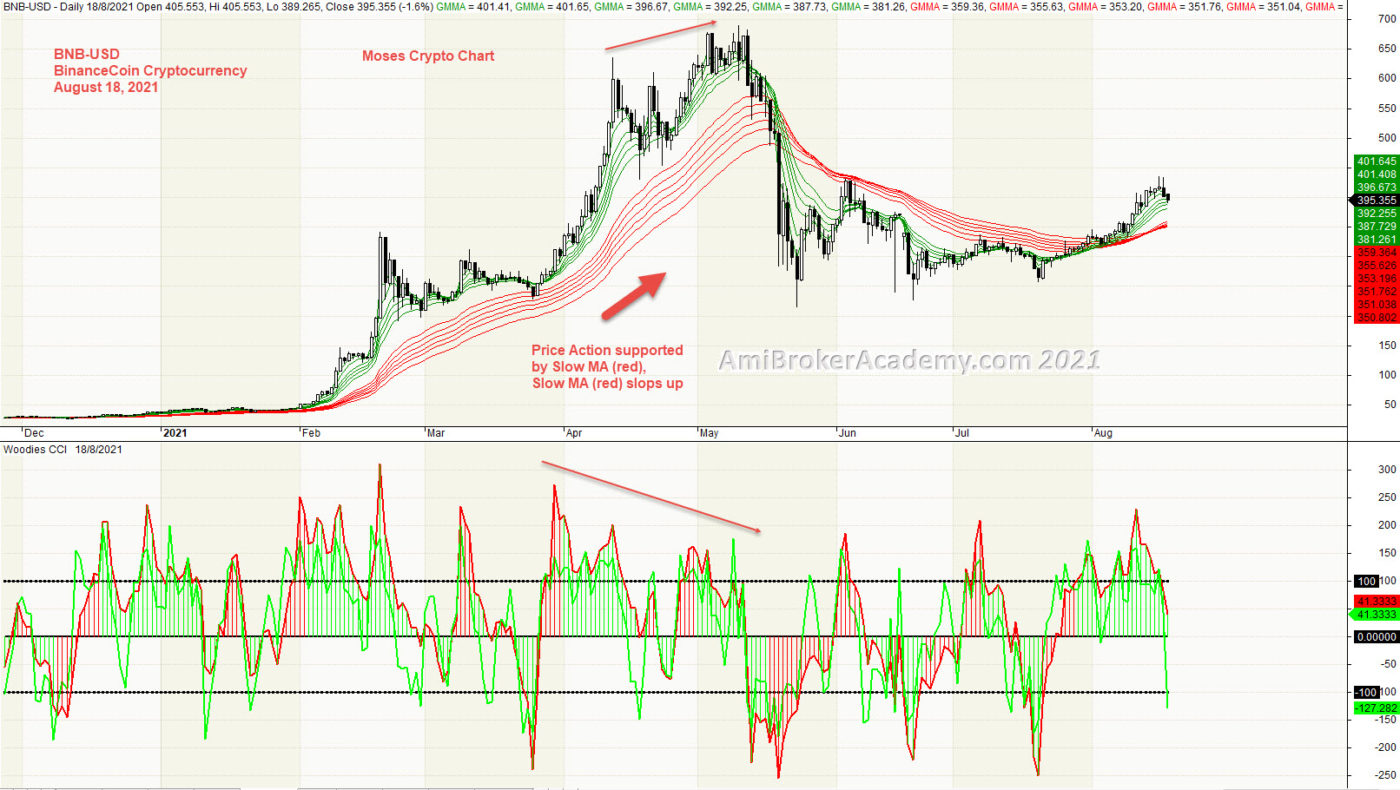
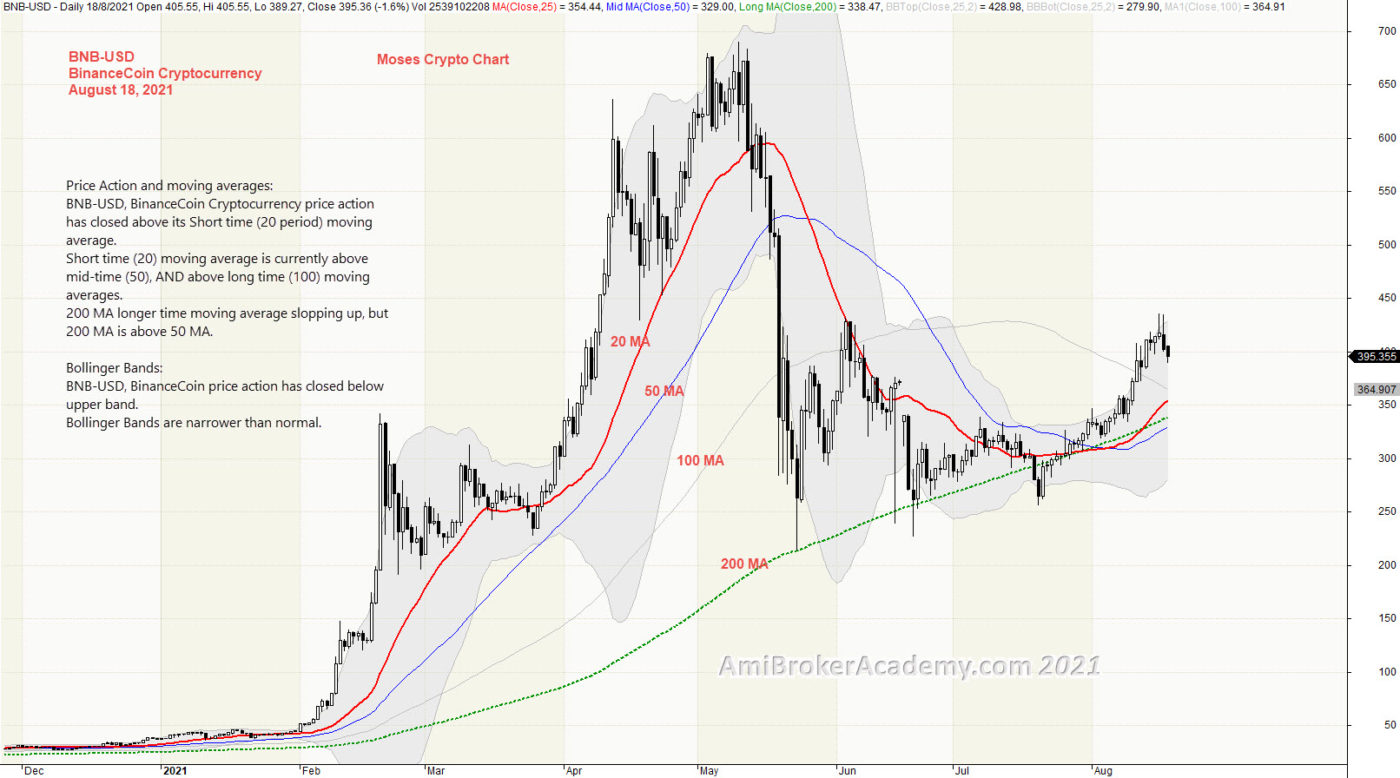
6) BinanceCoin Crypto and Bollinger Bands and Moving Averages
Price Action and moving averages: BNB-USD, BinanceCoin Cryptocurrency price action has closed above its Short time (20 period) moving average. Short time (20) moving average is currently above mid-time (50), AND above long time (100) moving averages. 200 MA longer time moving average slopping up, but 200 MA is above 50 MA.
Bollinger Bands: BNB-USD, BinanceCoin price action has closed below upper band. Bollinger Bands are narrower than normal.
Mange your risk.
20210818 BinanceCoin Crypto and Bollinger Bands and Moving Averages
7) BinanceCoin Crypto and MACD and MACD Divergence
We study price action we see MACD Divergence, price action continues to go higher, but MACD begin to form lower high and MACD Histogram to form lower high. So we expect a reversal is going to happen. But by now everyone has learnt that MACD Divergence is like a traffic light, you don’t stop at every traffic light. So, be the MACD Divergence. The price action may not pullback. But topping signal has now showed.
Trade what you see.
So, read the information you can get from the chart.
Remember, we just read what the chart said. Have fun!
But. don’t play play with MACD indicator. Very simple yet powerful.
20210818 BinanceCoin Crypto and MACD
Moses Power Charting
Official AmiBrokerAcademy.com Charting
Disclaimer
The above result is for illustration purpose. It is not meant to be used for buy or sell decision. We do not recommend any particular stocks. If particular stocks of such are mentioned, they are meant as demonstration of Amibroker as a powerful charting software and MACD. Amibroker can program to scan the stocks for buy and sell signals.
These are script generated signals. Not all scan results are shown here. The MACD signal should use with price action. Users must understand what MACD and price action are all about before using them. If necessary you should attend a course to learn more on Technical Analysis (TA) and Moving Average Convergence Divergence, MACD.
Once again, the website does not guarantee any results or investment return based on the information and instruction you have read here. It should be used as learning aids only and if you decide to trade real money, all trading decision should be your own.
We learn from many past and present great traders. Kudo to these master.
To identify any stock will move in near eight thousand stocks will take a lot of time. But, when you use script like AmiBroker AFL Script, it will only take less than fifteen minutes.
Welcome!
Welcome to AmiBroker Academy. Thanks for visiting the site.
Moving Average Convergence Divergence, MACD Screener
MACD was developed by Gerald Appel in the late seventies.
MACD stands for Moving Average Convergence Divergence, the MACD line (red line or called fast line) and MACD signal line (blue line, or called slow line).
MACD Bullish Signal Line Cross: MACD bullish signal when red line crosses above the blue line or MACD line crosses above zero line.
MACD Bearish Signal Line Cross: MACD bearish signal when blue line crosses below red line or MACD line crosses below zero line.
MACD Scan
These are stocks picked for today.
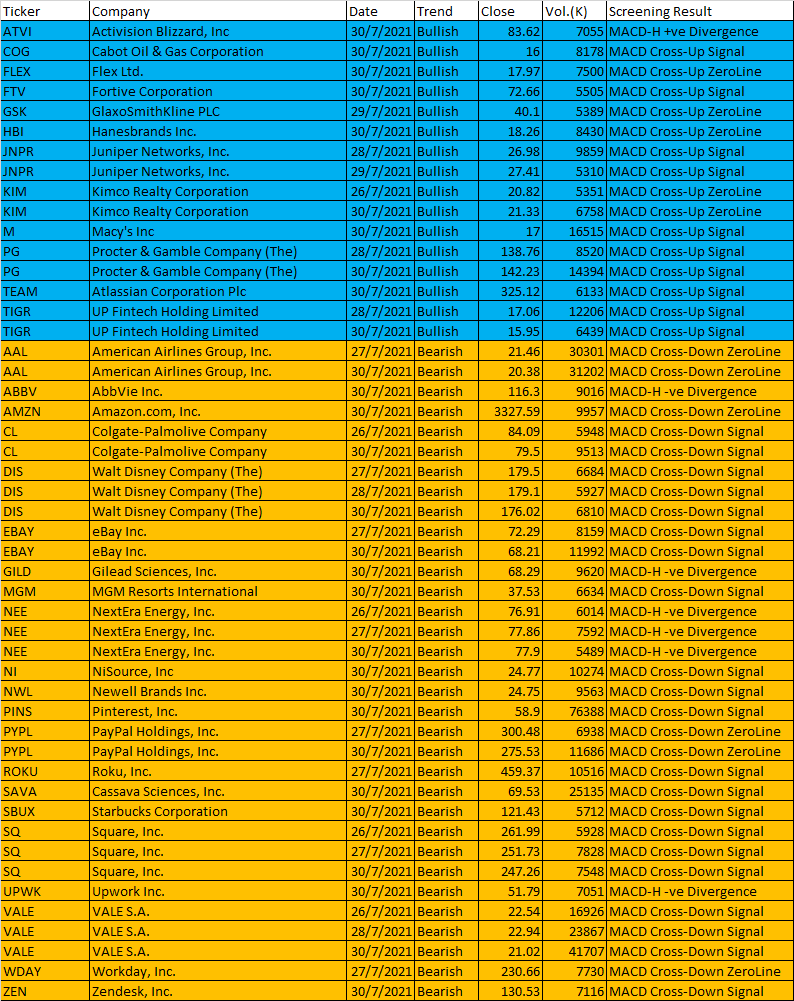
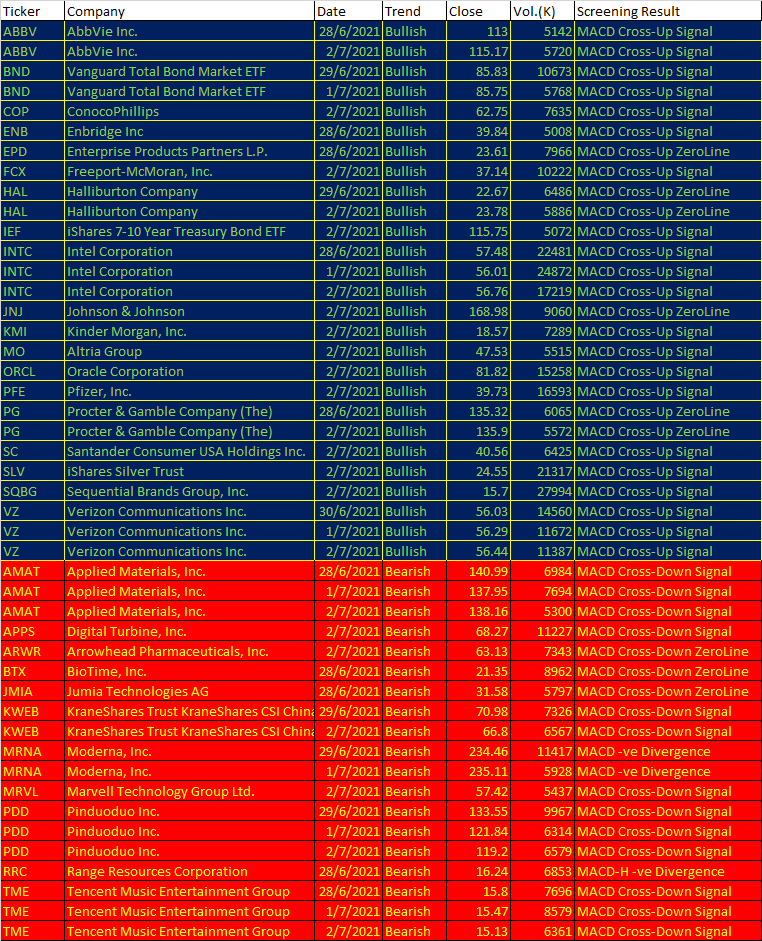
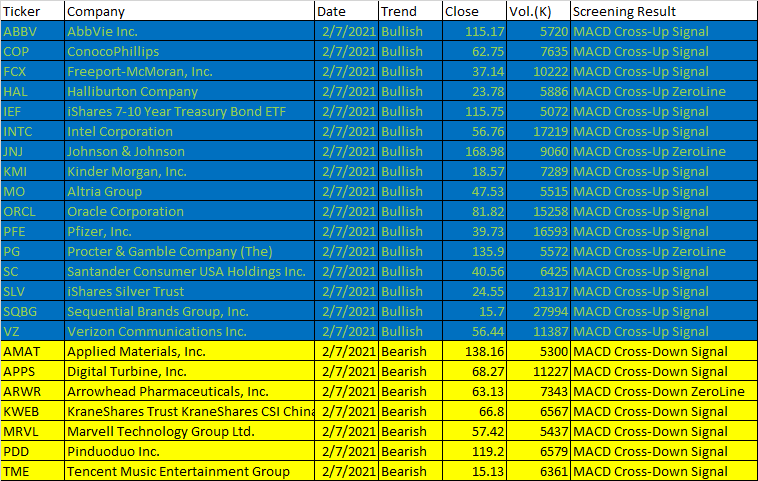
Some of August 9 to 13, 2021 AmiBroker AFL Script Generated Five-day US Stock MACD Signals
Ticker
Company
Date
Trend
Close
Vol.(K)
Screening Result
ATVI
Activision Blizzard, Inc
30/7/2021
Bullish
83.62
7055
MACD-H +ve Divergence
COG
Cabot Oil & Gas Corporation
30/7/2021
Bullish
16
8178
MACD Cross-Up Signal
FLEX
Flex Ltd.
30/7/2021
Bullish
17.97
7500
MACD Cross-Up ZeroLine
FTV
Fortive Corporation
30/7/2021
Bullish
72.66
5505
MACD Cross-Up Signal
GSK
GlaxoSmithKline PLC
29/7/2021
Bullish
40.1
5389
MACD Cross-Up ZeroLine
HBI
Hanesbrands Inc.
30/7/2021
Bullish
18.26
8430
MACD Cross-Up ZeroLine
JNPR
Juniper Networks, Inc.
28/7/2021
Bullish
26.98
9859
MACD Cross-Up Signal
JNPR
Juniper Networks, Inc.
29/7/2021
Bullish
27.41
5310
MACD Cross-Up Signal
KIM
Kimco Realty Corporation
26/7/2021
Bullish
20.82
5351
MACD Cross-Up ZeroLine
KIM
Kimco Realty Corporation
30/7/2021
Bullish
21.33
6758
MACD Cross-Up ZeroLine
M
Macy’s Inc
30/7/2021
Bullish
17
16515
MACD Cross-Up Signal
PG
Procter & Gamble Company (The)
28/7/2021
Bullish
138.76
8520
MACD Cross-Up Signal
PG
Procter & Gamble Company (The)
30/7/2021
Bullish
142.23
14394
MACD Cross-Up Signal
TEAM
Atlassian Corporation Plc
30/7/2021
Bullish
325.12
6133
MACD Cross-Up Signal
TIGR
UP Fintech Holding Limited
28/7/2021
Bullish
17.06
12206
MACD Cross-Up Signal
TIGR
UP Fintech Holding Limited
30/7/2021
Bullish
15.95
6439
MACD Cross-Up Signal
AAL
American Airlines Group, Inc.
27/7/2021
Bearish
21.46
30301
MACD Cross-Down ZeroLine
AAL
American Airlines Group, Inc.
30/7/2021
Bearish
20.38
31202
MACD Cross-Down ZeroLine
ABBV
AbbVie Inc.
30/7/2021
Bearish
116.3
9016
MACD-H -ve Divergence
AMZN
Amazon.com, Inc.
30/7/2021
Bearish
3327.59
9957
MACD Cross-Down ZeroLine
CL
Colgate-Palmolive Company
26/7/2021
Bearish
84.09
5948
MACD Cross-Down Signal
CL
Colgate-Palmolive Company
30/7/2021
Bearish
79.5
9513
MACD Cross-Down Signal
DIS
Walt Disney Company (The)
27/7/2021
Bearish
179.5
6684
MACD Cross-Down Signal
DIS
Walt Disney Company (The)
28/7/2021
Bearish
179.1
5927
MACD Cross-Down Signal
DIS
Walt Disney Company (The)
30/7/2021
Bearish
176.02
6810
MACD Cross-Down Signal
EBAY
eBay Inc.
27/7/2021
Bearish
72.29
8159
MACD Cross-Down Signal
EBAY
eBay Inc.
30/7/2021
Bearish
68.21
11992
MACD Cross-Down Signal
GILD
Gilead Sciences, Inc.
30/7/2021
Bearish
68.29
9620
MACD-H -ve Divergence
MGM
MGM Resorts International
30/7/2021
Bearish
37.53
6634
MACD Cross-Down Signal
NEE
NextEra Energy, Inc.
26/7/2021
Bearish
76.91
6014
MACD-H -ve Divergence
NEE
NextEra Energy, Inc.
27/7/2021
Bearish
77.86
7592
MACD-H -ve Divergence
NEE
NextEra Energy, Inc.
30/7/2021
Bearish
77.9
5489
MACD-H -ve Divergence
NI
NiSource, Inc
30/7/2021
Bearish
24.77
10274
MACD Cross-Down Signal
NWL
Newell Brands Inc.
30/7/2021
Bearish
24.75
9563
MACD Cross-Down Signal
PINS
Pinterest, Inc.
30/7/2021
Bearish
58.9
76388
MACD Cross-Down Signal
PYPL
PayPal Holdings, Inc.
27/7/2021
Bearish
300.48
6938
MACD Cross-Down ZeroLine
PYPL
PayPal Holdings, Inc.
30/7/2021
Bearish
275.53
11686
MACD Cross-Down ZeroLine
ROKU
Roku, Inc.
27/7/2021
Bearish
459.37
10516
MACD Cross-Down Signal
SAVA
Cassava Sciences, Inc.
30/7/2021
Bearish
69.53
25135
MACD Cross-Down Signal
SBUX
Starbucks Corporation
30/7/2021
Bearish
121.43
5712
MACD Cross-Down Signal
SQ
Square, Inc.
26/7/2021
Bearish
261.99
5928
MACD Cross-Down Signal
SQ
Square, Inc.
27/7/2021
Bearish
251.73
7828
MACD Cross-Down Signal
SQ
Square, Inc.
30/7/2021
Bearish
247.26
7548
MACD Cross-Down Signal
UPWK
Upwork Inc.
30/7/2021
Bearish
51.79
7051
MACD-H -ve Divergence
VALE
VALE S.A.
26/7/2021
Bearish
22.54
16926
MACD Cross-Down Signal
VALE
VALE S.A.
28/7/2021
Bearish
22.94
23867
MACD Cross-Down Signal
VALE
VALE S.A.
30/7/2021
Bearish
21.02
41707
MACD Cross-Down Signal
WDAY
Workday, Inc.
27/7/2021
Bearish
230.66
7730
MACD Cross-Down ZeroLine
ZEN
Zendesk, Inc.
30/7/2021
Bearish
130.53
7116
MACD Cross-Down Signal
August 9 to 13, 2021 AmiBroker AFL Script Generated Five-day US Stock MACD Signals
Moses Stock Scan
Free Power US Stock MACD Scan Signals AmiBroker Academy.com
Disclaimer: The above result is for illustration purpose. It is not meant to be used for buy or sell decision. We do not recommend any particular stocks on our website. If particular stocks of such are mentioned, they are meant as illustration or demonstration of Amibroker as a powerful charting software or MACD scanner. Amibroker can program to scan the stocks that have MACD buy or sell signals.
These are script generated signals. Not all scan results are shown here. The MACD signal should use with price action and confirmation. Users must understand what MACD and price action are all about before using them. If necessary you should attend a course to learn more about Technical Analysis (TA) and Moving Average Convergence Divergence, MACD.
Once again, the website does not guarantee any results or investment return based on the information and instruction you have read here. It should be used as learning aids only and if you decide to trade real money, all trading decision should be your own, and you should take your own responsibility.
To identify any stock will move in near eight thousand stocks will take a lot of time. But, when you use script like AmiBroker AFL Script, it will only take less than fifteen minutes.
Welcome!
Welcome to AmiBroker Academy. Thanks for visiting the site.
Moving Average Convergence Divergence, MACD Screener
MACD was developed by Gerald Appel in the late seventies.
MACD stands for Moving Average Convergence Divergence, the MACD line (red line or called fast line) and MACD signal line (blue line, or called slow line).
MACD Bullish Signal Line Cross: MACD bullish signal when red line crosses above the blue line or MACD line crosses above zero line.
MACD Bearish Signal Line Cross: MACD bearish signal when blue line crosses below red line or MACD line crosses below zero line.
MACD Scan
These are stocks picked for today.
Some of August 2 to 6, 2021 AmiBroker AFL Script Generated Five-day US Stock MACD Signals
Ticker
Company
Date
Trend
Close
Vol.(K)
Screening Result
ATVI
Activision Blizzard, Inc
30/7/2021
Bullish
83.62
7055
MACD-H +ve Divergence
COG
Cabot Oil & Gas Corporation
30/7/2021
Bullish
16
8178
MACD Cross-Up Signal
FLEX
Flex Ltd.
30/7/2021
Bullish
17.97
7500
MACD Cross-Up ZeroLine
FTV
Fortive Corporation
30/7/2021
Bullish
72.66
5505
MACD Cross-Up Signal
GSK
GlaxoSmithKline PLC
29/7/2021
Bullish
40.1
5389
MACD Cross-Up ZeroLine
HBI
Hanesbrands Inc.
30/7/2021
Bullish
18.26
8430
MACD Cross-Up ZeroLine
JNPR
Juniper Networks, Inc.
28/7/2021
Bullish
26.98
9859
MACD Cross-Up Signal
JNPR
Juniper Networks, Inc.
29/7/2021
Bullish
27.41
5310
MACD Cross-Up Signal
KIM
Kimco Realty Corporation
26/7/2021
Bullish
20.82
5351
MACD Cross-Up ZeroLine
KIM
Kimco Realty Corporation
30/7/2021
Bullish
21.33
6758
MACD Cross-Up ZeroLine
M
Macy’s Inc
30/7/2021
Bullish
17
16515
MACD Cross-Up Signal
PG
Procter & Gamble Company (The)
28/7/2021
Bullish
138.76
8520
MACD Cross-Up Signal
PG
Procter & Gamble Company (The)
30/7/2021
Bullish
142.23
14394
MACD Cross-Up Signal
TEAM
Atlassian Corporation Plc
30/7/2021
Bullish
325.12
6133
MACD Cross-Up Signal
TIGR
UP Fintech Holding Limited
28/7/2021
Bullish
17.06
12206
MACD Cross-Up Signal
TIGR
UP Fintech Holding Limited
30/7/2021
Bullish
15.95
6439
MACD Cross-Up Signal
AAL
American Airlines Group, Inc.
27/7/2021
Bearish
21.46
30301
MACD Cross-Down ZeroLine
AAL
American Airlines Group, Inc.
30/7/2021
Bearish
20.38
31202
MACD Cross-Down ZeroLine
ABBV
AbbVie Inc.
30/7/2021
Bearish
116.3
9016
MACD-H -ve Divergence
AMZN
Amazon.com, Inc.
30/7/2021
Bearish
3327.59
9957
MACD Cross-Down ZeroLine
CL
Colgate-Palmolive Company
26/7/2021
Bearish
84.09
5948
MACD Cross-Down Signal
CL
Colgate-Palmolive Company
30/7/2021
Bearish
79.5
9513
MACD Cross-Down Signal
DIS
Walt Disney Company (The)
27/7/2021
Bearish
179.5
6684
MACD Cross-Down Signal
DIS
Walt Disney Company (The)
28/7/2021
Bearish
179.1
5927
MACD Cross-Down Signal
DIS
Walt Disney Company (The)
30/7/2021
Bearish
176.02
6810
MACD Cross-Down Signal
EBAY
eBay Inc.
27/7/2021
Bearish
72.29
8159
MACD Cross-Down Signal
EBAY
eBay Inc.
30/7/2021
Bearish
68.21
11992
MACD Cross-Down Signal
GILD
Gilead Sciences, Inc.
30/7/2021
Bearish
68.29
9620
MACD-H -ve Divergence
MGM
MGM Resorts International
30/7/2021
Bearish
37.53
6634
MACD Cross-Down Signal
NEE
NextEra Energy, Inc.
26/7/2021
Bearish
76.91
6014
MACD-H -ve Divergence
NEE
NextEra Energy, Inc.
27/7/2021
Bearish
77.86
7592
MACD-H -ve Divergence
NEE
NextEra Energy, Inc.
30/7/2021
Bearish
77.9
5489
MACD-H -ve Divergence
NI
NiSource, Inc
30/7/2021
Bearish
24.77
10274
MACD Cross-Down Signal
NWL
Newell Brands Inc.
30/7/2021
Bearish
24.75
9563
MACD Cross-Down Signal
PINS
Pinterest, Inc.
30/7/2021
Bearish
58.9
76388
MACD Cross-Down Signal
PYPL
PayPal Holdings, Inc.
27/7/2021
Bearish
300.48
6938
MACD Cross-Down ZeroLine
PYPL
PayPal Holdings, Inc.
30/7/2021
Bearish
275.53
11686
MACD Cross-Down ZeroLine
ROKU
Roku, Inc.
27/7/2021
Bearish
459.37
10516
MACD Cross-Down Signal
SAVA
Cassava Sciences, Inc.
30/7/2021
Bearish
69.53
25135
MACD Cross-Down Signal
SBUX
Starbucks Corporation
30/7/2021
Bearish
121.43
5712
MACD Cross-Down Signal
SQ
Square, Inc.
26/7/2021
Bearish
261.99
5928
MACD Cross-Down Signal
SQ
Square, Inc.
27/7/2021
Bearish
251.73
7828
MACD Cross-Down Signal
SQ
Square, Inc.
30/7/2021
Bearish
247.26
7548
MACD Cross-Down Signal
UPWK
Upwork Inc.
30/7/2021
Bearish
51.79
7051
MACD-H -ve Divergence
VALE
VALE S.A.
26/7/2021
Bearish
22.54
16926
MACD Cross-Down Signal
VALE
VALE S.A.
28/7/2021
Bearish
22.94
23867
MACD Cross-Down Signal
VALE
VALE S.A.
30/7/2021
Bearish
21.02
41707
MACD Cross-Down Signal
WDAY
Workday, Inc.
27/7/2021
Bearish
230.66
7730
MACD Cross-Down ZeroLine
ZEN
Zendesk, Inc.
30/7/2021
Bearish
130.53
7116
MACD Cross-Down Signal
202108 2 to 6 US Stock Five-day MACD Signals
Moses Stock Scan
Free Power US Stock MACD Scan Signals AmiBroker Academy.com
Disclaimer: The above result is for illustration purpose. It is not meant to be used for buy or sell decision. We do not recommend any particular stocks on our website. If particular stocks of such are mentioned, they are meant as illustration or demonstration of Amibroker as a powerful charting software or MACD scanner. Amibroker can program to scan the stocks that have MACD buy or sell signals.
These are script generated signals. Not all scan results are shown here. The MACD signal should use with price action and confirmation. Users must understand what MACD and price action are all about before using them. If necessary you should attend a course to learn more about Technical Analysis (TA) and Moving Average Convergence Divergence, MACD.
Once again, the website does not guarantee any results or investment return based on the information and instruction you have read here. It should be used as learning aids only and if you decide to trade real money, all trading decision should be your own, and you should take your own responsibility.
To identify any stock will move in near eight thousand stocks will take a lot of time. But, when you use script like AmiBroker AFL Script, it will only take less than fifteen minutes.
Welcome!
Welcome to AmiBroker Academy. Thanks for visiting the site.
Moving Average Convergence Divergence, MACD Screener
MACD was developed by Gerald Appel in the late seventies.
MACD stands for Moving Average Convergence Divergence, the MACD line (red line or called fast line) and MACD signal line (blue line, or called slow line).
MACD Bullish Signal Line Cross: MACD bullish signal when red line crosses above the blue line or MACD line crosses above zero line.
MACD Bearish Signal Line Cross: MACD bearish signal when blue line crosses below red line or MACD line crosses below zero line.
MACD Scan
These are stocks picked for today.
Some of July 26 to 30, 2021 AmiBroker AFL Script Generated Five-day US Stock MACD Signals
Ticker
Company
Date
Trend
Close
Vol.(K)
Screening Result
ATVI
Activision Blizzard, Inc
30/7/2021
Bullish
83.62
7055
MACD-H +ve Divergence
COG
Cabot Oil & Gas Corporation
30/7/2021
Bullish
16
8178
MACD Cross-Up Signal
FLEX
Flex Ltd.
30/7/2021
Bullish
17.97
7500
MACD Cross-Up ZeroLine
FTV
Fortive Corporation
30/7/2021
Bullish
72.66
5505
MACD Cross-Up Signal
GSK
GlaxoSmithKline PLC
29/7/2021
Bullish
40.1
5389
MACD Cross-Up ZeroLine
HBI
Hanesbrands Inc.
30/7/2021
Bullish
18.26
8430
MACD Cross-Up ZeroLine
JNPR
Juniper Networks, Inc.
28/7/2021
Bullish
26.98
9859
MACD Cross-Up Signal
JNPR
Juniper Networks, Inc.
29/7/2021
Bullish
27.41
5310
MACD Cross-Up Signal
KIM
Kimco Realty Corporation
26/7/2021
Bullish
20.82
5351
MACD Cross-Up ZeroLine
KIM
Kimco Realty Corporation
30/7/2021
Bullish
21.33
6758
MACD Cross-Up ZeroLine
M
Macy’s Inc
30/7/2021
Bullish
17
16515
MACD Cross-Up Signal
PG
Procter & Gamble Company (The)
28/7/2021
Bullish
138.76
8520
MACD Cross-Up Signal
PG
Procter & Gamble Company (The)
30/7/2021
Bullish
142.23
14394
MACD Cross-Up Signal
TEAM
Atlassian Corporation Plc
30/7/2021
Bullish
325.12
6133
MACD Cross-Up Signal
TIGR
UP Fintech Holding Limited
28/7/2021
Bullish
17.06
12206
MACD Cross-Up Signal
TIGR
UP Fintech Holding Limited
30/7/2021
Bullish
15.95
6439
MACD Cross-Up Signal
AAL
American Airlines Group, Inc.
27/7/2021
Bearish
21.46
30301
MACD Cross-Down ZeroLine
AAL
American Airlines Group, Inc.
30/7/2021
Bearish
20.38
31202
MACD Cross-Down ZeroLine
ABBV
AbbVie Inc.
30/7/2021
Bearish
116.3
9016
MACD-H -ve Divergence
AMZN
Amazon.com, Inc.
30/7/2021
Bearish
3327.59
9957
MACD Cross-Down ZeroLine
CL
Colgate-Palmolive Company
26/7/2021
Bearish
84.09
5948
MACD Cross-Down Signal
CL
Colgate-Palmolive Company
30/7/2021
Bearish
79.5
9513
MACD Cross-Down Signal
DIS
Walt Disney Company (The)
27/7/2021
Bearish
179.5
6684
MACD Cross-Down Signal
DIS
Walt Disney Company (The)
28/7/2021
Bearish
179.1
5927
MACD Cross-Down Signal
DIS
Walt Disney Company (The)
30/7/2021
Bearish
176.02
6810
MACD Cross-Down Signal
EBAY
eBay Inc.
27/7/2021
Bearish
72.29
8159
MACD Cross-Down Signal
EBAY
eBay Inc.
30/7/2021
Bearish
68.21
11992
MACD Cross-Down Signal
GILD
Gilead Sciences, Inc.
30/7/2021
Bearish
68.29
9620
MACD-H -ve Divergence
MGM
MGM Resorts International
30/7/2021
Bearish
37.53
6634
MACD Cross-Down Signal
NEE
NextEra Energy, Inc.
26/7/2021
Bearish
76.91
6014
MACD-H -ve Divergence
NEE
NextEra Energy, Inc.
27/7/2021
Bearish
77.86
7592
MACD-H -ve Divergence
NEE
NextEra Energy, Inc.
30/7/2021
Bearish
77.9
5489
MACD-H -ve Divergence
NI
NiSource, Inc
30/7/2021
Bearish
24.77
10274
MACD Cross-Down Signal
NWL
Newell Brands Inc.
30/7/2021
Bearish
24.75
9563
MACD Cross-Down Signal
PINS
Pinterest, Inc.
30/7/2021
Bearish
58.9
76388
MACD Cross-Down Signal
PYPL
PayPal Holdings, Inc.
27/7/2021
Bearish
300.48
6938
MACD Cross-Down ZeroLine
PYPL
PayPal Holdings, Inc.
30/7/2021
Bearish
275.53
11686
MACD Cross-Down ZeroLine
ROKU
Roku, Inc.
27/7/2021
Bearish
459.37
10516
MACD Cross-Down Signal
SAVA
Cassava Sciences, Inc.
30/7/2021
Bearish
69.53
25135
MACD Cross-Down Signal
SBUX
Starbucks Corporation
30/7/2021
Bearish
121.43
5712
MACD Cross-Down Signal
SQ
Square, Inc.
26/7/2021
Bearish
261.99
5928
MACD Cross-Down Signal
SQ
Square, Inc.
27/7/2021
Bearish
251.73
7828
MACD Cross-Down Signal
SQ
Square, Inc.
30/7/2021
Bearish
247.26
7548
MACD Cross-Down Signal
UPWK
Upwork Inc.
30/7/2021
Bearish
51.79
7051
MACD-H -ve Divergence
VALE
VALE S.A.
26/7/2021
Bearish
22.54
16926
MACD Cross-Down Signal
VALE
VALE S.A.
28/7/2021
Bearish
22.94
23867
MACD Cross-Down Signal
VALE
VALE S.A.
30/7/2021
Bearish
21.02
41707
MACD Cross-Down Signal
WDAY
Workday, Inc.
27/7/2021
Bearish
230.66
7730
MACD Cross-Down ZeroLine
ZEN
Zendesk, Inc.
30/7/2021
Bearish
130.53
7116
MACD Cross-Down Signal
2021 726 to 730 US Stock Five-day MACD Signals
Moses Stock Scan
Free Power US Stock MACD Scan Signals AmiBroker Academy.com
Disclaimer: The above result is for illustration purpose. It is not meant to be used for buy or sell decision. We do not recommend any particular stocks on our website. If particular stocks of such are mentioned, they are meant as illustration or demonstration of Amibroker as a powerful charting software or MACD scanner. Amibroker can program to scan the stocks that have MACD buy or sell signals.
These are script generated signals. Not all scan results are shown here. The MACD signal should use with price action and confirmation. Users must understand what MACD and price action are all about before using them. If necessary you should attend a course to learn more about Technical Analysis (TA) and Moving Average Convergence Divergence, MACD.
Once again, the website does not guarantee any results or investment return based on the information and instruction you have read here. It should be used as learning aids only and if you decide to trade real money, all trading decision should be your own, and you should take your own responsibility.
To identify any stock will move in near eight thousand stocks will take a lot of time. But, when you use script like AmiBroker AFL Script, it will only take less than fifteen minutes.
Welcome to AmiBroker Academy. Thanks for visiting the site.
Moving Average Convergence Divergence, MACD Screener
MACD was developed by Gerald Appel in the late seventies.
MACD stands for Moving Average Convergence Divergence, the MACD line (red line or called fast line) and MACD signal line (blue line, or called slow line).
MACD Bullish Signal Line Cross: MACD bullish signal when red line crosses above the blue line or MACD line crosses above zero line.
MACD Bearish Signal Line Cross: MACD bearish signal when blue line crosses below red line or MACD line crosses below zero line.
MACD Scan
These are stocks picked for today.
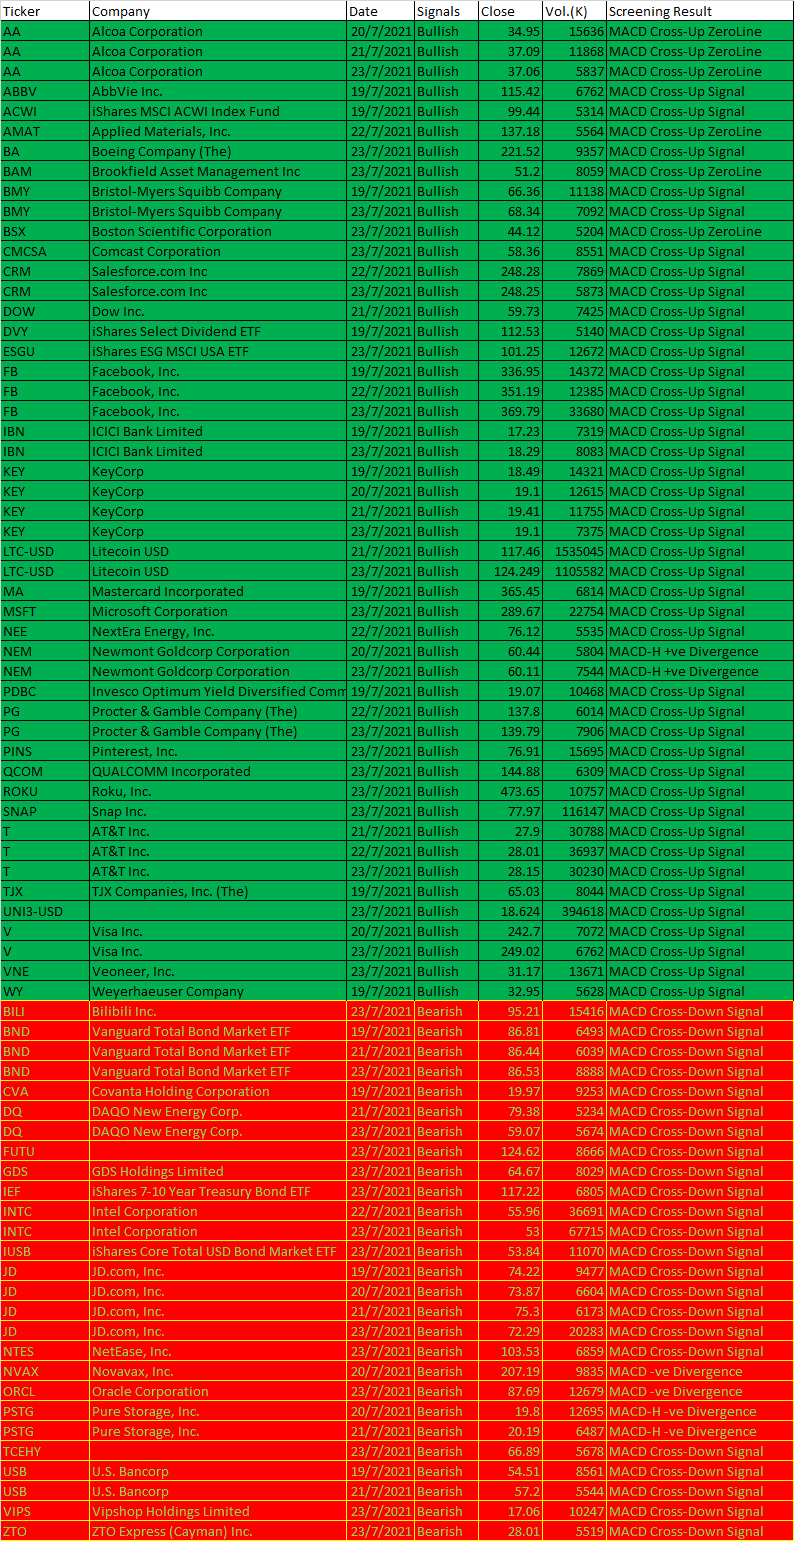
Some of July 19 to 23, 2021 AmiBroker AFL Script Generated Five-day US Stock MACD Signals
Ticker
Company
Date
Signals
Close
Vol.(K)
Screening Result
AA
Alcoa Corporation
20/7/2021
Bullish
34.95
15636
MACD Cross-Up ZeroLine
AA
Alcoa Corporation
21/7/2021
Bullish
37.09
11868
MACD Cross-Up ZeroLine
AA
Alcoa Corporation
23/7/2021
Bullish
37.06
5837
MACD Cross-Up ZeroLine
ABBV
AbbVie Inc.
19/7/2021
Bullish
115.42
6762
MACD Cross-Up Signal
ACWI
iShares MSCI ACWI Index Fund
19/7/2021
Bullish
99.44
5314
MACD Cross-Up Signal
AMAT
Applied Materials, Inc.
22/7/2021
Bullish
137.18
5564
MACD Cross-Up ZeroLine
BA
Boeing Company (The)
23/7/2021
Bullish
221.52
9357
MACD Cross-Up Signal
BAM
Brookfield Asset Management Inc
23/7/2021
Bullish
51.2
8059
MACD Cross-Up ZeroLine
BMY
Bristol-Myers Squibb Company
19/7/2021
Bullish
66.36
11138
MACD Cross-Up Signal
BMY
Bristol-Myers Squibb Company
23/7/2021
Bullish
68.34
7092
MACD Cross-Up Signal
BSX
Boston Scientific Corporation
23/7/2021
Bullish
44.12
5204
MACD Cross-Up ZeroLine
CMCSA
Comcast Corporation
23/7/2021
Bullish
58.36
8551
MACD Cross-Up Signal
CRM
Salesforce.com Inc
22/7/2021
Bullish
248.28
7869
MACD Cross-Up Signal
CRM
Salesforce.com Inc
23/7/2021
Bullish
248.25
5873
MACD Cross-Up Signal
DOW
Dow Inc.
21/7/2021
Bullish
59.73
7425
MACD Cross-Up Signal
DVY
iShares Select Dividend ETF
19/7/2021
Bullish
112.53
5140
MACD Cross-Up Signal
ESGU
iShares ESG MSCI USA ETF
23/7/2021
Bullish
101.25
12672
MACD Cross-Up Signal
FB
Facebook, Inc.
19/7/2021
Bullish
336.95
14372
MACD Cross-Up Signal
FB
Facebook, Inc.
22/7/2021
Bullish
351.19
12385
MACD Cross-Up Signal
FB
Facebook, Inc.
23/7/2021
Bullish
369.79
33680
MACD Cross-Up Signal
IBN
ICICI Bank Limited
19/7/2021
Bullish
17.23
7319
MACD Cross-Up Signal
IBN
ICICI Bank Limited
23/7/2021
Bullish
18.29
8083
MACD Cross-Up Signal
KEY
KeyCorp
19/7/2021
Bullish
18.49
14321
MACD Cross-Up Signal
KEY
KeyCorp
20/7/2021
Bullish
19.1
12615
MACD Cross-Up Signal
KEY
KeyCorp
21/7/2021
Bullish
19.41
11755
MACD Cross-Up Signal
KEY
KeyCorp
23/7/2021
Bullish
19.1
7375
MACD Cross-Up Signal
LTC-USD
Litecoin USD
21/7/2021
Bullish
117.46
1535045
MACD Cross-Up Signal
LTC-USD
Litecoin USD
23/7/2021
Bullish
124.249
1105582
MACD Cross-Up Signal
MA
Mastercard Incorporated
19/7/2021
Bullish
365.45
6814
MACD Cross-Up Signal
MSFT
Microsoft Corporation
23/7/2021
Bullish
289.67
22754
MACD Cross-Up Signal
NEE
NextEra Energy, Inc.
22/7/2021
Bullish
76.12
5535
MACD Cross-Up Signal
NEM
Newmont Goldcorp Corporation
20/7/2021
Bullish
60.44
5804
MACD-H +ve Divergence
NEM
Newmont Goldcorp Corporation
23/7/2021
Bullish
60.11
7544
MACD-H +ve Divergence
PDBC
Invesco Optimum Yield Diversified Commodity Strategy No K-1 ET
19/7/2021
Bullish
19.07
10468
MACD Cross-Up Signal
PG
Procter & Gamble Company (The)
22/7/2021
Bullish
137.8
6014
MACD Cross-Up Signal
PG
Procter & Gamble Company (The)
23/7/2021
Bullish
139.79
7906
MACD Cross-Up Signal
PINS
Pinterest, Inc.
23/7/2021
Bullish
76.91
15695
MACD Cross-Up Signal
QCOM
QUALCOMM Incorporated
23/7/2021
Bullish
144.88
6309
MACD Cross-Up Signal
ROKU
Roku, Inc.
23/7/2021
Bullish
473.65
10757
MACD Cross-Up Signal
SNAP
Snap Inc.
23/7/2021
Bullish
77.97
116147
MACD Cross-Up Signal
T
AT&T Inc.
21/7/2021
Bullish
27.9
30788
MACD Cross-Up Signal
T
AT&T Inc.
22/7/2021
Bullish
28.01
36937
MACD Cross-Up Signal
T
AT&T Inc.
23/7/2021
Bullish
28.15
30230
MACD Cross-Up Signal
TJX
TJX Companies, Inc. (The)
19/7/2021
Bullish
65.03
8044
MACD Cross-Up Signal
UNI3-USD
23/7/2021
Bullish
18.624
394618
MACD Cross-Up Signal
V
Visa Inc.
20/7/2021
Bullish
242.7
7072
MACD Cross-Up Signal
V
Visa Inc.
23/7/2021
Bullish
249.02
6762
MACD Cross-Up Signal
VNE
Veoneer, Inc.
23/7/2021
Bullish
31.17
13671
MACD Cross-Up Signal
WY
Weyerhaeuser Company
19/7/2021
Bullish
32.95
5628
MACD Cross-Up Signal
BILI
Bilibili Inc.
23/7/2021
Bearish
95.21
15416
MACD Cross-Down Signal
BND
Vanguard Total Bond Market ETF
19/7/2021
Bearish
86.81
6493
MACD Cross-Down Signal
BND
Vanguard Total Bond Market ETF
21/7/2021
Bearish
86.44
6039
MACD Cross-Down Signal
BND
Vanguard Total Bond Market ETF
23/7/2021
Bearish
86.53
8888
MACD Cross-Down Signal
CVA
Covanta Holding Corporation
19/7/2021
Bearish
19.97
9253
MACD Cross-Down Signal
DQ
DAQO New Energy Corp.
21/7/2021
Bearish
79.38
5234
MACD Cross-Down Signal
DQ
DAQO New Energy Corp.
23/7/2021
Bearish
59.07
5674
MACD Cross-Down Signal
FUTU
23/7/2021
Bearish
124.62
8666
MACD Cross-Down Signal
GDS
GDS Holdings Limited
23/7/2021
Bearish
64.67
8029
MACD Cross-Down Signal
IEF
iShares 7-10 Year Treasury Bond ETF
23/7/2021
Bearish
117.22
6805
MACD Cross-Down Signal
INTC
Intel Corporation
22/7/2021
Bearish
55.96
36691
MACD Cross-Down Signal
INTC
Intel Corporation
23/7/2021
Bearish
53
67715
MACD Cross-Down Signal
IUSB
iShares Core Total USD Bond Market ETF
23/7/2021
Bearish
53.84
11070
MACD Cross-Down Signal
JD
JD.com, Inc.
19/7/2021
Bearish
74.22
9477
MACD Cross-Down Signal
JD
JD.com, Inc.
20/7/2021
Bearish
73.87
6604
MACD Cross-Down Signal
JD
JD.com, Inc.
21/7/2021
Bearish
75.3
6173
MACD Cross-Down Signal
JD
JD.com, Inc.
23/7/2021
Bearish
72.29
20283
MACD Cross-Down Signal
NTES
NetEase, Inc.
23/7/2021
Bearish
103.53
6859
MACD Cross-Down Signal
NVAX
Novavax, Inc.
20/7/2021
Bearish
207.19
9835
MACD -ve Divergence
ORCL
Oracle Corporation
23/7/2021
Bearish
87.69
12679
MACD -ve Divergence
PSTG
Pure Storage, Inc.
20/7/2021
Bearish
19.8
12695
MACD-H -ve Divergence
PSTG
Pure Storage, Inc.
21/7/2021
Bearish
20.19
6487
MACD-H -ve Divergence
TCEHY
23/7/2021
Bearish
66.89
5678
MACD Cross-Down Signal
USB
U.S. Bancorp
19/7/2021
Bearish
54.51
8561
MACD Cross-Down Signal
USB
U.S. Bancorp
21/7/2021
Bearish
57.2
5544
MACD Cross-Down Signal
VIPS
Vipshop Holdings Limited
23/7/2021
Bearish
17.06
10247
MACD Cross-Down Signal
ZTO
ZTO Express (Cayman) Inc.
23/7/2021
Bearish
28.01
5519
MACD Cross-Down Signal
2021 July 19 to 23 US Stock Five-day MACD Signals
Moses Stock Scan
Free Power US Stock MACD Scan Signals AmiBroker Academy.com
Disclaimer: The above result is for illustration purpose. It is not meant to be used for buy or sell decision. We do not recommend any particular stocks on our website. If particular stocks of such are mentioned, they are meant as illustration or demonstration of Amibroker as a powerful charting software or MACD scanner. Amibroker can program to scan the stocks that have MACD buy or sell signals.
These are script generated signals. Not all scan results are shown here. The MACD signal should use with price action and confirmation. Users must understand what MACD and price action are all about before using them. If necessary you should attend a course to learn more about Technical Analysis (TA) and Moving Average Convergence Divergence, MACD.
Once again, the website does not guarantee any results or investment return based on the information and instruction you have read here. It should be used as learning aids only and if you decide to trade real money, all trading decision should be your own, and you should take your own responsibility.
Welcome to AmiBroker Academy. Thanks for visiting the site.
Moving Average Convergence Divergence, MACD Screener
MACD was developed by Gerald Appel in the late seventies.
MACD stands for Moving Average Convergence Divergence, the MACD line (red line or called fast line) and MACD signal line (blue line, or called slow line).
MACD Bullish Signal Line Cross: MACD bullish signal when red line crosses above the blue line or MACD line crosses above zero line.
MACD Bearish Signal Line Cross: MACD bearish signal when blue line crosses below red line or MACD line crosses below zero line.
MACD Scan
These are stocks picked for today.
Some of July 12 to 16, 2021 AmiBroker AFL Script Generated Five-day US Stock MACD Signals
Tickets
Company
Date
Trend
Close
Vol.(K)
Screening Result
FE
FirstEnergy Corp.
16/7/2021
Bullish
37.79
5491
MACD Cross-Up Signal
BK
Bank Of New York Mellon Corporation (The)
16/7/2021
Bullish
49.38
8166
MACD-H +ve Divergence
BABA
Alibaba Group Holding Limited
13/7/2021
Bullish
209.51
17362
MACD Cross-Up Signal
BABA
Alibaba Group Holding Limited
16/7/2021
Bullish
212.1
11140
MACD Cross-Up Signal
X
United States Steel Corporation
16/7/2021
Bearish
21.89
19439
MACD Cross-Down Signal
WBT
Welbilt, Inc.
13/7/2021
Bearish
23.26
11646
MACD Cross-Down ZeroLine
VNQI
Vanguard Global ex-U.S. Real Estate ETF
16/7/2021
Bearish
58.61
6453
MACD Cross-Down Signal
VALE
VALE S.A.
12/7/2021
Bearish
22.32
16921
MACD Cross-Down Signal
VALE
VALE S.A.
15/7/2021
Bearish
22.54
17296
MACD Cross-Down Signal
VALE
VALE S.A.
16/7/2021
Bearish
22.07
22619
MACD Cross-Down Signal
TJX
TJX Companies, Inc. (The)
16/7/2021
Bearish
67.41
7819
MACD Cross-Down Signal
SCZ
iShares MSCI EAFE Small-Cap ETF
16/7/2021
Bearish
73.7
7035
MACD Cross-Down Signal
NFLX
Netflix, Inc.
15/7/2021
Bearish
542.95
5714
MACD Cross-Down Signal
LTC-USD
Litecoin USD
16/7/2021
Bearish
121.041
1434977
MACD Cross-Down Signal
LB
L Brands, Inc.
16/7/2021
Bearish
72.75
12657
MACD Cross-Down Signal
LB
L Brands, Inc.
12/7/2021
Bearish
76.56
5079
MACD Cross-Down Signal
INTC
Intel Corporation
12/7/2021
Bearish
56.73
15393
MACD Cross-Down Signal
INTC
Intel Corporation
16/7/2021
Bearish
54.97
25252
MACD Cross-Down Signal
FHN
First Horizon National Corporation
16/7/2021
Bearish
15.56
10617
MACD Cross-Down Signal
FHN
First Horizon National Corporation
15/7/2021
Bearish
16.47
6018
MACD Cross-Down Signal
FHN
First Horizon National Corporation
14/7/2021
Bearish
16.36
7080
MACD Cross-Down Signal
FHN
First Horizon National Corporation
12/7/2021
Bearish
16.92
5132
MACD Cross-Down Signal
DOW
Dow Inc.
16/7/2021
Bearish
60.01
6959
MACD Cross-Down Signal
CRM
Salesforce.com Inc
16/7/2021
Bearish
238.43
7287
MACD Cross-Down ZeroLine
COG
Cabot Oil & Gas Corporation
16/7/2021
Bearish
16.16
5678
MACD Cross-Down ZeroLine
COG
Cabot Oil & Gas Corporation
14/7/2021
Bearish
16.81
6985
MACD Cross-Down ZeroLine
CLF
Cleveland-Cliffs Inc.
12/7/2021
Bearish
23.08
24875
MACD Cross-Down ZeroLine
CLF
Cleveland-Cliffs Inc.
16/7/2021
Bearish
19.93
31936
MACD Cross-Down ZeroLine
CLF
Cleveland-Cliffs Inc.
15/7/2021
Bearish
21.62
14348
MACD Cross-Down ZeroLine
BNB-USD
BinanceCoin USD
16/7/2021
Bearish
302.986
1688212
MACD Cross-Down ZeroLine
AZN
Astrazeneca PLC
16/7/2021
Bearish
56.79
28642
MACD Cross-Down ZeroLine
AAL
American Airlines Group, Inc.
16/7/2021
Bearish
19.79
34421
MACD Cross-Down Signal
AAL
American Airlines Group, Inc.
15/7/2021
Bearish
20.46
34188
MACD Cross-Down Signal
202107 12 to 16 US Stock Five-day MACD Signals
Moses Stock Scan
Free Power US Stock MACD Scan Signals AmiBroker Academy.com
Disclaimer: The above result is for illustration purpose. It is not meant to be used for buy or sell decision. We do not recommend any particular stocks on our website. If particular stocks of such are mentioned, they are meant as illustration or demonstration of Amibroker as a powerful charting software or MACD scanner. Amibroker can program to scan the stocks that have MACD buy or sell signals.
These are script generated signals. Not all scan results are shown here. The MACD signal should use with price action and confirmation. Users must understand what MACD and price action are all about before using them. If necessary you should attend a course to learn more about Technical Analysis (TA) and Moving Average Convergence Divergence, MACD.
Once again, the website does not guarantee any results or investment return based on the information and instruction you have read here. It should be used as learning aids only and if you decide to trade real money, all trading decision should be your own, and you should take your own responsibility.
Welcome to AmiBroker Academy. Thanks for visiting the site.
Moving Average Convergence Divergence, MACD Screener
MACD was developed by Gerald Appel in the late seventies.
MACD stands for Moving Average Convergence Divergence, the MACD line (red line or called fast line) and MACD signal line (blue line, or called slow line).
MACD Bullish Signal Line Cross: MACD bullish signal when red line crosses above the blue line or MACD line crosses above zero line.
MACD Bearish Signal Line Cross: MACD bearish signal when blue line crosses below red line or MACD line crosses below zero line.
MACD Scan
These are stocks picked for today.
Some of July 5 to 9, 2021 AmiBroker AFL Script Generated Five-day US Stock MACD Signals
Ticker
Company
Date
Trend
Close
Vol.(K)
Screening Result
AGNC
AGNC Investment Corp.
9/7/2021
Bullish
16.89
6178
MACD Cross-Up Signal
BK
Bank Of New York Mellon Corporation (The)
6/7/2021
Bullish
49.49
6179
MACD-H +ve Divergence
C
Citigroup Inc.
9/7/2021
Bullish
68.45
18866
MACD +ve Divergence
CNP
CenterPoint Energy, Inc.
7/7/2021
Bullish
25.01
5930
MACD Cross-Up ZeroLine
CNP
CenterPoint Energy, Inc.
9/7/2021
Bullish
25.47
9652
MACD Cross-Up ZeroLine
CSCO
Cisco Systems, Inc.
9/7/2021
Bullish
53.74
14673
MACD Cross-Up Signal
CSX
CSX Corporation
9/7/2021
Bullish
31.83
15171
MACD Cross-Up Signal
CVX
Chevron Corporation
9/7/2021
Bullish
104.07
8565
MACD-H +ve Divergence
DAL
Delta Air Lines, Inc.
9/7/2021
Bullish
42.92
7692
MACD +ve Divergence
DOW
Dow Inc.
9/7/2021
Bullish
63.08
5063
MACD Cross-Up Signal
EPD
Enterprise Products Partners L.P.
6/7/2021
Bullish
24.47
5543
MACD Cross-Up ZeroLine
EPD
Enterprise Products Partners L.P.
8/7/2021
Bullish
24.09
5495
MACD Cross-Up ZeroLine
EQH
AXA Equitable Holdings, Inc.
8/7/2021
Bullish
28.42
5686
MACD-H +ve Divergence
FCX
Freeport-McMoran, Inc.
6/7/2021
Bullish
36
18993
MACD-H +ve Divergence
FCX
Freeport-McMoran, Inc.
9/7/2021
Bullish
36.5
18012
MACD-H +ve Divergence
FLR
Fluor Corporation
9/7/2021
Bullish
17.21
6731
MACD-H +ve Divergence
GPS
Gap, Inc. (The)
9/7/2021
Bullish
32.34
5007
MACD-H +ve Divergence
HBI
Hanesbrands Inc.
6/7/2021
Bullish
17.83
5215
MACD-H +ve Divergence
IBN
ICICI Bank Limited
7/7/2021
Bullish
17.6
5392
MACD Cross-Up Signal
IBN
ICICI Bank Limited
8/7/2021
Bullish
17.14
6232
MACD Cross-Up Signal
INTC
Intel Corporation
7/7/2021
Bullish
55.96
14857
MACD-H +ve Divergence
INTC
Intel Corporation
9/7/2021
Bullish
55.99
18704
MACD-H +ve Divergence
JBLU
JetBlue Airways Corporation
6/7/2021
Bullish
16.57
7898
MACD-H +ve Divergence
JBLU
JetBlue Airways Corporation
9/7/2021
Bullish
16.47
6177
MACD-H +ve Divergence
JPM
J P Morgan Chase & Co
8/7/2021
Bullish
150.94
17835
MACD-H +ve Divergence
JPM
J P Morgan Chase & Co
9/7/2021
Bullish
155.77
13679
MACD-H +ve Divergence
KMI
Kinder Morgan, Inc.
8/7/2021
Bullish
18.17
11701
MACD Cross-Up Signal
KMI
Kinder Morgan, Inc.
9/7/2021
Bullish
18.67
11695
MACD Cross-Up Signal
KO
Coca-Cola Company (The)
9/7/2021
Bullish
54.46
10846
MACD Cross-Up Signal
LVS
Las Vegas Sands Corp.
7/7/2021
Bullish
50.85
5005
MACD-H +ve Divergence
LUV
Southwest Airlines Company
9/7/2021
Bullish
52.84
6738
MACD Cross-Up Signal
MET
MetLife, Inc.
6/7/2021
Bullish
58.9
9096
MACD +ve Divergence
MET
MetLife, Inc.
9/7/2021
Bullish
58.86
6522
MACD +ve Divergence
MO
Altria Group
6/7/2021
Bullish
46.67
7767
MACD-H +ve Divergence
MO
Altria Group
9/7/2021
Bullish
47.4
10041
MACD-H +ve Divergence
PFE
Pfizer, Inc.
8/7/2021
Bullish
39.25
23021
MACD Cross-Up Signal
PFE
Pfizer, Inc.
9/7/2021
Bullish
39.61
21571
MACD Cross-Up Signal
RF
Regions Financial Corporation
7/7/2021
Bullish
19.43
6789
MACD-H +ve Divergence
RF
Regions Financial Corporation
9/7/2021
Bullish
19.87
8325
MACD-H +ve Divergence
TSM
Taiwan Semiconductor Manufacturing Company Ltd.
8/7/2021
Bullish
117.87
7565
MACD Cross-Up Signal
TSM
Taiwan Semiconductor Manufacturing Company Ltd.
9/7/2021
Bullish
120.56
8362
MACD Cross-Up Signal
UA
Under Armour, Inc.
8/7/2021
Bullish
18.08
5461
MACD Cross-Up Signal
UAL
United Continental Holdings, Inc.
9/7/2021
Bullish
51.1
9884
MACD +ve Divergence
USB
U.S. Bancorp
7/7/2021
Bullish
55.99
5126
MACD-H +ve Divergence
VST
Vistra Energy Corp.
6/7/2021
Bullish
18.34
5254
MACD Cross-Up Signal
VST
Vistra Energy Corp.
7/7/2021
Bullish
19.39
9637
MACD Cross-Up Signal
VST
Vistra Energy Corp.
8/7/2021
Bullish
18.75
6708
MACD Cross-Up Signal
WFC
Wells Fargo & Company
6/7/2021
Bullish
43.49
25487
MACD-H +ve Divergence
WFC
Wells Fargo & Company
9/7/2021
Bullish
43.91
25047
MACD-H +ve Divergence
X
United States Steel Corporation
9/7/2021
Bullish
24.54
23629
MACD Cross-Up Signal
BND
Vanguard Total Bond Market ETF
9/7/2021
Bearish
86.2
10305
MACD-H -ve Divergence
ETH-USD
Ethereum USD
6/7/2021
Bearish
2324.679
20891860
MACD Cross-Down ZeroLine
ETH-USD
Ethereum USD
9/7/2021
Bearish
2146.692
23029574
MACD Cross-Down ZeroLine
SAVA
Cassava Sciences, Inc.
9/7/2021
Bearish
95.34
7244
MACD-H -ve Divergence
T
AT&T Inc.
9/7/2021
Bearish
28.45
34140
MACD Cross-Down Signal
V
Visa Inc.
6/7/2021
Bearish
239.6
8049
MACD Cross-Down Signal
V
Visa Inc.
8/7/2021
Bearish
236.61
6388
MACD Cross-Down Signal
V
Visa Inc.
9/7/2021
Bearish
238.47
5616
MACD Cross-Down Signal
2021 705 to 709 US Stock Five-day MACD Signals
Moses Stock Scan
Free Power US Stock MACD Scan Signals AmiBroker Academy.com
Disclaimer: The above result is for illustration purpose. It is not meant to be used for buy or sell decision. We do not recommend any particular stocks on our website. If particular stocks of such are mentioned, they are meant as illustration or demonstration of Amibroker as a powerful charting software or MACD scanner. Amibroker can program to scan the stocks that have MACD buy or sell signals.
These are script generated signals. Not all scan results are shown here. The MACD signal should use with price action and confirmation. Users must understand what MACD and price action are all about before using them. If necessary you should attend a course to learn more about Technical Analysis (TA) and Moving Average Convergence Divergence, MACD.
Once again, the website does not guarantee any results or investment return based on the information and instruction you have read here. It should be used as learning aids only and if you decide to trade real money, all trading decision should be your own, and you should take your own responsibility.
Welcome to AmiBroker Academy. Thanks for visiting the site.
Moving Average Convergence Divergence, MACD Screener
MACD was developed by Gerald Appel in the late seventies.
MACD stands for Moving Average Convergence Divergence, the MACD line (red line or called fast line) and MACD signal line (blue line, or called slow line).
MACD Bullish Signal Line Cross: MACD bullish signal when red line crosses above the blue line or MACD line crosses above zero line.
MACD Bearish Signal Line Cross: MACD bearish signal when blue line crosses below red line or MACD line crosses below zero line.
MACD Scan
These are stocks picked for today.
Some of 28 June to July 2, 2021 AmiBroker AFL Script Generated Five-day US Stock MACD Signals
Ticker
Company
Date
Trend
Close
Vol.(K)
Screening Result
ABBV
AbbVie Inc.
28/6/2021
Bullish
113
5142
MACD Cross-Up Signal
ABBV
AbbVie Inc.
2/7/2021
Bullish
115.17
5720
MACD Cross-Up Signal
BND
Vanguard Total Bond Market ETF
29/6/2021
Bullish
85.83
10673
MACD Cross-Up Signal
BND
Vanguard Total Bond Market ETF
1/7/2021
Bullish
85.75
5768
MACD Cross-Up Signal
COP
ConocoPhillips
2/7/2021
Bullish
62.75
7635
MACD Cross-Up Signal
ENB
Enbridge Inc
28/6/2021
Bullish
39.84
5008
MACD Cross-Up Signal
EPD
Enterprise Products Partners L.P.
28/6/2021
Bullish
23.61
7966
MACD Cross-Up ZeroLine
FCX
Freeport-McMoran, Inc.
2/7/2021
Bullish
37.14
10222
MACD Cross-Up Signal
HAL
Halliburton Company
29/6/2021
Bullish
22.67
6486
MACD Cross-Up ZeroLine
HAL
Halliburton Company
2/7/2021
Bullish
23.78
5886
MACD Cross-Up ZeroLine
IEF
iShares 7-10 Year Treasury Bond ETF
2/7/2021
Bullish
115.75
5072
MACD Cross-Up Signal
INTC
Intel Corporation
28/6/2021
Bullish
57.48
22481
MACD Cross-Up Signal
INTC
Intel Corporation
1/7/2021
Bullish
56.01
24872
MACD Cross-Up Signal
INTC
Intel Corporation
2/7/2021
Bullish
56.76
17219
MACD Cross-Up Signal
JNJ
Johnson & Johnson
2/7/2021
Bullish
168.98
9060
MACD Cross-Up ZeroLine
KMI
Kinder Morgan, Inc.
2/7/2021
Bullish
18.57
7289
MACD Cross-Up Signal
MO
Altria Group
2/7/2021
Bullish
47.53
5515
MACD Cross-Up Signal
ORCL
Oracle Corporation
2/7/2021
Bullish
81.82
15258
MACD Cross-Up Signal
PFE
Pfizer, Inc.
2/7/2021
Bullish
39.73
16593
MACD Cross-Up Signal
PG
Procter & Gamble Company (The)
28/6/2021
Bullish
135.32
6065
MACD Cross-Up ZeroLine
PG
Procter & Gamble Company (The)
2/7/2021
Bullish
135.9
5572
MACD Cross-Up ZeroLine
SC
Santander Consumer USA Holdings Inc.
2/7/2021
Bullish
40.56
6425
MACD Cross-Up Signal
SLV
iShares Silver Trust
2/7/2021
Bullish
24.55
21317
MACD Cross-Up Signal
SQBG
Sequential Brands Group, Inc.
2/7/2021
Bullish
15.7
27994
MACD Cross-Up Signal
VZ
Verizon Communications Inc.
30/6/2021
Bullish
56.03
14560
MACD Cross-Up Signal
VZ
Verizon Communications Inc.
1/7/2021
Bullish
56.29
11672
MACD Cross-Up Signal
VZ
Verizon Communications Inc.
2/7/2021
Bullish
56.44
11387
MACD Cross-Up Signal
AMAT
Applied Materials, Inc.
28/6/2021
Bearish
140.99
6984
MACD Cross-Down Signal
AMAT
Applied Materials, Inc.
1/7/2021
Bearish
137.95
7694
MACD Cross-Down Signal
AMAT
Applied Materials, Inc.
2/7/2021
Bearish
138.16
5300
MACD Cross-Down Signal
APPS
Digital Turbine, Inc.
2/7/2021
Bearish
68.27
11227
MACD Cross-Down Signal
ARWR
Arrowhead Pharmaceuticals, Inc.
2/7/2021
Bearish
63.13
7343
MACD Cross-Down ZeroLine
BTX
BioTime, Inc.
28/6/2021
Bearish
21.35
8962
MACD Cross-Down ZeroLine
JMIA
Jumia Technologies AG
28/6/2021
Bearish
31.58
5797
MACD Cross-Down ZeroLine
KWEB
KraneShares Trust KraneShares CSI China Internet ETF
29/6/2021
Bearish
70.98
7326
MACD Cross-Down Signal
KWEB
KraneShares Trust KraneShares CSI China Internet ETF
2/7/2021
Bearish
66.8
6567
MACD Cross-Down Signal
MRNA
Moderna, Inc.
29/6/2021
Bearish
234.46
11417
MACD -ve Divergence
MRNA
Moderna, Inc.
1/7/2021
Bearish
235.11
5928
MACD -ve Divergence
MRVL
Marvell Technology Group Ltd.
2/7/2021
Bearish
57.42
5437
MACD Cross-Down Signal
PDD
Pinduoduo Inc.
29/6/2021
Bearish
133.55
9967
MACD Cross-Down Signal
PDD
Pinduoduo Inc.
1/7/2021
Bearish
121.84
6314
MACD Cross-Down Signal
PDD
Pinduoduo Inc.
2/7/2021
Bearish
119.2
6579
MACD Cross-Down Signal
RRC
Range Resources Corporation
28/6/2021
Bearish
16.24
6853
MACD-H -ve Divergence
TME
Tencent Music Entertainment Group
28/6/2021
Bearish
15.8
7696
MACD Cross-Down Signal
TME
Tencent Music Entertainment Group
1/7/2021
Bearish
15.47
8579
MACD Cross-Down Signal
TME
Tencent Music Entertainment Group
2/7/2021
Bearish
15.13
6361
MACD Cross-Down Signal
2021 628 to 702 US Stock Five-day MACD Signals
Moses Stock Scan
Free Power US Stock MACD Scan Signals AmiBroker Academy.com
Disclaimer: The above result is for illustration purpose. It is not meant to be used for buy or sell decision. We do not recommend any particular stocks on our website. If particular stocks of such are mentioned, they are meant as illustration or demonstration of Amibroker as a powerful charting software or MACD scanner. Amibroker can program to scan the stocks that have MACD buy or sell signals.
These are script generated signals. Not all scan results are shown here. The MACD signal should use with price action and confirmation. Users must understand what MACD and price action are all about before using them. If necessary you should attend a course to learn more about Technical Analysis (TA) and Moving Average Convergence Divergence, MACD.
Once again, the website does not guarantee any results or investment return based on the information and instruction you have read here. It should be used as learning aids only and if you decide to trade real money, all trading decision should be your own, and you should take your own responsibility.
Welcome to AmiBroker Academy. Thanks for visiting the site.
Power AmiBroker Script
AmiBroker stock charting software has a programmable capability. The screener signals are done by the AmiBroker AFL script. If you are interested in any of the AmiBroker script, you can search WiseTrader Toolbox for a similar one.
Moving Average Convergence Divergence, MACD Screener
MACD was developed by Gerald Appel in the late seventies.
MACD stands for Moving Average Convergence Divergence, the MACD line (red line or called fast line) and MACD signal line (blue line, or called slow line).
MACD Bullish Signal Line Cross: MACD bullish signal when red line crosses above the blue line or MACD line crosses above zero line.
MACD Bearish Signal Line Cross: MACD bearish signal when blue line crosses below red line or MACD line crosses below zero line.
MACD Scan
These are stocks picked for June 28.
Some of 2 July, 2021 AmiBroker AFL Script Generated One-day US Stock MACD Signals
Ticker
Company
Date
Trend
Close
Vol.(K)
Screening Result
ABBV
AbbVie Inc.
2/7/2021
Bullish
115.17
5720
MACD Cross-Up Signal
COP
ConocoPhillips
2/7/2021
Bullish
62.75
7635
MACD Cross-Up Signal
FCX
Freeport-McMoran, Inc.
2/7/2021
Bullish
37.14
10222
MACD Cross-Up Signal
HAL
Halliburton Company
2/7/2021
Bullish
23.78
5886
MACD Cross-Up ZeroLine
IEF
iShares 7-10 Year Treasury Bond ETF
2/7/2021
Bullish
115.75
5072
MACD Cross-Up Signal
INTC
Intel Corporation
2/7/2021
Bullish
56.76
17219
MACD Cross-Up Signal
JNJ
Johnson & Johnson
2/7/2021
Bullish
168.98
9060
MACD Cross-Up ZeroLine
KMI
Kinder Morgan, Inc.
2/7/2021
Bullish
18.57
7289
MACD Cross-Up Signal
MO
Altria Group
2/7/2021
Bullish
47.53
5515
MACD Cross-Up Signal
ORCL
Oracle Corporation
2/7/2021
Bullish
81.82
15258
MACD Cross-Up Signal
PFE
Pfizer, Inc.
2/7/2021
Bullish
39.73
16593
MACD Cross-Up Signal
PG
Procter & Gamble Company (The)
2/7/2021
Bullish
135.9
5572
MACD Cross-Up ZeroLine
SC
Santander Consumer USA Holdings Inc.
2/7/2021
Bullish
40.56
6425
MACD Cross-Up Signal
SLV
iShares Silver Trust
2/7/2021
Bullish
24.55
21317
MACD Cross-Up Signal
SQBG
Sequential Brands Group, Inc.
2/7/2021
Bullish
15.7
27994
MACD Cross-Up Signal
VZ
Verizon Communications Inc.
2/7/2021
Bullish
56.44
11387
MACD Cross-Up Signal
AMAT
Applied Materials, Inc.
2/7/2021
Bearish
138.16
5300
MACD Cross-Down Signal
APPS
Digital Turbine, Inc.
2/7/2021
Bearish
68.27
11227
MACD Cross-Down Signal
ARWR
Arrowhead Pharmaceuticals, Inc.
2/7/2021
Bearish
63.13
7343
MACD Cross-Down ZeroLine
KWEB
KraneShares Trust KraneShares CSI China Internet ETF
2/7/2021
Bearish
66.8
6567
MACD Cross-Down Signal
MRVL
Marvell Technology Group Ltd.
2/7/2021
Bearish
57.42
5437
MACD Cross-Down Signal
PDD
Pinduoduo Inc.
2/7/2021
Bearish
119.2
6579
MACD Cross-Down Signal
TME
Tencent Music Entertainment Group
2/7/2021
Bearish
15.13
6361
MACD Cross-Down Signal
20210702 US Stock One-day MACD Signals
Moses Stock Scan Column
Free Power US Stock MACD Scan Signals AmiBroker Academy.com
Disclaimer: The above result is for illustration purpose. It is not meant to be used for buy or sell decision. We do not recommend any particular stocks on our website. If particular stocks of such are mentioned, they are meant as illustration or demonstration of Amibroker as a powerful charting software or MACD scanner. Amibroker can program to scan the stocks that have MACD buy or sell signals.
These are script generated signals. Not all scan results are shown here. The MACD signal should use with price action and confirmation. Users must understand what MACD and price action are all about before using them. If necessary you should attend a course to learn more about Technical Analysis (TA) and Moving Average Convergence Divergence, MACD.
Once again, the website does not guarantee any results or investment return based on the information and instruction you have read here. It should be used as learning aids only and if you decide to trade real money, all trading decision should be your own, and you should take your own responsibility.
Welcome to AmiBroker Academy. Thanks for visiting the site.
Power AmiBroker Script
AmiBroker stock charting software has a programmable capability. The screener signals are done by the AmiBroker AFL script. If you are interested in any of the AmiBroker script, you can search WiseTrader Toolbox for a similar one.
Moving Average Convergence Divergence, MACD Screener
MACD was developed by Gerald Appel in the late seventies.
MACD stands for Moving Average Convergence Divergence, the MACD line (red line or called fast line) and MACD signal line (blue line, or called slow line).
MACD Bullish Signal Line Cross: MACD bullish signal when red line crosses above the blue line or MACD line crosses above zero line.
MACD Bearish Signal Line Cross: MACD bearish signal when blue line crosses below red line or MACD line crosses below zero line.
MACD Scan
These are stocks picked for June 28.
Some of 1 July, 2021 AmiBroker AFL Script Generated One-day US Stock MACD Signals
Ticker
Company
Date
Signals
Close
Vol.(K)
Screening Result
BBBY
Bed Bath & Beyond Inc.
1/7/2021
Bullish
32.64
12267
MACD Cross-Up Signal
CMCSA
Comcast Corporation
1/7/2021
Bullish
57.75
10034
MACD Cross-Up Signal
COG
Cabot Oil & Gas Corporation
1/7/2021
Bullish
17.85
11944
MACD Cross-Up ZeroLine
DAL
Delta Air Lines, Inc.
1/7/2021
Bullish
44.23
9874
MACD +ve Divergence
DIS
Walt Disney Company (The)
1/7/2021
Bullish
177.26
5887
MACD Cross-Up Signal
ICLR
ICON plc
1/7/2021
Bullish
215.85
6623
MACD-H +ve Divergence
JPM
J P Morgan Chase & Co
1/7/2021
Bullish
157.08
10479
MACD Cross-Up Signal
LVS
Las Vegas Sands Corp.
1/7/2021
Bullish
53.13
5309
MACD Cross-Up Signal
LYFT
Lyft, Inc.
1/7/2021
Bullish
61.87
5423
MACD Cross-Up Signal
MOS
Mosaic Company (The)
1/7/2021
Bullish
31.79
6087
MACD Cross-Up Signal
MPW
Medical Properties Trust, Inc.
1/7/2021
Bullish
20.24
5108
MACD +ve Divergence
VZ
Verizon Communications Inc.
1/7/2021
Bullish
56.29
11672
MACD +ve Divergence
AMAT
Applied Materials, Inc.
1/7/2021
Bearish
137.95
7694
MACD-H -ve Divergence
BND
Vanguard Total Bond Market ETF
1/7/2021
Bearish
85.75
5768
MACD-H -ve Divergence
EBAY
eBay Inc.
1/7/2021
Bearish
69.8
8520
MACD-H -ve Divergence
HIMX
Himax Technologies, Inc.
1/7/2021
Bearish
15.91
5242
MACD-H -ve Divergence
INTC
Intel Corporation
1/7/2021
Bearish
56.01
24872
MACD Cross-Down Signal
IQ
iQIYI, Inc.
1/7/2021
Bearish
15.13
5349
MACD Cross-Down Signal
JD
JD.com, Inc.
1/7/2021
Bearish
77.44
11109
MACD-H -ve Divergence
MRNA
Moderna, Inc.
1/7/2021
Bearish
235.11
5928
MACD-H -ve Divergence
PDD
Pinduoduo Inc.
1/7/2021
Bearish
121.84
6314
MACD Cross-Down ZeroLine
PLUG
Plug Power, Inc.
1/7/2021
Bearish
33.31
18527
MACD-H -ve Divergence
QQQ
Invesco QQQ Trust, Series 1
1/7/2021
Bearish
354.57
29290
MACD -ve Divergence
TIGR
UP Fintech Holding Limited
1/7/2021
Bearish
26.17
9009
MACD-H -ve Divergence
TLRY
Tilray, Inc.
1/7/2021
Bearish
17.84
16278
MACD Cross-Down ZeroLine
TLT
iShares 20+ Year Treasury Bond ETF
1/7/2021
Bearish
144.17
10810
MACD -ve Divergence
TME
Tencent Music Entertainment Group
1/7/2021
Bearish
15.47
8579
MACD Cross-Down ZeroLine
TQQQ
ProShares UltraPro QQQ
1/7/2021
Bearish
122.56
20959
MACD -ve Divergence
20210701 US Stock One-day MACD Signals
Moses Stock Scan Column
Free Power US Stock MACD Scan Signals AmiBroker Academy.com
Disclaimer: The above result is for illustration purpose. It is not meant to be used for buy or sell decision. We do not recommend any particular stocks on our website. If particular stocks of such are mentioned, they are meant as illustration or demonstration of Amibroker as a powerful charting software or MACD scanner. Amibroker can program to scan the stocks that have MACD buy or sell signals.
These are script generated signals. Not all scan results are shown here. The MACD signal should use with price action and confirmation. Users must understand what MACD and price action are all about before using them. If necessary you should attend a course to learn more about Technical Analysis (TA) and Moving Average Convergence Divergence, MACD.
Once again, the website does not guarantee any results or investment return based on the information and instruction you have read here. It should be used as learning aids only and if you decide to trade real money, all trading decision should be your own, and you should take your own responsibility.
Welcome to AmiBroker Academy. Thanks for visiting the site.
Power AmiBroker Script
AmiBroker stock charting software has a programmable capability. The screener signals are done by the AmiBroker AFL script. If you are interested in any of the AmiBroker script, you can search WiseTrader Toolbox for a similar one.
Moving Average Convergence Divergence, MACD Screener
MACD was developed by Gerald Appel in the late seventies.
MACD stands for Moving Average Convergence Divergence, the MACD line (red line or called fast line) and MACD signal line (blue line, or called slow line).
MACD Bullish Signal Line Cross: MACD bullish signal when red line crosses above the blue line or MACD line crosses above zero line.
MACD Bearish Signal Line Cross: MACD bearish signal when blue line crosses below red line or MACD line crosses below zero line.
MACD Scan
These are stocks picked for June 28.
Some of 30 June, 2021 AmiBroker AFL Script Generated One-day US Stock MACD Signals
Ticker
Company
Date
Signals
Close
Vol.(K)
Screening Result
BAC
Bank of America Corporation
30/6/2021
Bullish
41.23
29160
MACD Cross-Up Signal
BMY
Bristol-Myers Squibb Company
30/6/2021
Bullish
66.82
10120
MACD Cross-Up Signal
CMCSA
Comcast Corporation
30/6/2021
Bullish
57.02
12985
MACD Cross-Up ZeroLine
COG
Cabot Oil & Gas Corporation
30/6/2021
Bullish
17.46
18240
MACD Cross-Up Signal
EQT
EQT Corporation
30/6/2021
Bullish
22.26
5876
MACD Cross-Up ZeroLine
GILD
Gilead Sciences, Inc.
30/6/2021
Bullish
68.86
6010
MACD Cross-Up Signal
MS
Morgan Stanley
30/6/2021
Bullish
91.69
9780
MACD Cross-Up Signal
TJX
TJX Companies, Inc. (The)
30/6/2021
Bullish
67.42
5014
MACD Cross-Up ZeroLine
VZ
Verizon Communications Inc.
30/6/2021
Bullish
56.03
14560
MACD-H +ve Divergence
WMT
Walmart Inc.
30/6/2021
Bullish
141.02
15170
MACD Cross-Up Signal
BSX
Boston Scientific Corporation
30/6/2021
Bearish
42.76
8902
MACD Cross-Down Signal
FB
Facebook, Inc.
30/6/2021
Bearish
347.71
15108
MACD-H -ve Divergence
FTCH
Farfetch Limited
30/6/2021
Bearish
50.36
7650
MACD Cross-Down Signal
SBUX
Starbucks Corporation
30/6/2021
Bearish
111.81
6759
MACD Cross-Down ZeroLine
WKHS
Workhorse Group, Inc.
30/6/2021
Bearish
16.59
13255
MACD Cross-Down Signal
20210630 US Stock One-day MACD Signals
Moses Stock Scan Column
Free Power US Stock MACD Scan Signals AmiBroker Academy.com
Disclaimer: The above result is for illustration purpose. It is not meant to be used for buy or sell decision. We do not recommend any particular stocks on our website. If particular stocks of such are mentioned, they are meant as illustration or demonstration of Amibroker as a powerful charting software or MACD scanner. Amibroker can program to scan the stocks that have MACD buy or sell signals.
These are script generated signals. Not all scan results are shown here. The MACD signal should use with price action and confirmation. Users must understand what MACD and price action are all about before using them. If necessary you should attend a course to learn more about Technical Analysis (TA) and Moving Average Convergence Divergence, MACD.
Once again, the website does not guarantee any results or investment return based on the information and instruction you have read here. It should be used as learning aids only and if you decide to trade real money, all trading decision should be your own, and you should take your own responsibility.