20 June, 2018
Thanks for visiting the site.
U.S. Stock Chart Analysis
T AT & T Charting and MACD
See chart, picture worth a thousand words. AT & T stock price after tested near 40 dollars a few times, and now the trend has ended, the price action continue to form lower high and lower low. If you will study MACD indicator, the current trend might be in the process of ending too. You may find MACD Histogram is forming a slight higher low; weak divergence. The MACD signal go back now to below zeroline again. There is a sudden MACD cross down signal before MACD cross down zeroline.
Draw two parallel line connecting the high and low. You see the price has been trapped within the two lines, channel.
Now the price breakout the upper channel, but fail and trapped again within the channel. Wait and see what next.
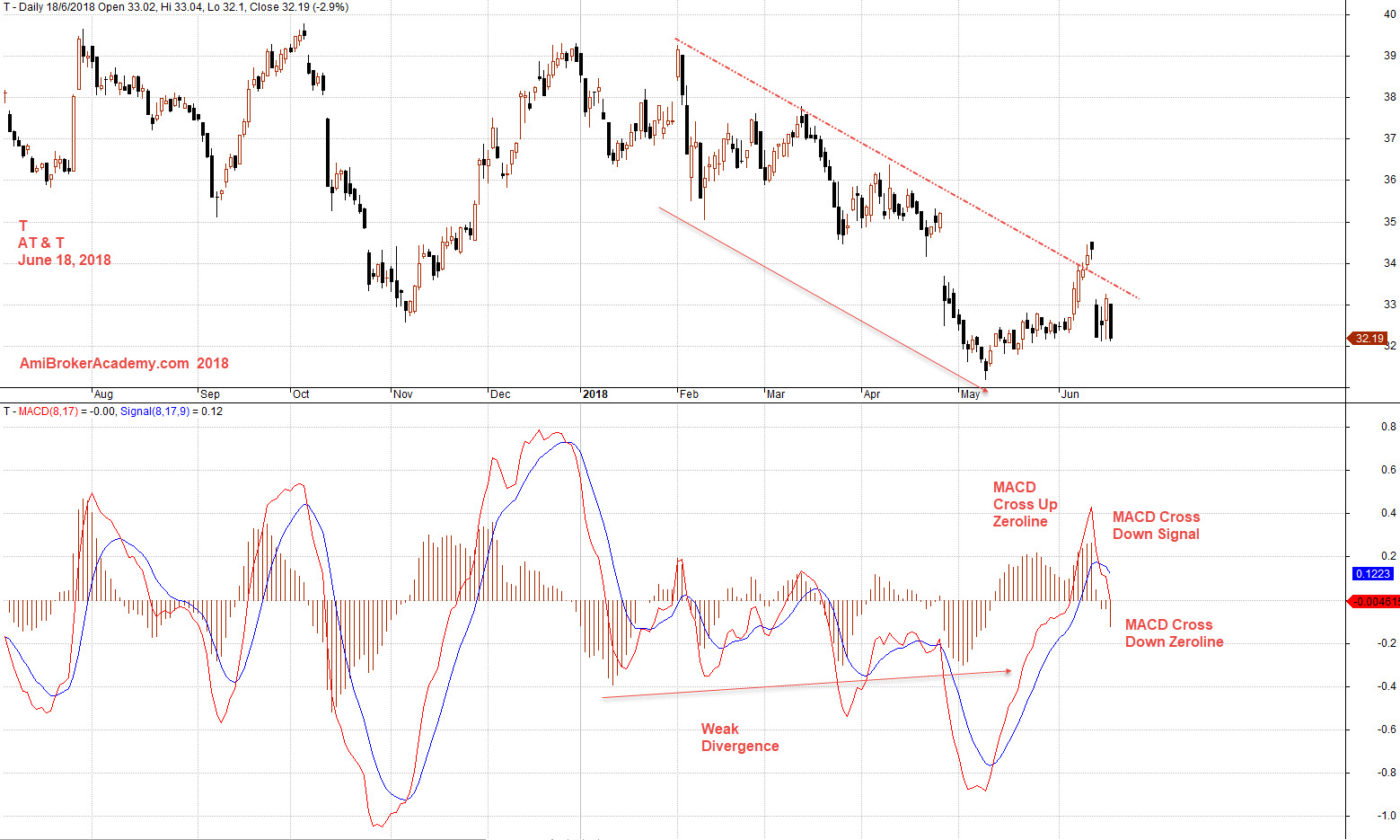
June 18, 2018 AT & T and MACD
Moses US Stock Chart Analysis
AmiBrokerAcademy.com
Disclaimer
The above result is for illustration purpose. It is not meant to be used for buy or sell decision. We do not recommend any particular stocks. If particular stocks of such are mentioned, they are meant as demonstration of Amibroker as a powerful charting software and MACD. Amibroker can program to scan the stocks for buy and sell signals.
These are script generated signals. Not all scan results are shown here. The MACD signal should use with price action. Users must understand what MACD and price action are all about before using them. If necessary you should attend a course to learn more on Technical Analysis (TA) and Moving Average Convergence Divergence, MACD.
Once again, the website does not guarantee any results or investment return based on the information and instruction you have read here. It should be used as learning aids only and if you decide to trade real money, all trading decision should be your own.