June 20, 2018
Thanks for visiting the site.
Free U.S. Stock MACD Scan
What is MACD?
MACD stands for Moving Average Convergence Divergence, common setting is (12,26,9)
MACD indicator is a trend trading system that makes up of 2 lines. The MACD Line (fast line) and MACD Signal Line (slow line).
1) When the MACD Line crosses over the MACD Signal Line the trend is bullish. When the MACD Line crosses below the MACD Signal the trend is bearish.
2) When the MACD Line crosses above zero line the trend is bullish. When the MACD line crosses below zero line the trend is bearish.
June 18, 2018 – Script Generated One-day U.S. Stock MACD Signals
The following are script generated One-day U.S. Stock Market MACD signals using the Powerful AmiBroker’s AFL.
Results of June 18 2018 One-day U.S. Stocks MACD Scan
For stocks closed greater than 18 dollars and at least 300,000 changed hands.
The MACD Setting used is (8,17,9)
| Ticker | Company | Date | Trend | Close | Vol.(K) | Screening Result |
| PTCT | PTC Therapeutics, Inc. | 18/6/2018 | Bullish | 47.88 | 12064 | MACD Cross-Up Signal |
| WMB | Williams Companies, Inc. (The) | 18/6/2018 | Bullish | 27.09 | 11648 | MACD Cross-Up ZeroLine |
| BOX | Box, Inc. | 18/6/2018 | Bullish | 28.64 | 9827 | MACD Cross-Up Signal |
| V | Visa Inc. | 18/6/2018 | Bullish | 136.2 | 8456 | MACD Cross-Up Signal |
| LUV | Southwest Airlines Company | 18/6/2018 | Bullish | 52.37 | 5451 | MACD Cross-Up ZeroLine |
| SO | Southern Company (The) | 18/6/2018 | Bullish | 44.57 | 4592 | MACD Cross-Up ZeroLine |
| CRZO | Carrizo Oil & Gas, Inc. | 18/6/2018 | Bullish | 27.86 | 3525 | MACD Cross-Up Signal |
| TWLO | Twilio Inc. | 18/6/2018 | Bullish | 61.61 | 3486 | MACD Cross-Up Signal |
| UNP | Union Pacific Corporation | 18/6/2018 | Bullish | 146.55 | 3223 | MACD Cross-Up Signal |
| BHF | Brighthouse Financial, Inc. | 18/6/2018 | Bullish | 46.02 | 3049 | MACD-H +ve Divergence |
| T | AT&T Inc. | 18/6/2018 | Bearish | 32.19 | 78255 | MACD Cross-Down ZeroLine |
| INTC | Intel Corporation | 18/6/2018 | Bearish | 53.22 | 40393 | MACD Cross-Down ZeroLine |
| QQQ | PowerShares QQQ Trust, Series 1 | 18/6/2018 | Bearish | 176.5 | 29319 | MACD Cross-Down Signal |
| VRX | Valeant Pharmaceuticals International, Inc. | 18/6/2018 | Bearish | 23.56 | 23675 | MACD Cross-Down Signal |
| ORCL | Oracle Corporation | 18/6/2018 | Bearish | 46.52 | 20777 | MACD Cross-Down ZeroLine |
| KO | Coca-Cola Company (The) | 18/6/2018 | Bearish | 43.55 | 11901 | MACD Cross-Down Signal |
| IVZ | Invesco Plc | 18/6/2018 | Bearish | 26.82 | 10249 | MACD Cross-Down Signal |
| AABA | Altaba Inc. | 18/6/2018 | Bearish | 81.61 | 9639 | MACD Cross-Down Signal |
| GGP | GGP Inc. | 18/6/2018 | Bearish | 20.67 | 9255 | MACD Cross-Down Signal |
| GIS | General Mills, Inc. | 18/6/2018 | Bearish | 44.73 | 8411 | MACD-H -ve Divergence |
| WMT | Wal-Mart Stores, Inc. | 18/6/2018 | Bearish | 83 | 8341 | MACD Cross-Down Signal |
| GILD | Gilead Sciences, Inc. | 18/6/2018 | Bearish | 69.06 | 6565 | MACD Cross-Down Signal |
| PHM | PulteGroup, Inc. | 18/6/2018 | Bearish | 29.62 | 5837 | MACD Cross-Down ZeroLine |
| HPQ | HP Inc. | 18/6/2018 | Bearish | 23.65 | 5550 | MACD Cross-Down Signal |
| DHI | D.R. Horton, Inc. | 18/6/2018 | Bearish | 41.93 | 5366 | MACD Cross-Down Signal |
| GLW | Corning Incorporated | 18/6/2018 | Bearish | 28.87 | 5224 | MACD -ve Divergence |
| FITB | Fifth Third Bancorp | 18/6/2018 | Bearish | 30.67 | 4838 | MACD Cross-Down Signal |
| LEN | Lennar Corporation | 18/6/2018 | Bearish | 51.97 | 4622 | MACD Cross-Down Signal |
| TNDM | Tandem Diabetes Care, Inc. | 18/6/2018 | Bearish | 19.64 | 4503 | MACD-H -ve Divergence |
| KHC | The Kraft Heinz Company | 18/6/2018 | Bearish | 60.87 | 4469 | MACD-H -ve Divergence |
| WLL | Whiting Petroleum Corporation | 18/6/2018 | Bearish | 47.91 | 4232 | MACD Cross-Down ZeroLine |
| JBL | Jabil Inc. | 18/6/2018 | Bearish | 26.99 | 3957 | MACD Cross-Down ZeroLine |
| JCI | Johnson Controls International plc | 18/6/2018 | Bearish | 34.54 | 3888 | MACD Cross-Down ZeroLine |
| ZTS | Zoetis Inc. | 18/6/2018 | Bearish | 88.93 | 3505 | MACD-H -ve Divergence |
| AFL | Aflac Incorporated | 18/6/2018 | Bearish | 45.17 | 3468 | MACD Cross-Down Signal |
| IONS | Ionis Pharmaceuticals, Inc. | 18/6/2018 | Bearish | 43.61 | 3387 | MACD Cross-Down Signal |
| BLL | Ball Corporation | 18/6/2018 | Bearish | 36.74 | 3270 | MACD Cross-Down Signal |
| MOMO | Momo Inc. | 18/6/2018 | Bearish | 53.13 | 3234 | MACD Cross-Down Signal |
| PPC | Pilgrim’s Pride Corporation | 18/6/2018 | Bearish | 19.83 | 3201 | MACD Cross-Down ZeroLine |
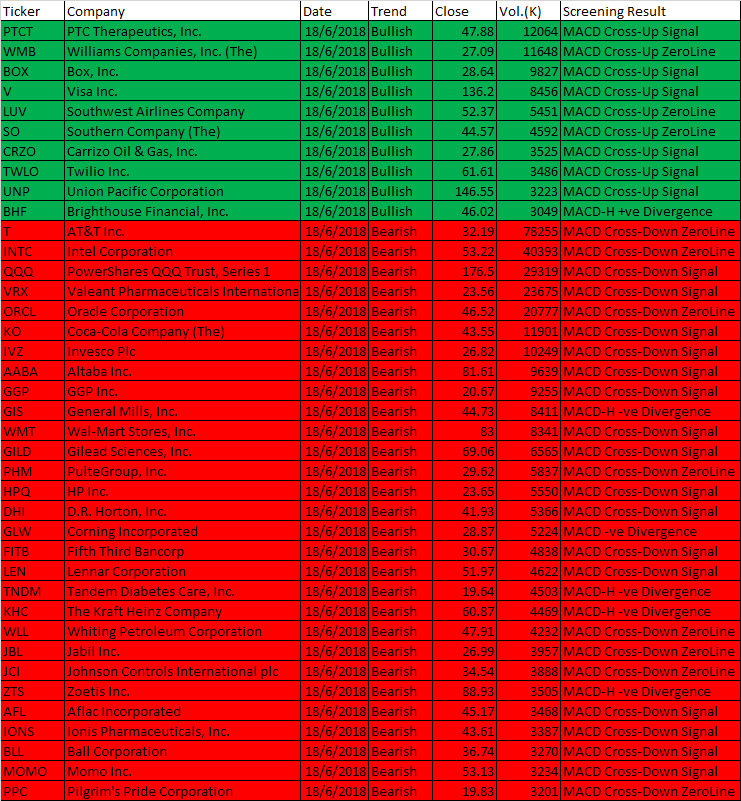
June 18, 2018 US Stock One-day MACD Scan Results
Have fun!
Moses U.S. Stock MACD Scan
AmiBroker Academy.com
Disclaimer
The above result is for illustration purpose. It is not meant to be used for buy or sell decision. We do not recommend any particular stocks. If particular stocks of such are mentioned, they are meant as demonstration of Amibroker as a powerful charting software and MACD. Amibroker can program to scan the stocks for buy and sell signals.
These are script generated signals. Not all scan results are shown here. The MACD signal should use with price action. Users must understand what MACD and price action are all about before using them. If necessary you should attend a course to learn more on Technical Analysis (TA) and Moving Average Convergence Divergence, MACD.
Once again, the website does not guarantee any results or investment return based on the information and instruction you have read here. It should be used as learning aids only and if you decide to trade real money, all trading decision should be your own.