1 November, 2018
Thanks for visiting the site.
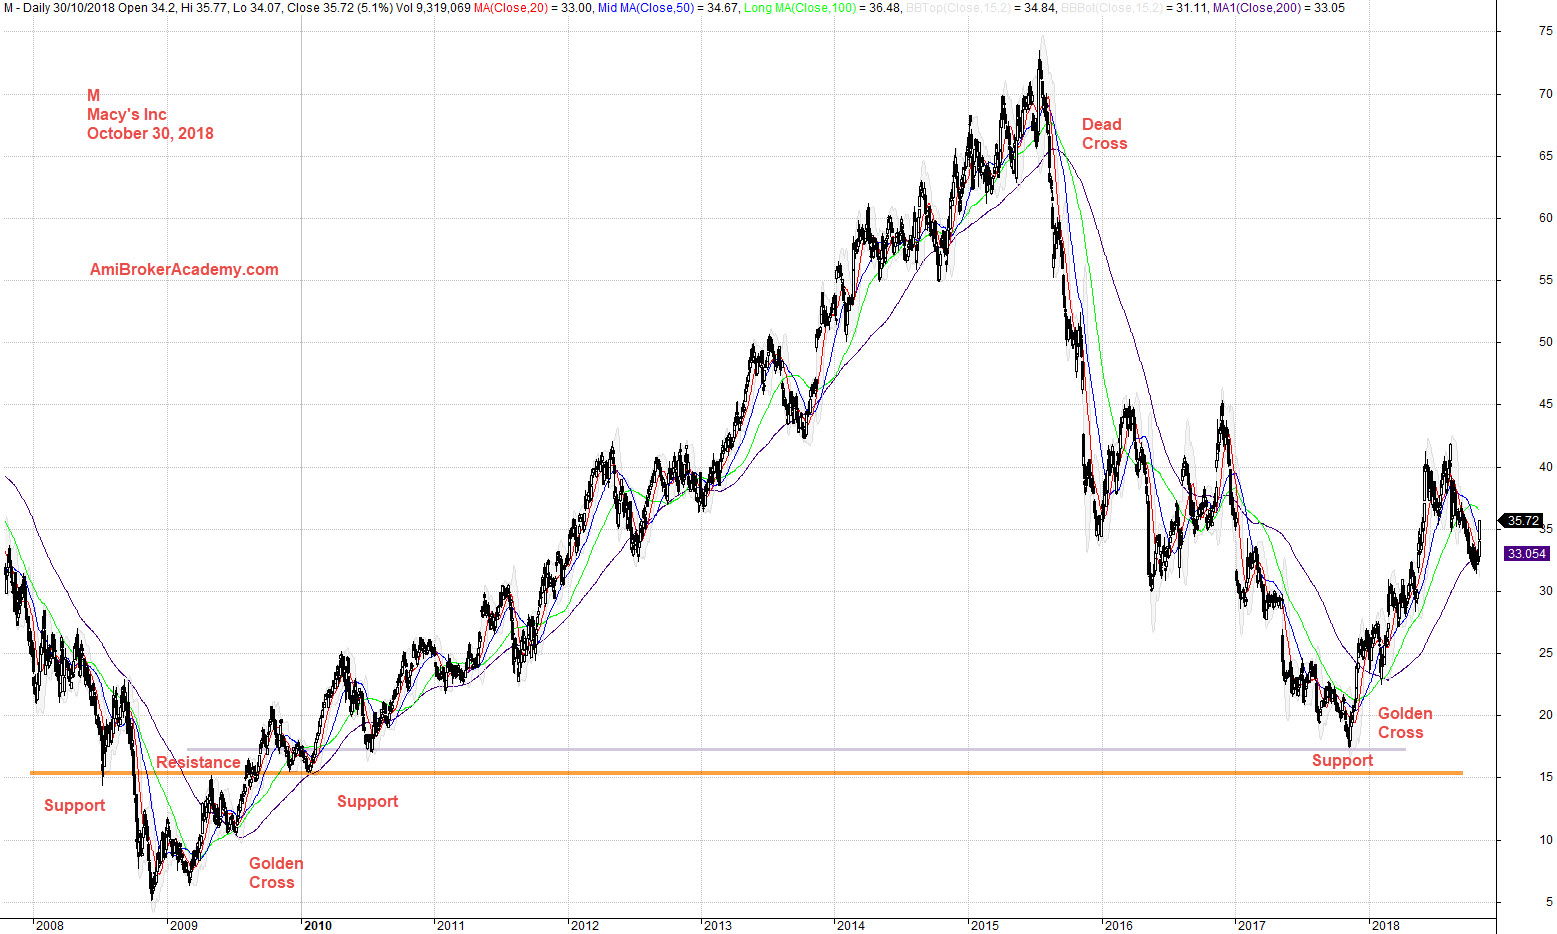
M Macy’s Inc Daily Charting – Buy Hold Strategy
Buy Support Sell Resistance
Buy Low Sell High
Study chart of Macy’s Inc Daily stock chart.
See chart, the price action from the low at 5 dollars to the peak near 75 dollars. The price action move in the very bullish trend up. But after mid 2015, the stock price begin to decline, the pullback was so strong that by the end of 2015, the stock price return to the 2012 low. The market wipe out near three years of growth. The pullback did not stop here, the price action goes below 20 dollars in 2017. This time the low is almost 2010 low. Wow, what a move.
Think think got more things.
Manage your risk.
October 30, 2018 Macy’s Inc and Buy Hold Strategy
if you can see the full chart, “press Ctrl and -” to zoom out and see the entire chart.
Add MACD indicator, see chart on MACD cross up zeroline and MACD cross up signal.
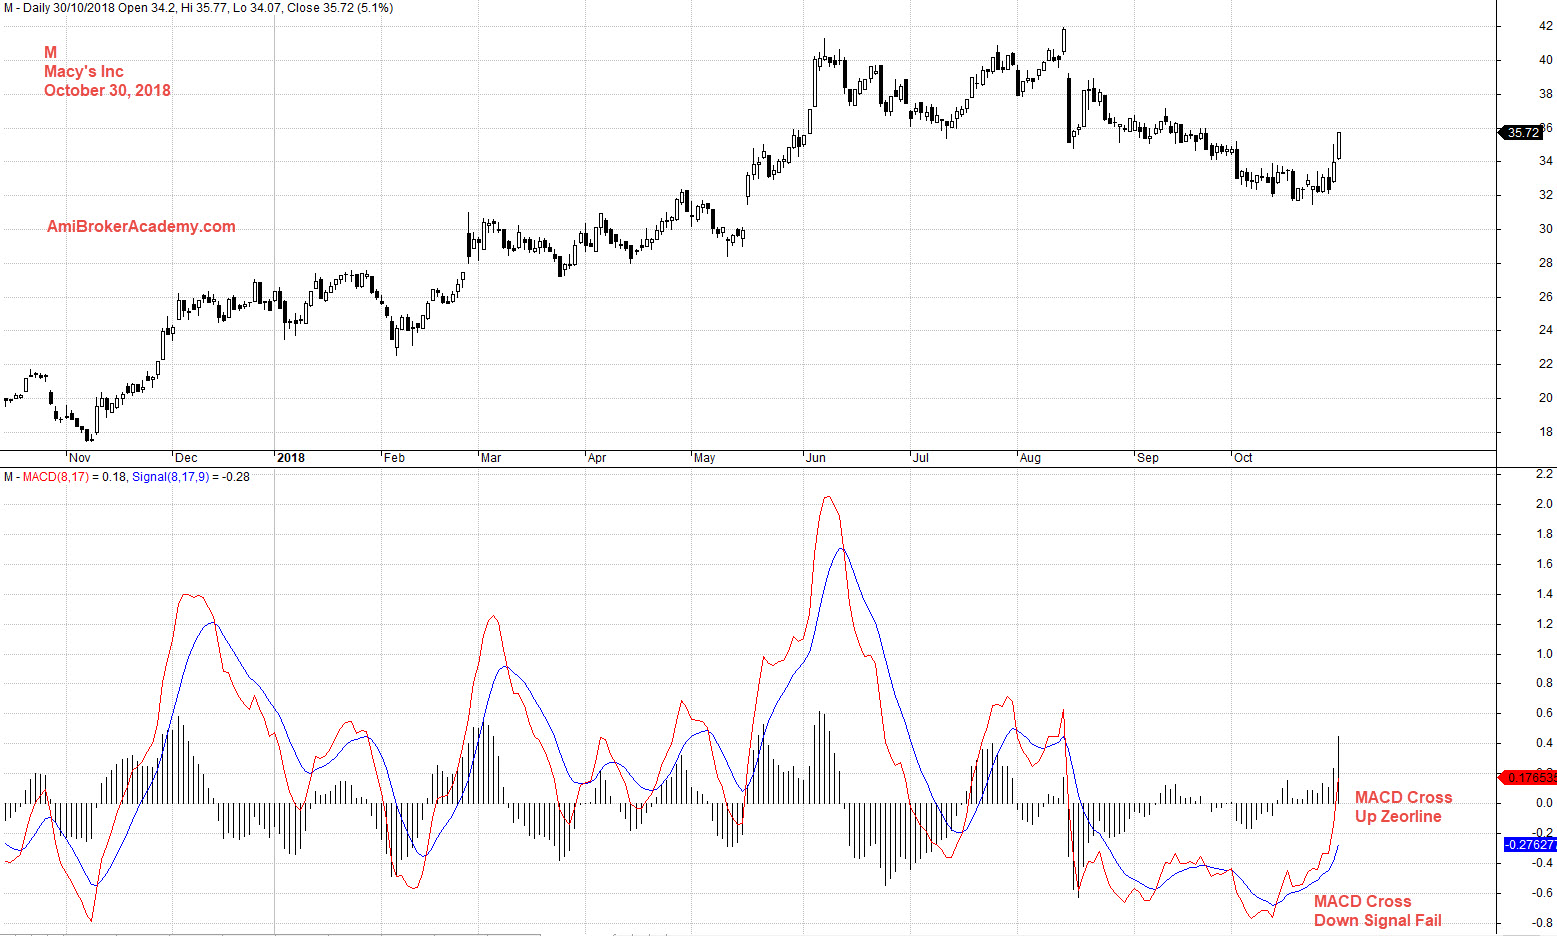
October 30, 2018 Macy’s Inc and MACD
Hope you are not offended, we are H M Gartley fan. We add a channel, you could see a narrow channel. Narrow channel signals a strong trend, this is a strong bull. You could spot many H M Gartley 222 pattern within the channel.
Of course, the big move is also a H M Gartley 222 pattern. It is not so easy to find ABCD pattern, on the price action is in progress. But it is becoming very clear when the pattern is near completion. Trade with your eyes open.
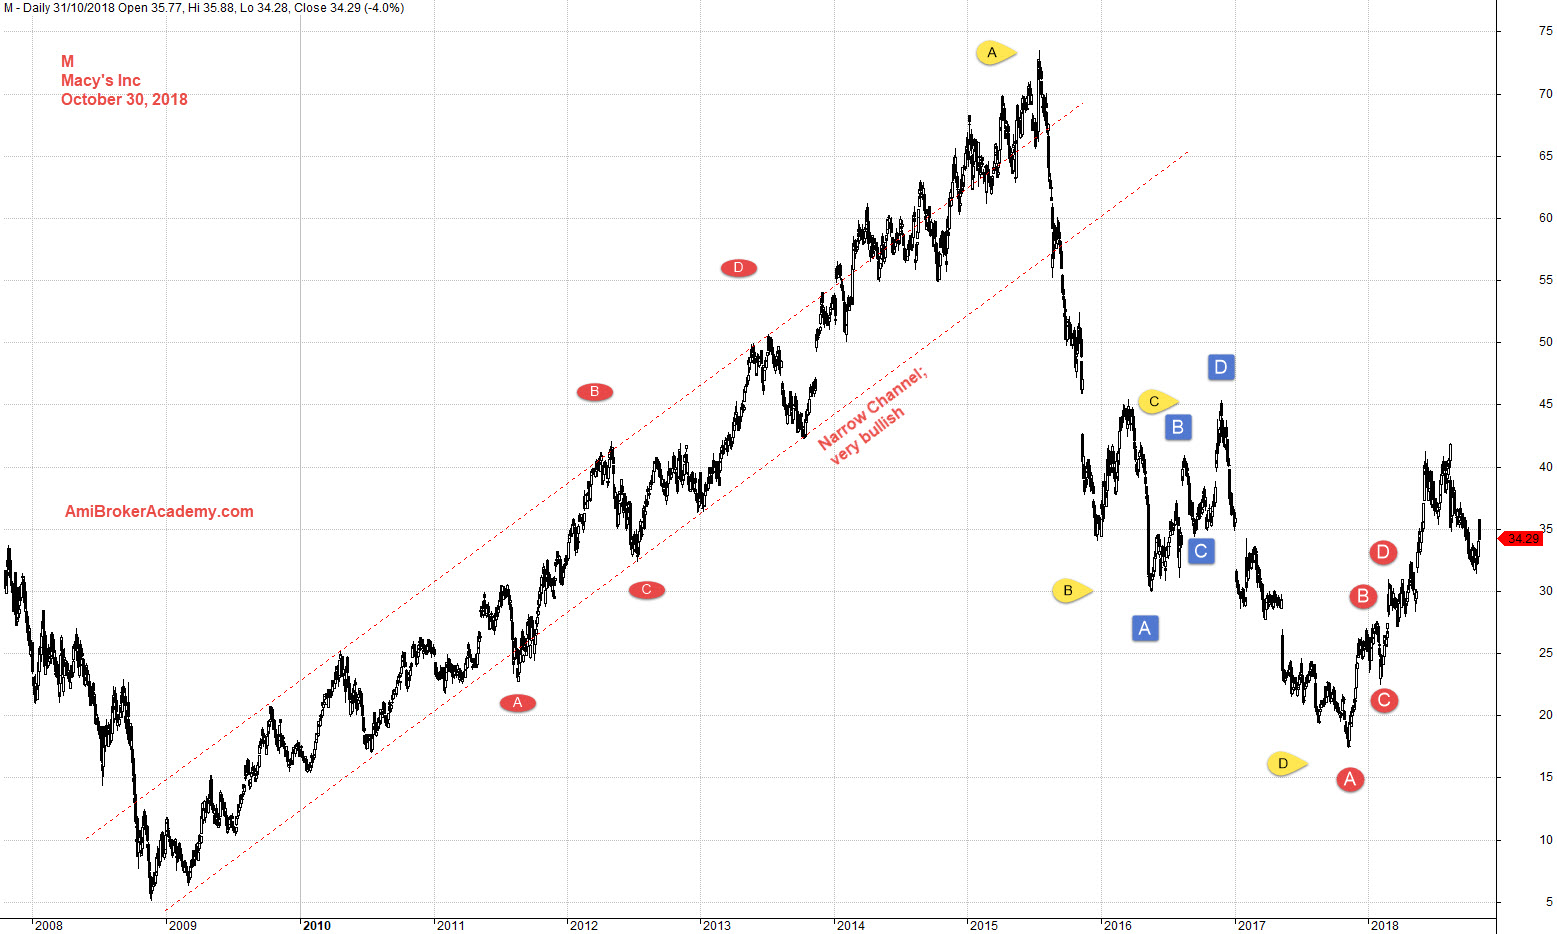
October 30, 2018 Macy’s Inc and Channel and H M Gartey
Moses US Stock Chart Analysis
AmiBrokerAcademy.com
Disclaimer
The above result is for illustration purpose. It is not meant to be used for buy or sell decision. We do not recommend any particular stocks. If particular stocks of such are mentioned, they are meant as demonstration of Amibroker as a powerful charting software and MACD. Amibroker can program to scan the stocks for buy and sell signals.
These are script generated signals. Not all scan results are shown here. The MACD signal should use with price action. Users must understand what MACD and price action are all about before using them. If necessary you should attend a course to learn more on Technical Analysis (TA) and Moving Average Convergence Divergence, MACD.
Once again, the website does not guarantee any results or investment return based on the information and instruction you have read here. It should be used as learning aids only and if you decide to trade real money, all trading decision should be your own.