1 November, 2018
Thanks for visiting the site.
Moses Stock Stories – Think Think Got More Things
0571.HK eSun Holdings Charting
Buy Hold Strategy
We study eSun Holdings stock chart. We see eSun Holdings stock price from low at HK$ 0.90 to the high slightly above HK$ 3.90.
Thereafter the price action pullback and test the low 0.90 HK$ again. HK$ 0.90 seems to be an important level for this stock. See chart, the price has been always traded back to this level.
Besides that you could also spot H M Gartley 222 pattern. See the next chart.
Manage Your Risk!
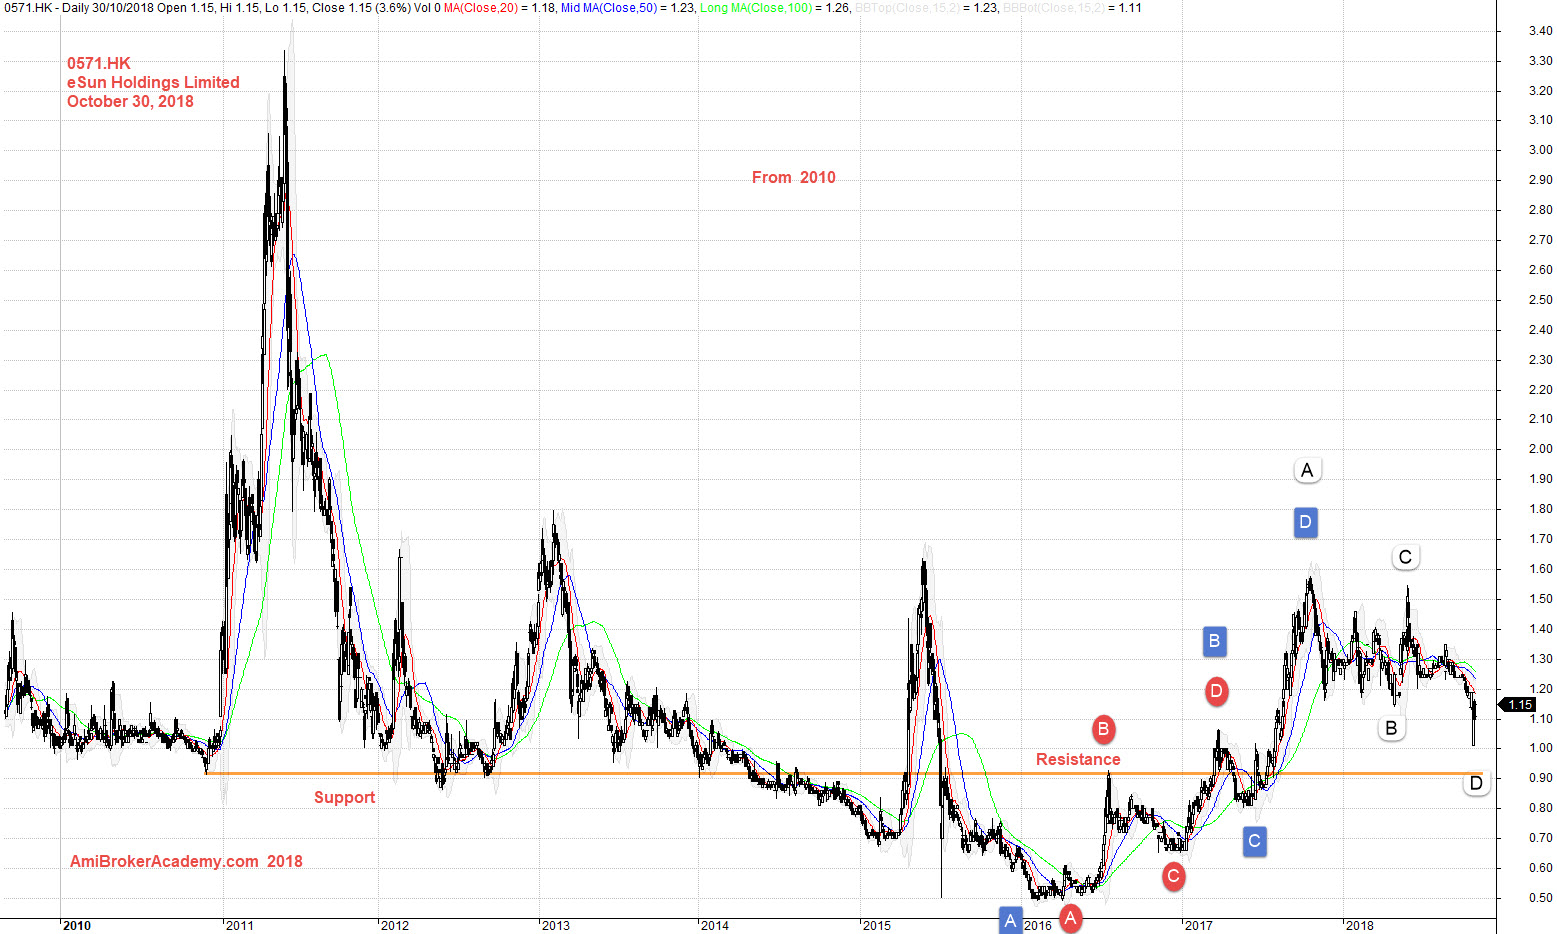
October 30, 2018 eSun Holdings Buy Hold Strategy
If you can see the whole chart, “press Ctrl and -” to zoom out to see the entire chart.
Remember always reference to the golden rules of TA. See the following.
Technical Analysis
- Buy low sell high, or buy support sell resistance.
- Taking profit when price action close below bull trendline.
Zoom in and study the stock chart, see eSun Holding stock price try to retest the high of HK$1.80 but just fail short. You could find many H M Gartley 222 pattern. When add moving averages such as 20, 50 and 100 period, You see the dead cross just before the end of 2017, and noew the price action stay below MAs. Trade with your eyes open.
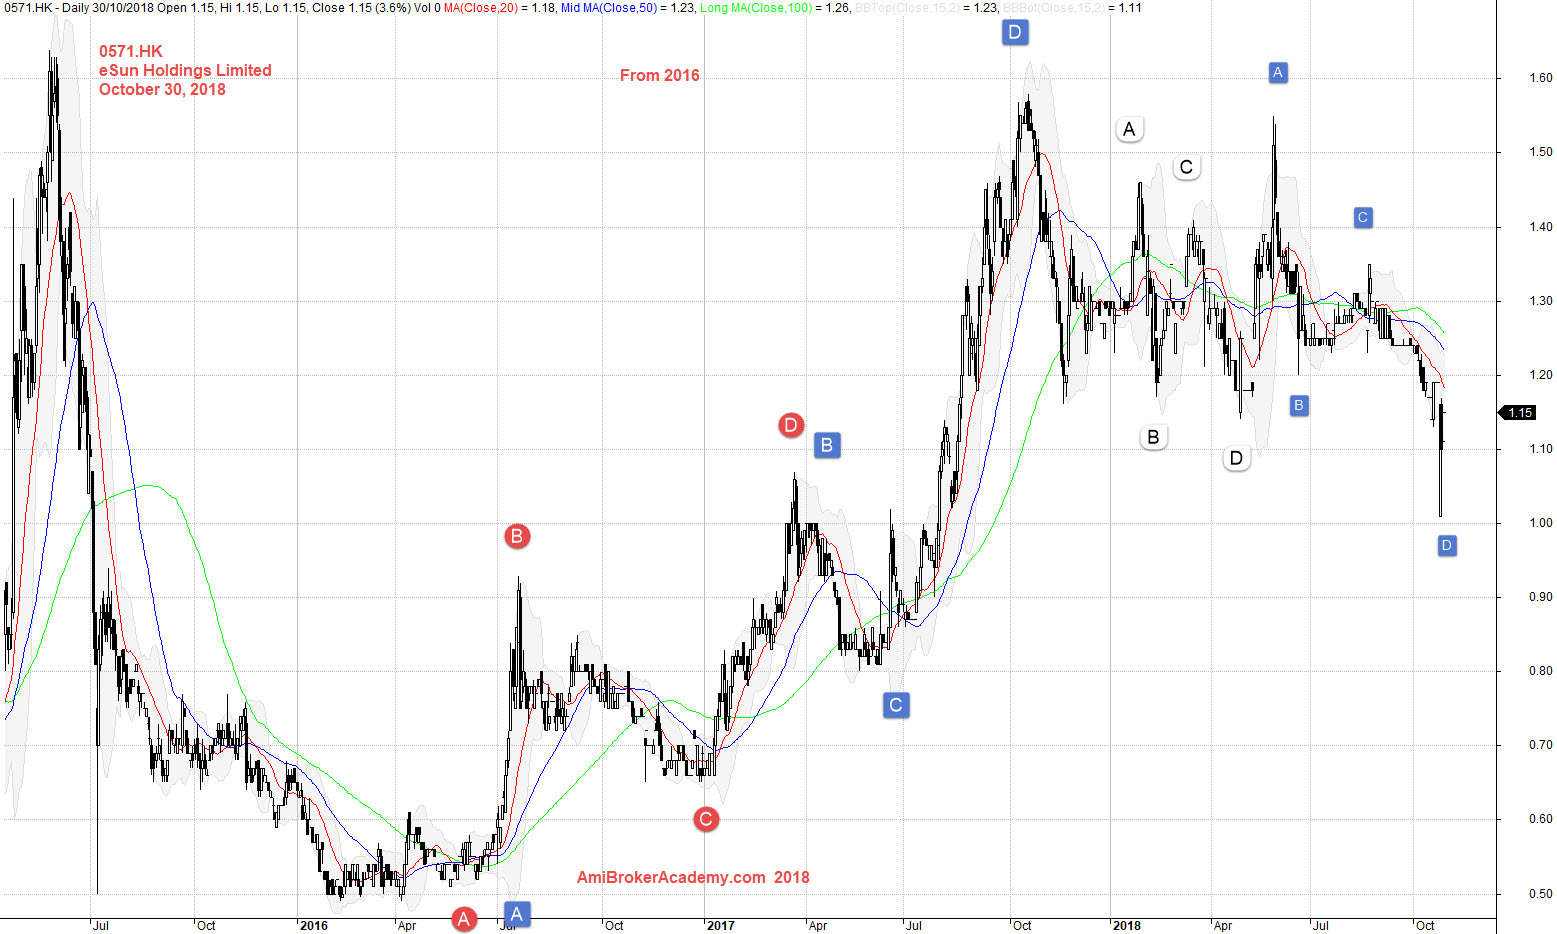
October 30, 2018 eSun Holdings Zoom In and H M Gartley 222
Zoom in futher, and add MACD indicator. See chart, we spot a MACD cross up signal line failure. But we see a +ve Divergence. Is the bear trend ending soon, Will see. As setup can fail. Trade with eyes open.
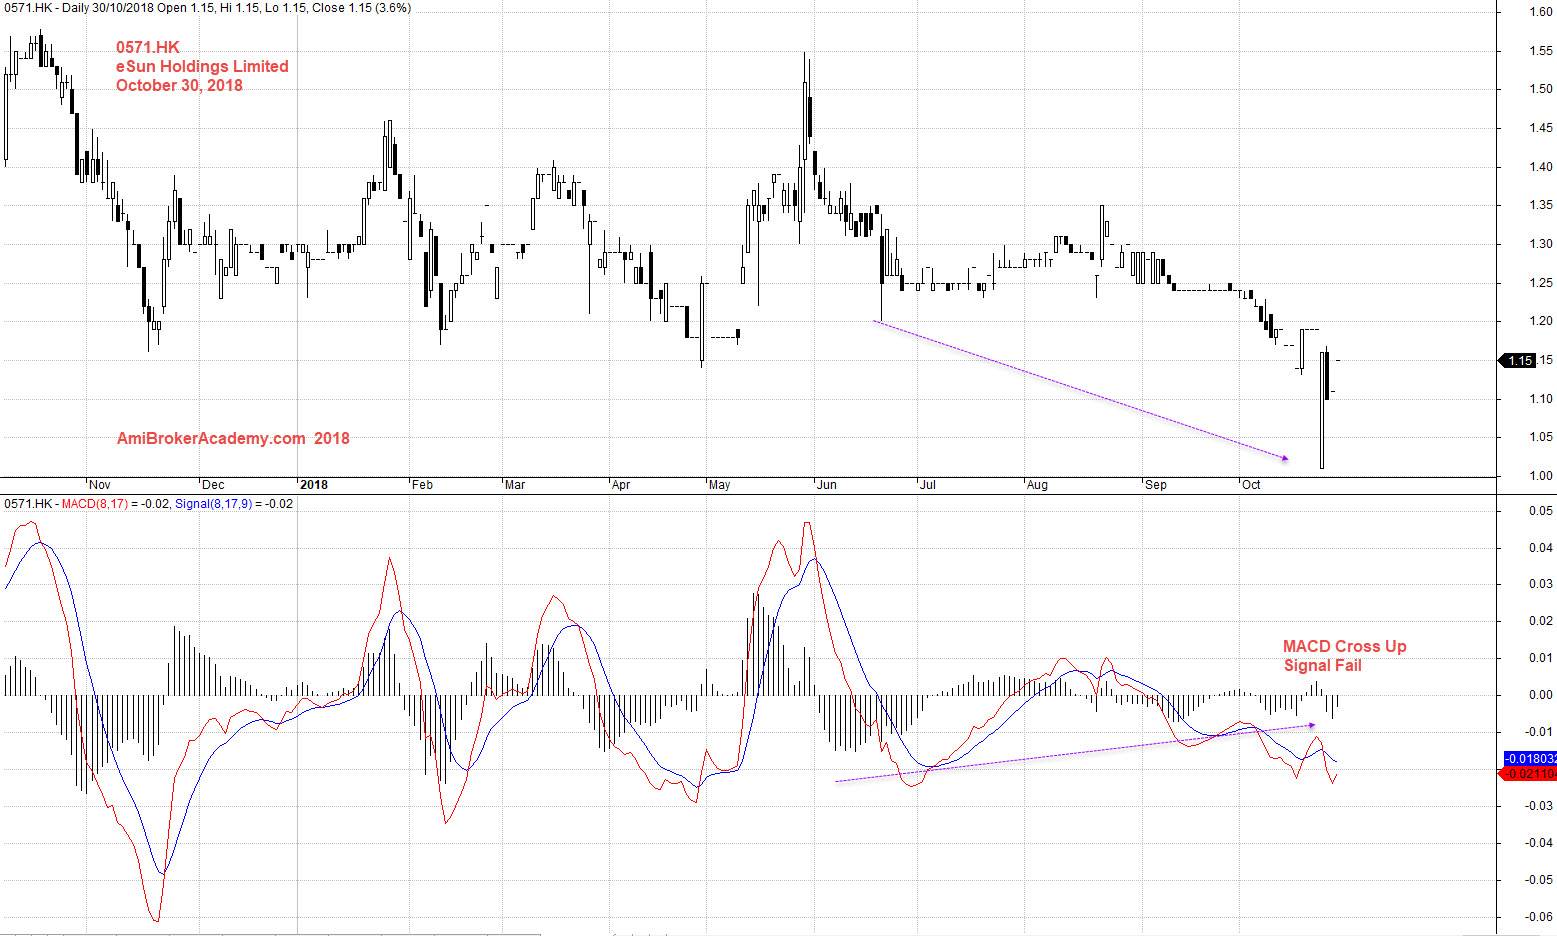
October 30, 2018 eSun Holdings Zoom In and MACD
Moses
AmiBrokerAcademy.com
Disclaimer
The above result is for illustration purpose. It is not meant to be used for buy or sell decision. We do not recommend any particular stocks. If particular stocks of such are mentioned, they are meant as demonstration of Amibroker as a powerful charting software and MACD. Amibroker can program to scan the stocks for buy and sell signals.
These are script generated signals. Not all scan results are shown here. The MACD signal should use with price action. Users must understand what MACD and price action are all about before using them. If necessary you should attend a course to learn more on Technical Analysis (TA) and Moving Average Convergence Divergence, MACD.
Once again, the website does not guarantee any results or investment return based on the information and instruction you have read here. It should be used as learning aids only and if you decide to trade real money, all trading decision should be your own.