27 October, 2018
Thanks for visiting the site.
Think think got more things.
If you were given a chance again, how would you trade? As a technical analyst. You have understand that until the price action makes a U-turn, otherwise the support is not count. See the example below.
GS Goldman Sachs Group Daily Charting
Buy Support Sell Resistance
Buy Low Sell High
Study chart of Goldman Sachs Group Daily stock price since 2000, almost twenty years. See chart, picture worth a thousand words. If we take ten years as one milestone, or one trading block. See the outcome.
In this chart, the stock goes from near 50 dollars to near 280 dollars in last eighteen years. When we look back on each ten years. From year 2000, the price action actually returning to the start point near ten years. Luckily the price action rebounce back to 190 dollars. Will as a technical analyst, as long as to take profit when close below bull trendline you will be good.
See the next trading block, you will be happy as so far the price action is still remain high.
Think think got more things. Can you spot H M Gartley 222 pattern? If you trade using this simple move. You will be alright. Talk again soon.
Manage your risk.
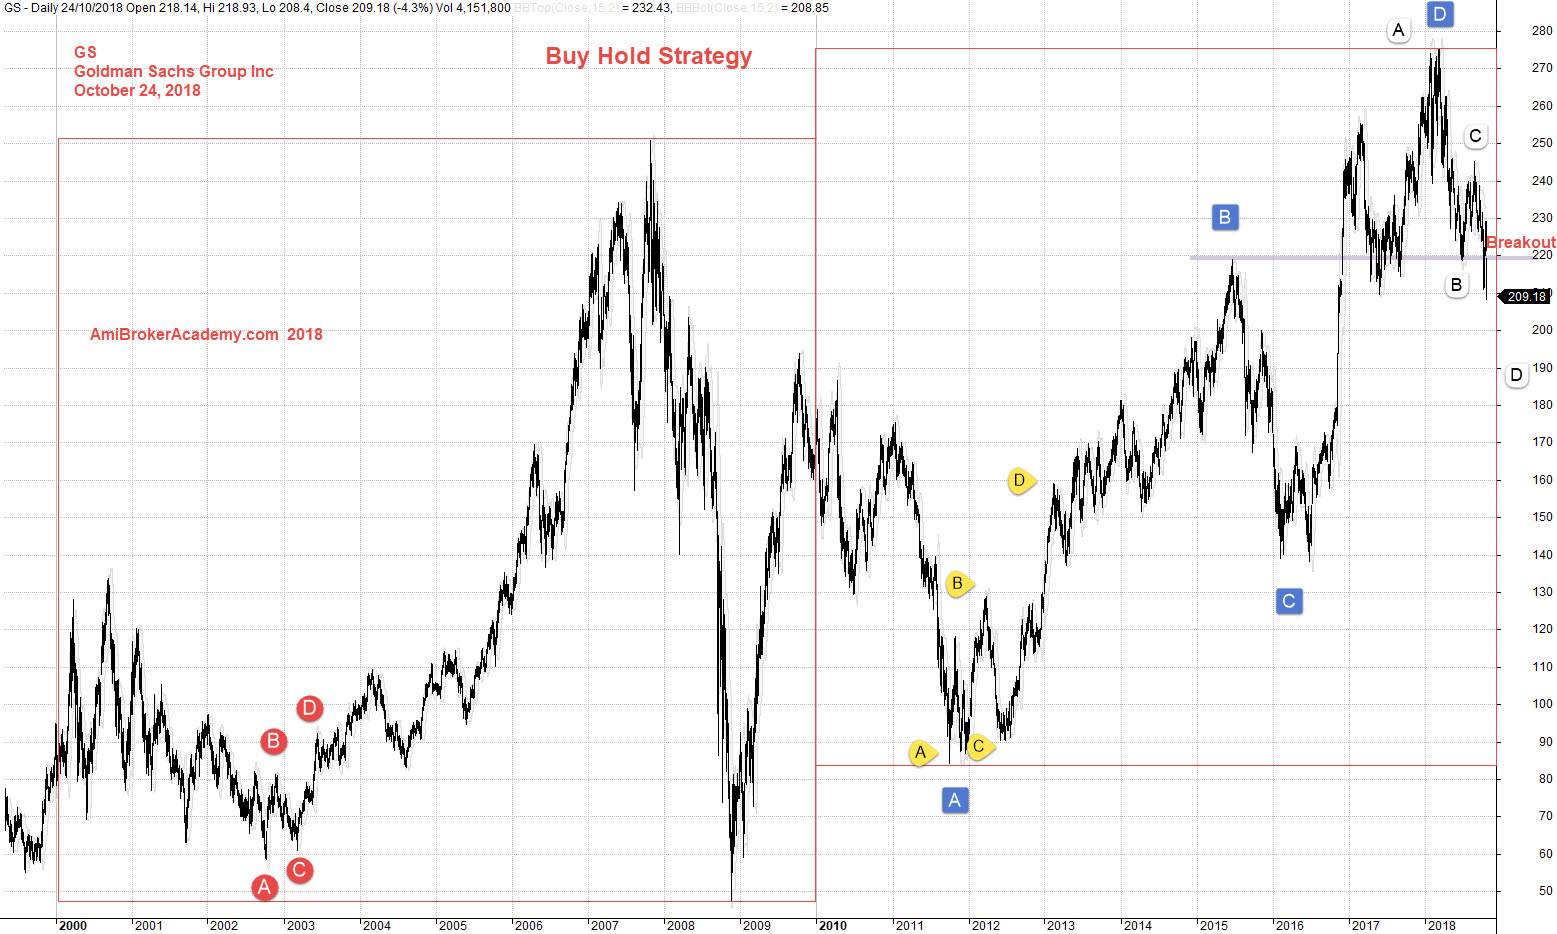
October 24, 2018 Goldman Sachs Group Buy Hold Twenty Years
if you can see the full chart, “press Ctrl and -” to zoom out and see the entire chart.
Zoom in, see the last ABCD pattern. See the level the price action may be response. Check.
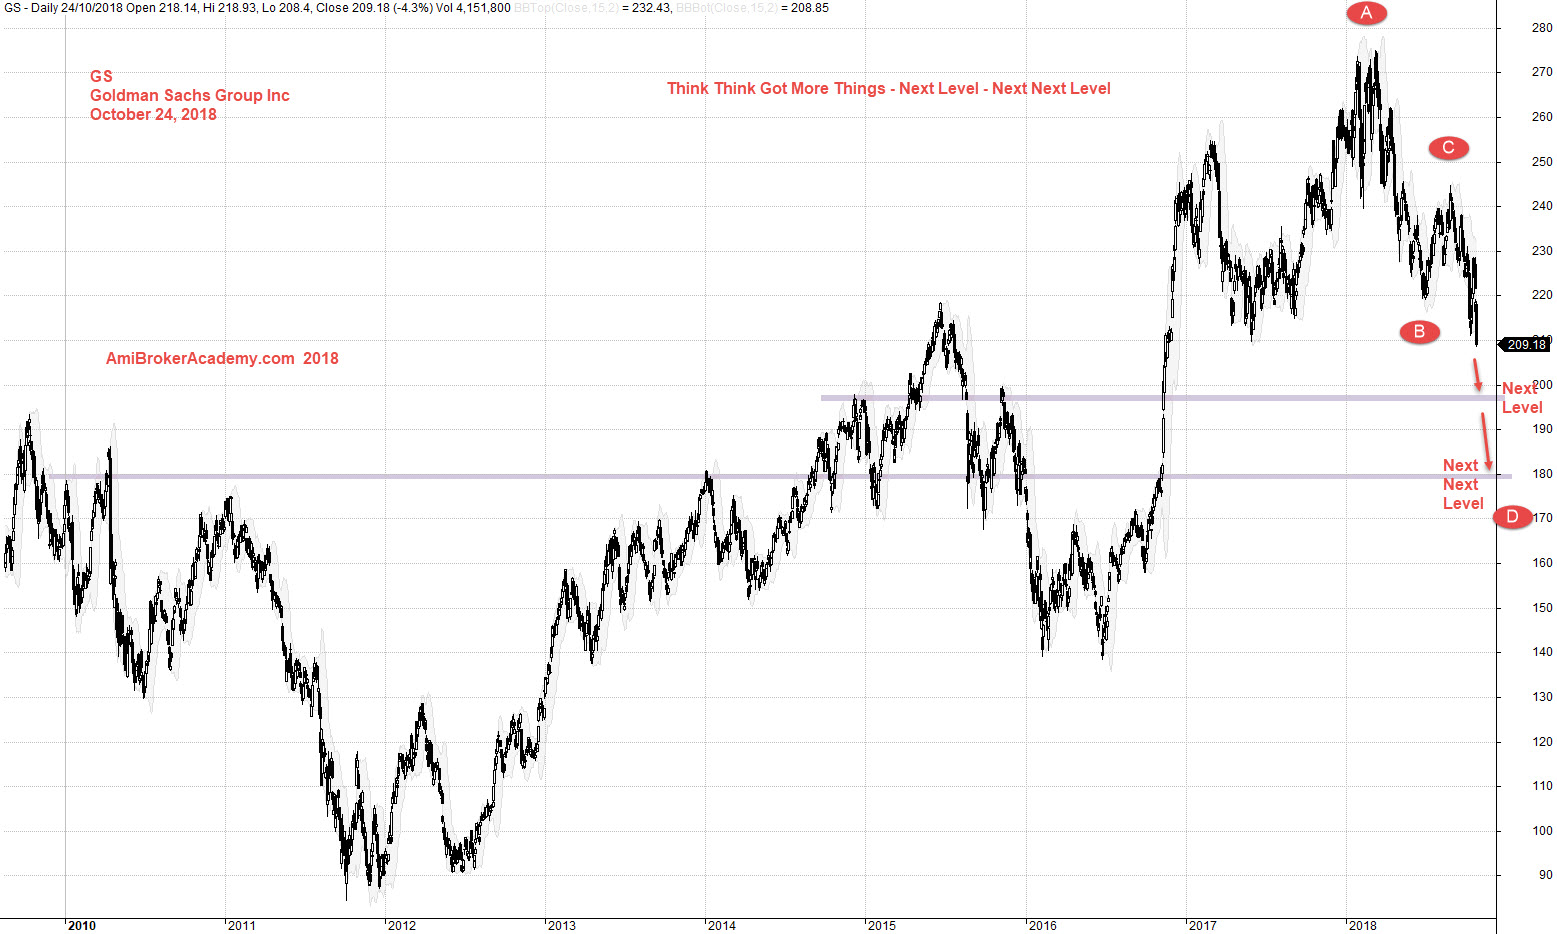
October 24, 2018 Goldman Sachs Group Next Level or Next Next Level
Moses US Stock Chart Analysis
AmiBrokerAcademy.com
Disclaimer
The above result is for illustration purpose. It is not meant to be used for buy or sell decision. We do not recommend any particular stocks. If particular stocks of such are mentioned, they are meant as demonstration of Amibroker as a powerful charting software and MACD. Amibroker can program to scan the stocks for buy and sell signals.
These are script generated signals. Not all scan results are shown here. The MACD signal should use with price action. Users must understand what MACD and price action are all about before using them. If necessary you should attend a course to learn more on Technical Analysis (TA) and Moving Average Convergence Divergence, MACD.
Once again, the website does not guarantee any results or investment return based on the information and instruction you have read here. It should be used as learning aids only and if you decide to trade real money, all trading decision should be your own.