26 October, 2018
Thanks for visiting the site.
Think think got more things.
If you were given a chance again, how would you trade? As a technical analyst. You have understand that until the price action makes a U-turn, otherwise the support is not count. See the example below.
BK Bank of New Mellon Corporation Daily Charting
Buy Support Sell Resistance
Buy Low Sell High
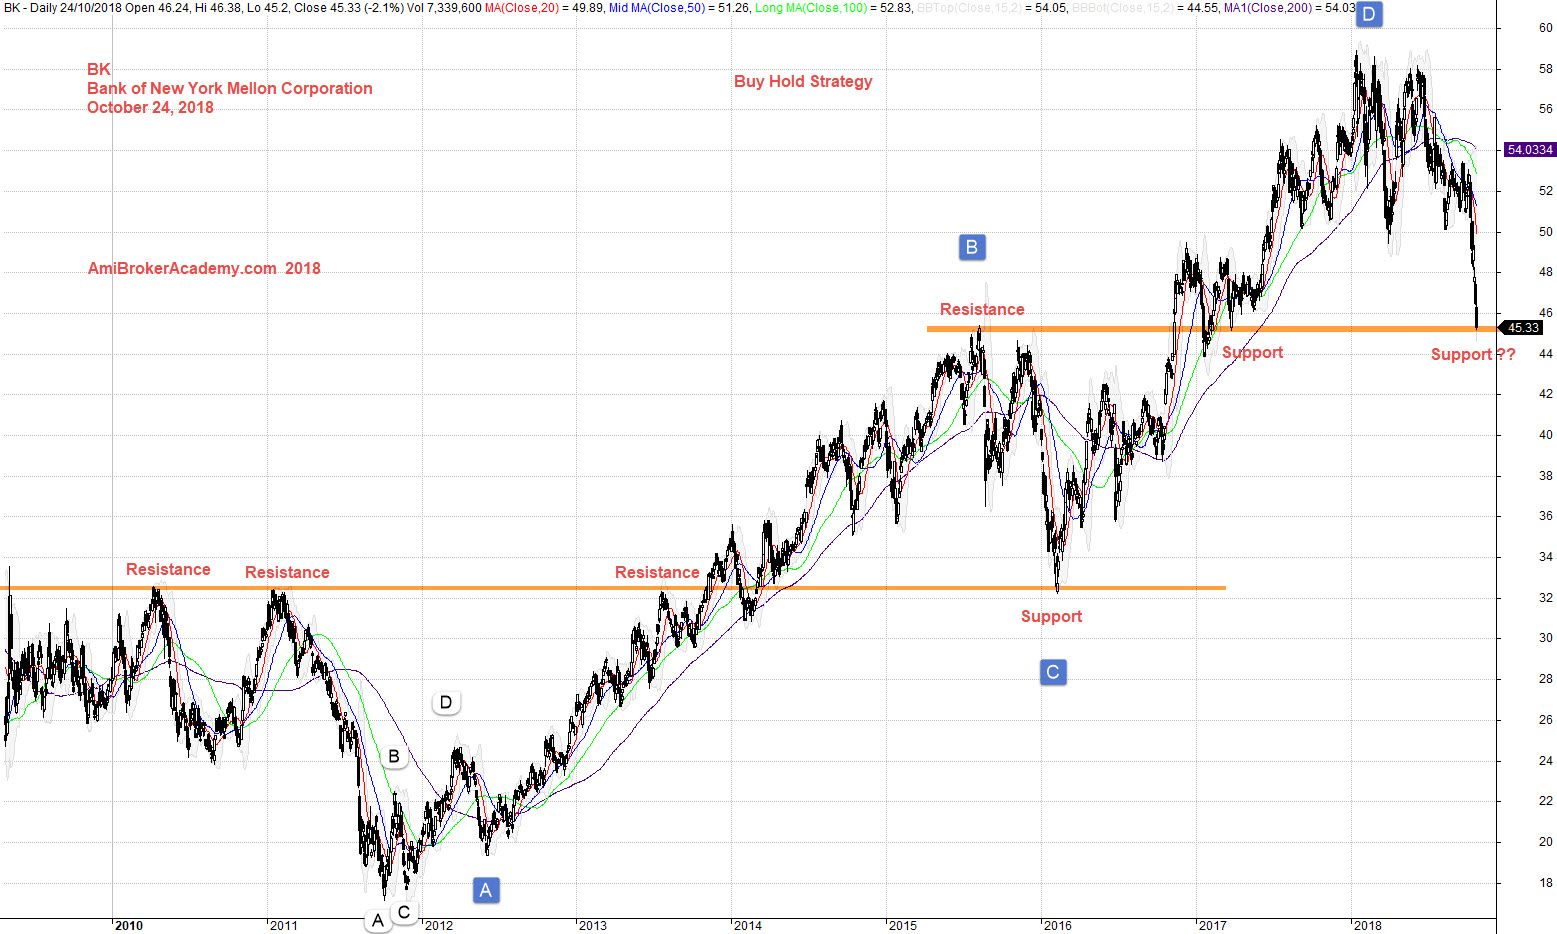
Study chart of Bank of New Mellon Corporation Daily stock price. See chart, picture worth a thousand words.
In this chart, the stock goes from 32 dollars to below 18 dollars, and the stock price rebounce up and breakout resistance and get resisted again at 45 dollars. You see market has good memory, the market remember where to stop. The price action fall the last resistance again before regain the energy to test the new high near 60 dollars. Now the price action pullback, can the last resistance stop the price from falling? Will see. See chart, picture worth a thousand words.
It is too early to know the price action get stop by the last resistance. Only until the price action make an U-turn. Wait, and see.
Think think got more things. Can you spot H M Gartley 222 pattern? A big one, a very big one. If you trade using this simple move. You will be alright. Talk again soon.
Manage your risk.
October 24, 2018 Bank of New York Mellon Corporation and Buy Hold Strategy
if you can see the full chart, “press Ctrl and -” to zoom out and see the entire chart.
Moses US Stock Chart Analysis
AmiBrokerAcademy.com
Disclaimer
The above result is for illustration purpose. It is not meant to be used for buy or sell decision. We do not recommend any particular stocks. If particular stocks of such are mentioned, they are meant as demonstration of Amibroker as a powerful charting software and MACD. Amibroker can program to scan the stocks for buy and sell signals.
These are script generated signals. Not all scan results are shown here. The MACD signal should use with price action. Users must understand what MACD and price action are all about before using them. If necessary you should attend a course to learn more on Technical Analysis (TA) and Moving Average Convergence Divergence, MACD.
Once again, the website does not guarantee any results or investment return based on the information and instruction you have read here. It should be used as learning aids only and if you decide to trade real money, all trading decision should be your own.