12 December, 2018
Think think got more things.
Many think the US stock are in the topping. True or true?! By just seeing one or two stocks you can not conclude. Let’s study more. And more.
Thanks for visiting the site.
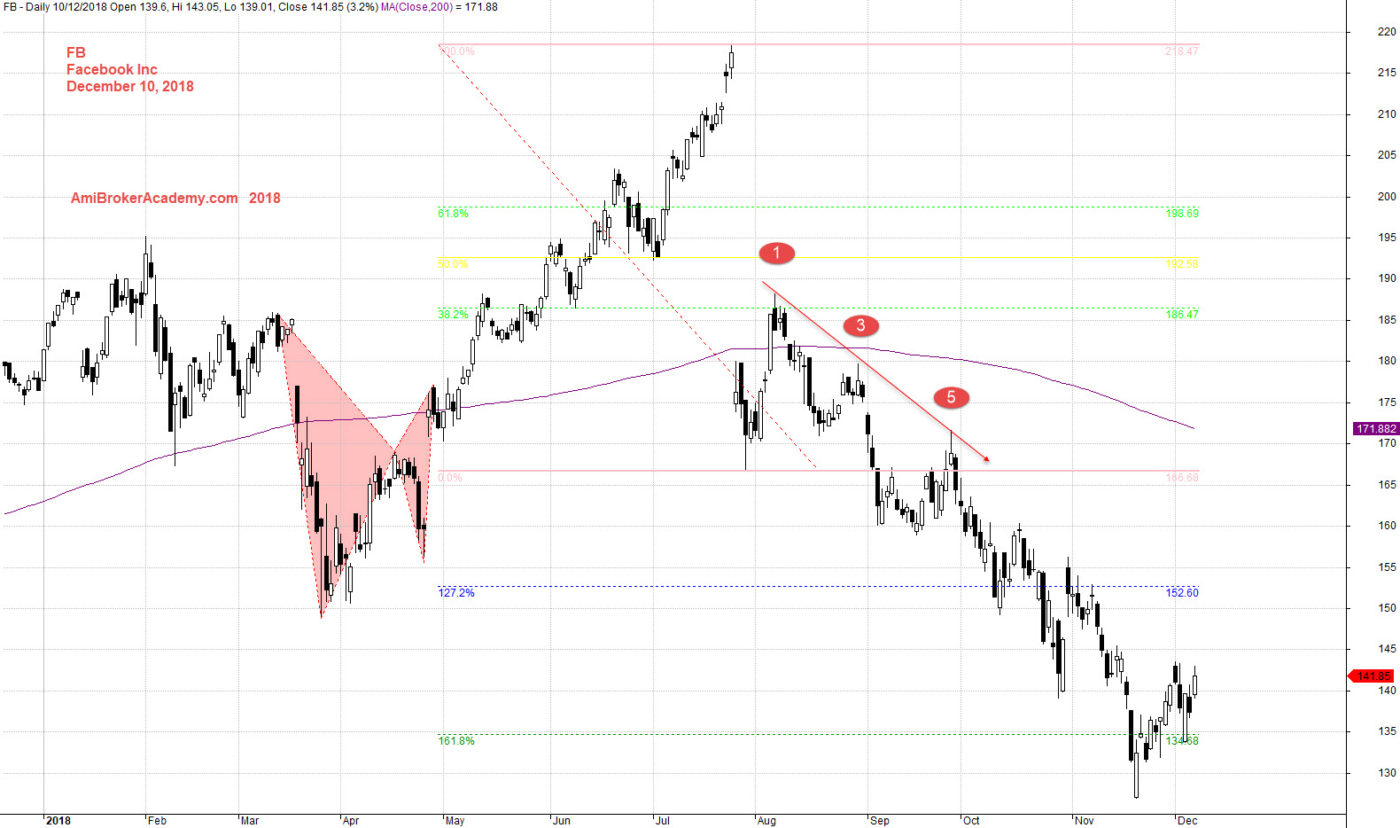
FB Facebook Inc Daily Chart
Buy Low Sell High
Equal to Buy Support Sell Resistance
We studied Facebook Inc stock earlier, now we like to add the Fibonacci Extension perspective. Swing high from 220 dollars to the low near 165 dollars. We see the price action pullback to 38% and stop. The price begin to move south, you see the price action continue to try to pullback, and forms a 1, 3, 5 pattern down. Price action react to 127% level, but weak, next 161% level. And test again at 161%.
Trade with your eyes open.
if you can see the full chart, “press Ctrl and -” to zoom out and see the entire chart.
Moses US Stock Chart Analysis
AmiBrokerAcademy.com
Disclaimer
The above result is for illustration purpose. It is not meant to be used for buy or sell decision. We do not recommend any particular stocks. If particular stocks of such are mentioned, they are meant as demonstration of Amibroker as a powerful charting software and MACD. Amibroker can program to scan the stocks for buy and sell signals.
These are script generated signals. Not all scan results are shown here. The MACD signal should use with price action. Users must understand what MACD and price action are all about before using them. If necessary you should attend a course to learn more on Technical Analysis (TA) and Moving Average Convergence Divergence, MACD.
Once again, the website does not guarantee any results or investment return based on the information and instruction you have read here. It should be used as learning aids only and if you decide to trade real money, all trading decision should be your own.