12 December, 2018
Think think got more things.
China is a major market for Apple. From Bloomberg data, the company get nearly 20 percent of its 2018 revenue from the China. What will happen will iPhones are banded in China, after Qualcomm won iPhone band in China.
Thanks for visiting the site.
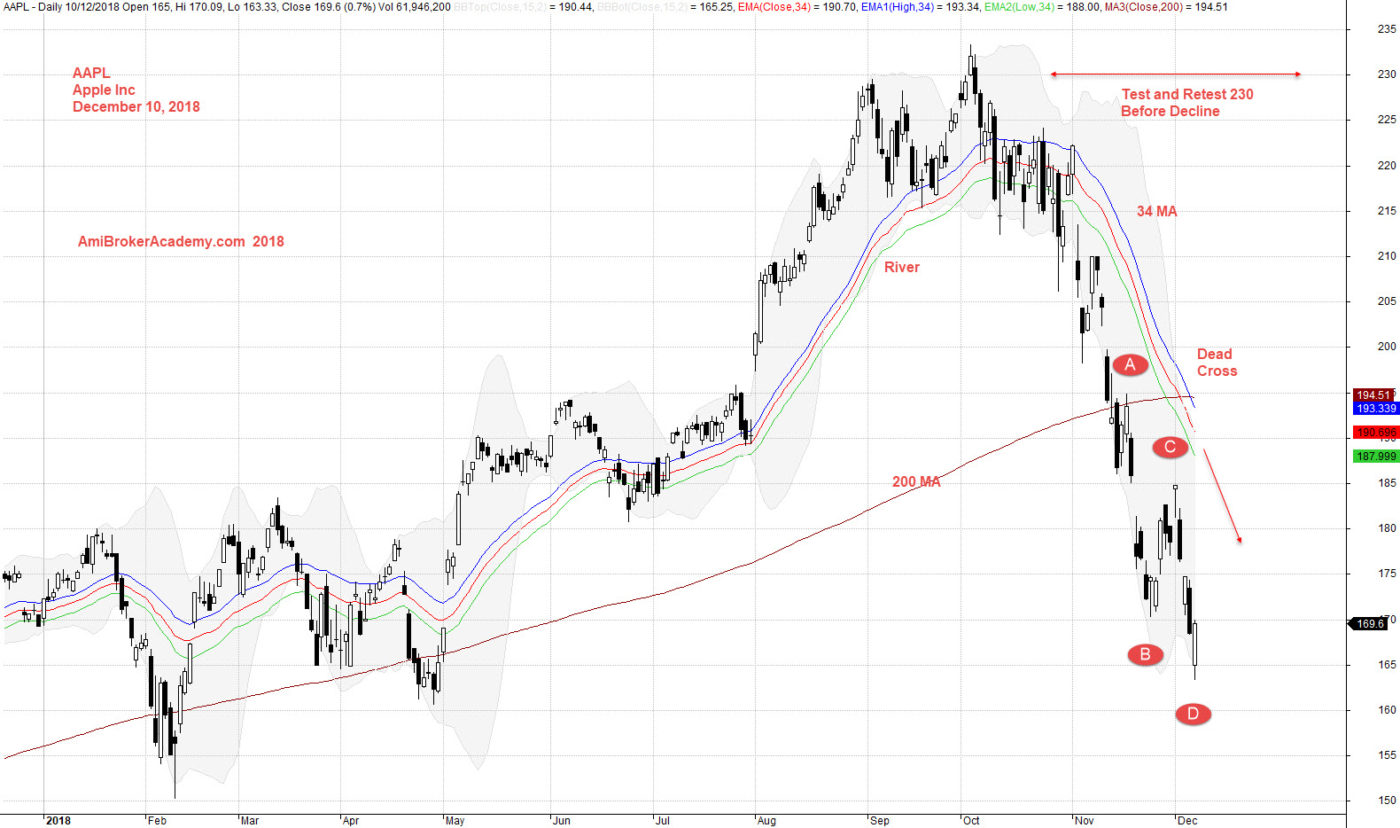
AAPL Apple Inc Daily Chart
Buy Low Sell High
Equal to Buy Support Sell Resistance
We see price action closed higher and higher and hit the peak at 230 dollars and again.
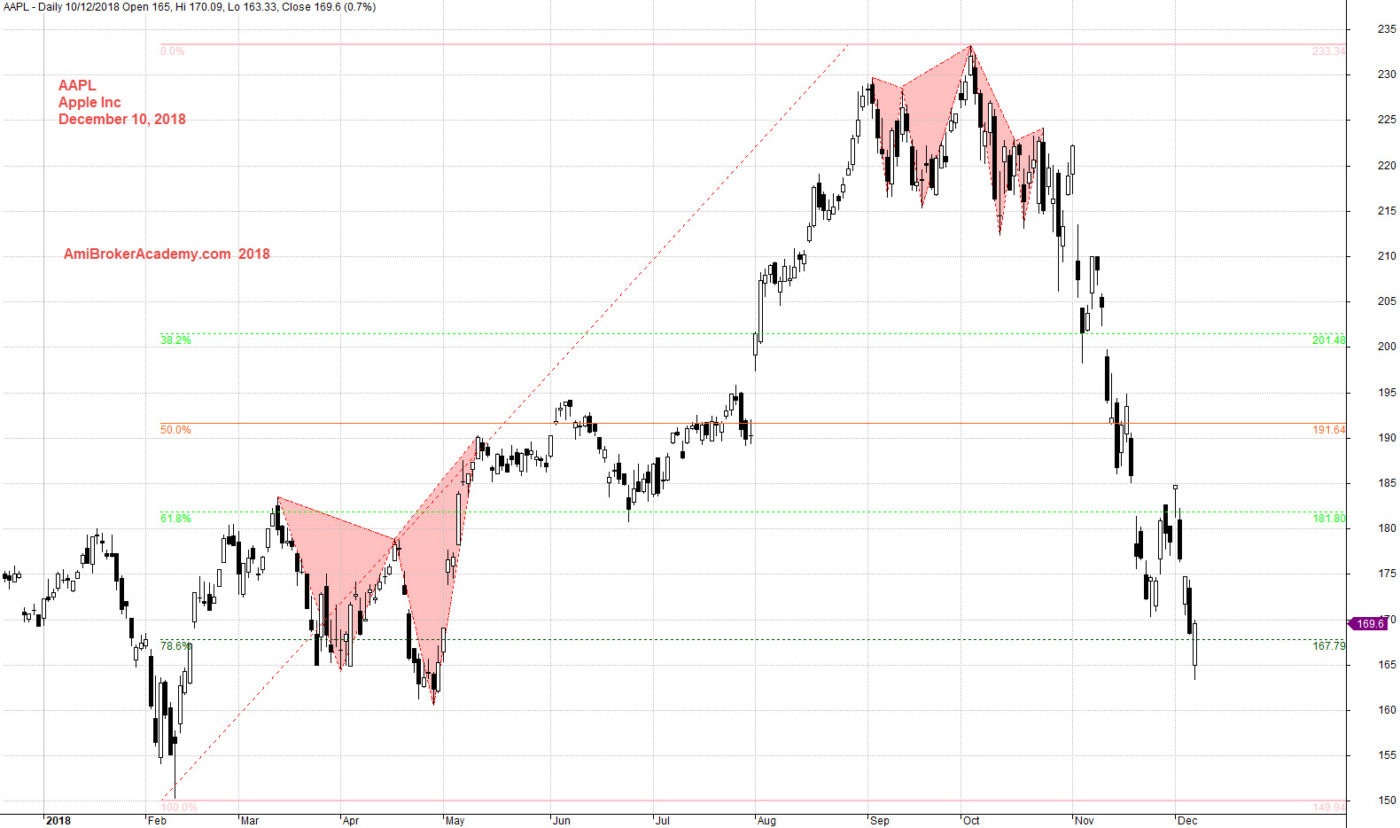
Price action after retest 230 dollars, and begin to fail and move south. You could identify some perfect H M Gartley pattern. Price action finally test 165 dollars.
If you study the chart again, you will notice that the price action close below slow moving average, dead cross.
Price action close below 34 MA, river and stay below 34 MA.
Trade with your eyes open.
if you can see the full chart, “press Ctrl and -” to zoom out and see the entire chart.
Now, if we will do a swing low to high, from 150 dollars to near 235 dollars, you will see the price action pullback and resisted by 78%. But the fall seems to be so strong, the price fall through the support.
Be aware that the price action may be retest the 2018 low. True or true?! Will see.
Moses US Stock Chart Analysis
AmiBrokerAcademy.com
Disclaimer
The above result is for illustration purpose. It is not meant to be used for buy or sell decision. We do not recommend any particular stocks. If particular stocks of such are mentioned, they are meant as demonstration of Amibroker as a powerful charting software and MACD. Amibroker can program to scan the stocks for buy and sell signals.
These are script generated signals. Not all scan results are shown here. The MACD signal should use with price action. Users must understand what MACD and price action are all about before using them. If necessary you should attend a course to learn more on Technical Analysis (TA) and Moving Average Convergence Divergence, MACD.
Once again, the website does not guarantee any results or investment return based on the information and instruction you have read here. It should be used as learning aids only and if you decide to trade real money, all trading decision should be your own.