24 August, 2018
Texas Calculator in the late 1970.

Source: Photo taken from Internet.
Thanks for visiting the site.
TXN Texas Instruments Incorporated Charting
See chart, picture worth a thousand words. Study Texas Instruments Incorporated stock price. You find an important level, resistance. Find the two boxes on the chart, the top is about the same level, resistance. From 2018, Texas stock price was trying hard to breakout above 120, but no success.
Trade with your eyes open. Can Texas continue to maintain the same resistance? May be, may be not. You probably know why? The tariff policy may be the reason for the stock price can not move any higher. True or true? Will see.
Manage your risk.
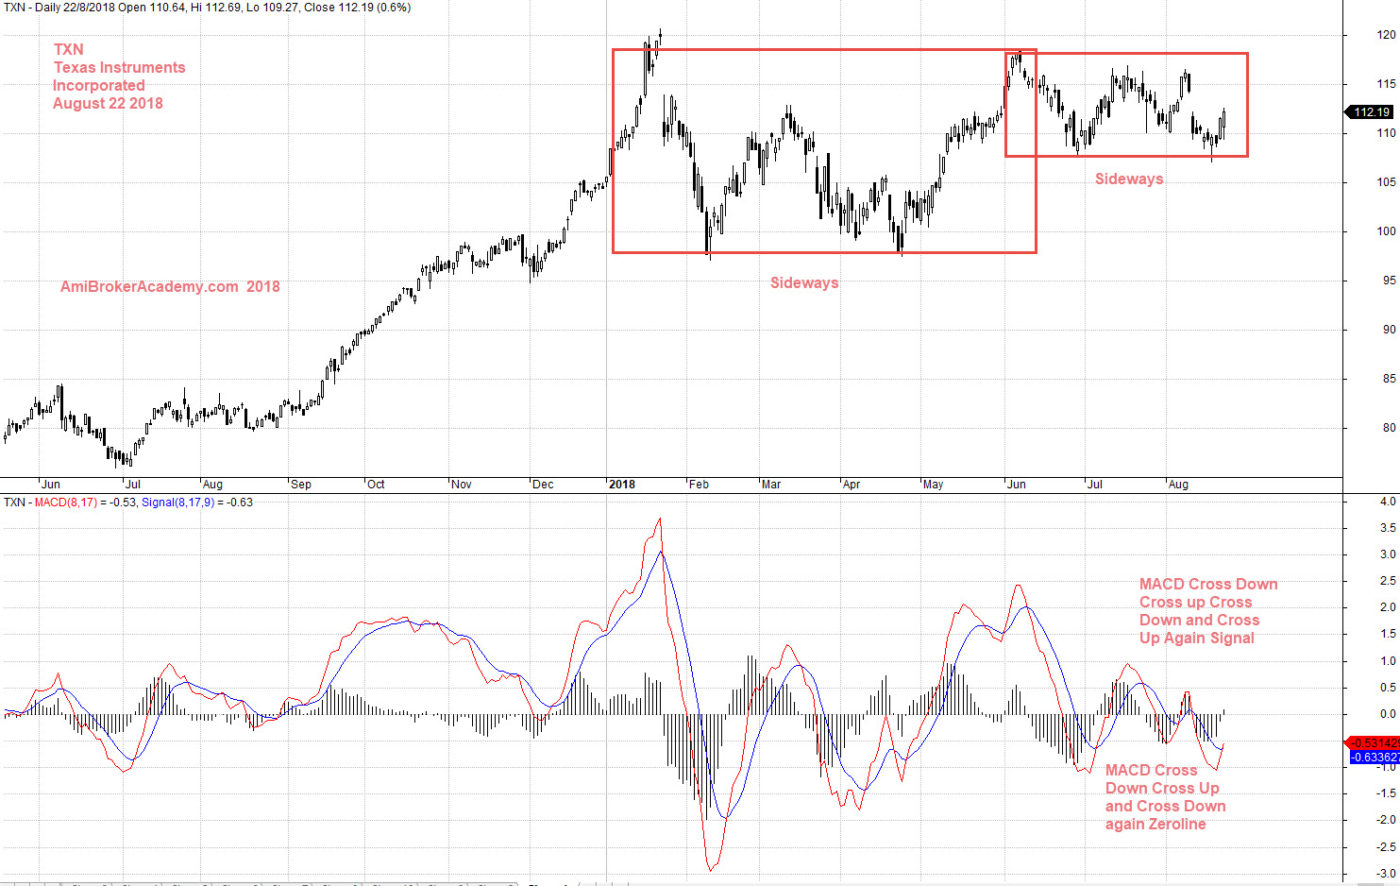
August 22,2018 Texas Instruments Incorporated and MACD
Moses US Stock Chart Analysis
AmiBrokerAcademy.com
Disclaimer
The above result is for illustration purpose. It is not meant to be used for buy or sell decision. We do not recommend any particular stocks. If particular stocks of such are mentioned, they are meant as demonstration of Amibroker as a powerful charting software and MACD. Amibroker can program to scan the stocks for buy and sell signals.
These are script generated signals. Not all scan results are shown here. The MACD signal should use with price action. Users must understand what MACD and price action are all about before using them. If necessary you should attend a course to learn more on Technical Analysis (TA) and Moving Average Convergence Divergence, MACD.
Once again, the website does not guarantee any results or investment return based on the information and instruction you have read here. It should be used as learning aids only and if you decide to trade real money, all trading decision should be your own.