24 August, 2018
Thanks for visiting the site.
EVA Enviva Partners Charting
See chart, picture worth a thousand words. Study Enviva Partners stock price. You find the price action is now on the bull trend after the deep in 2018. Now the price has breakou higher then the last high 32. Can the breakout hold and continue the bull trend.
If you study the chart, you will realize the from March to June, and AB leg, now the price action seems to completed it CD leg. Has the ABCD pattern, bullish ABCD pattern completed? If so, then the bear move will be here anytime. Be aware, trade with eyes open.
Manage your risk.
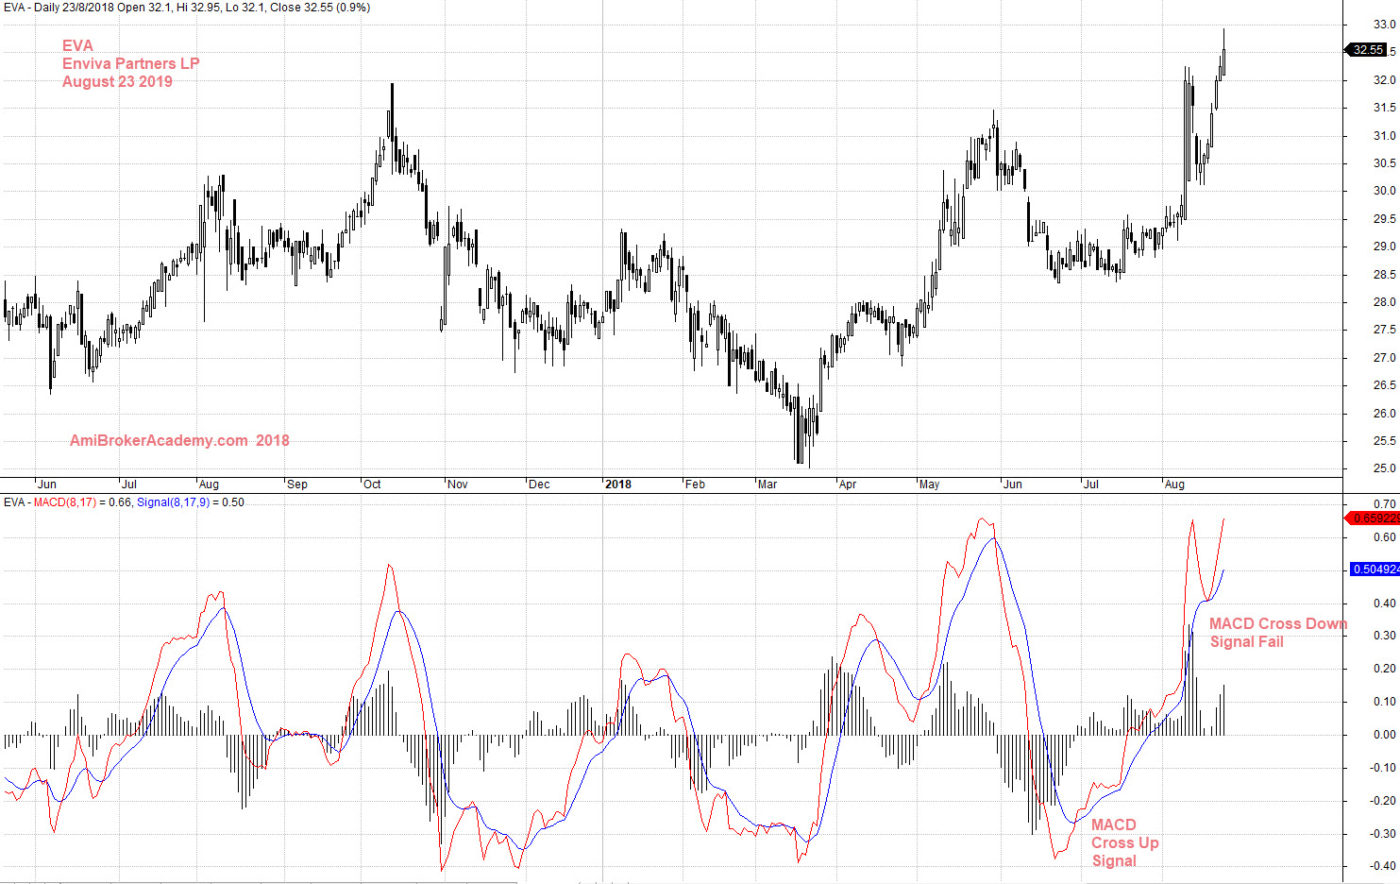
August 23, 2018 Enviva Partners and MACD
Moses US Stock Chart Analysis
AmiBrokerAcademy.com
Disclaimer
The above result is for illustration purpose. It is not meant to be used for buy or sell decision. We do not recommend any particular stocks. If particular stocks of such are mentioned, they are meant as demonstration of Amibroker as a powerful charting software and MACD. Amibroker can program to scan the stocks for buy and sell signals.
These are script generated signals. Not all scan results are shown here. The MACD signal should use with price action. Users must understand what MACD and price action are all about before using them. If necessary you should attend a course to learn more on Technical Analysis (TA) and Moving Average Convergence Divergence, MACD.
Once again, the website does not guarantee any results or investment return based on the information and instruction you have read here. It should be used as learning aids only and if you decide to trade real money, all trading decision should be your own.