March 11, 2018
CES China Electronics Show?!
This year (2018) the Consumer Electronics Show in Las Vegas had a third of the total exhibitors from China. Some joked that show this will be a “China Electronics Show”.
Truly, many of the companies went to US, especially the Silicon Valley to setup their company and make themself an US company. So, what is the different. At least you know these companies decide to stand home (China) to conduct their research, test, and manufacturing rather performs all these at the land of US and become a US China company. So, CES is CES, Consumer Electronics Show.
BAT – Baidu 百度, Alibaba 阿里巴巴 and Tencent 腾讯
We posted Tencent 腾讯 chart analysis, now we will analyse Baidu charting.
US Stock Chart Analysis
Ticket ID: BIDU Baidu Inc 百度 Charting and Channel
Reading chart using trendline, and copy and paste the trendline from the bottom to the top of the price action, … and forms channel. Frequently, the issue is the stock price is trending or not trending. …
Here, we see don’t see a bullish trend, as the price forms a higher low but the price action did not form a higher high. Let’s wait for the price action to evolve and push it to form the higher high. Wait? But from channel, we see the bullish trend.
Manage your risk!
Powerful Chart Software – AmiBroker
The following chart is produced using AmiBroker charting software. It is a powerful chart software. Anything, finance ticket you could download from Yahoo! Finance you could plot them, those you are interested all in a chart, so you could analyse them. See chart below like the popular Bitcoin.
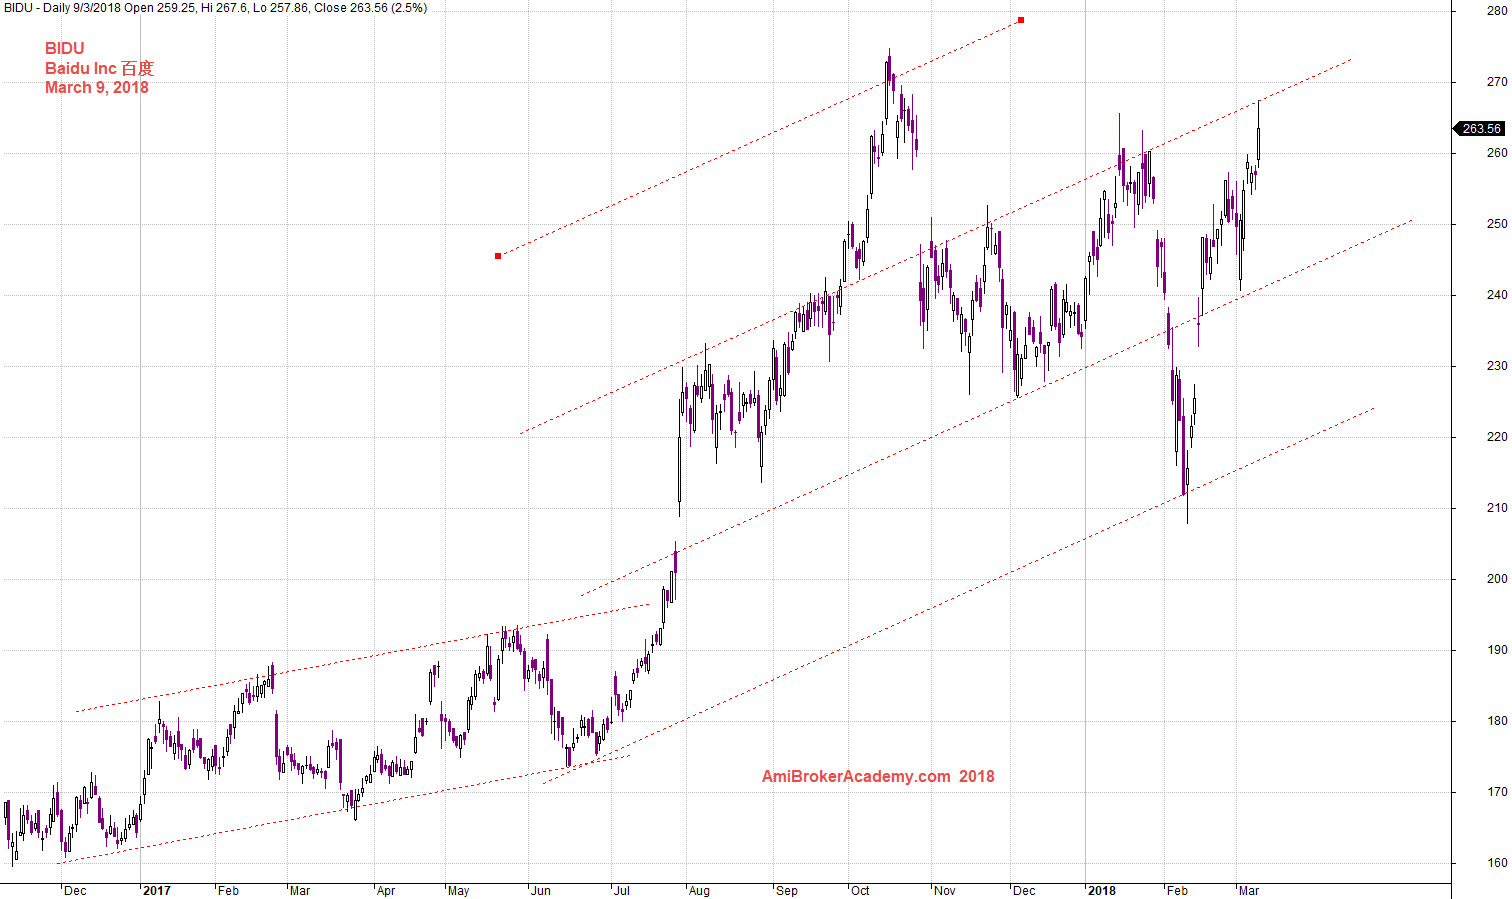
March 9, 2018 Baidu Inc 百度 and Channel
Baidu Inc 百度 Charting and Fibonacci Extension
Swing low to high, and draw a Fibo Extension, see chart. The bull was strong, the price action breakout higher and hight 161.8%. Then the price action pullback to test the 38%. …
Manage your risk.
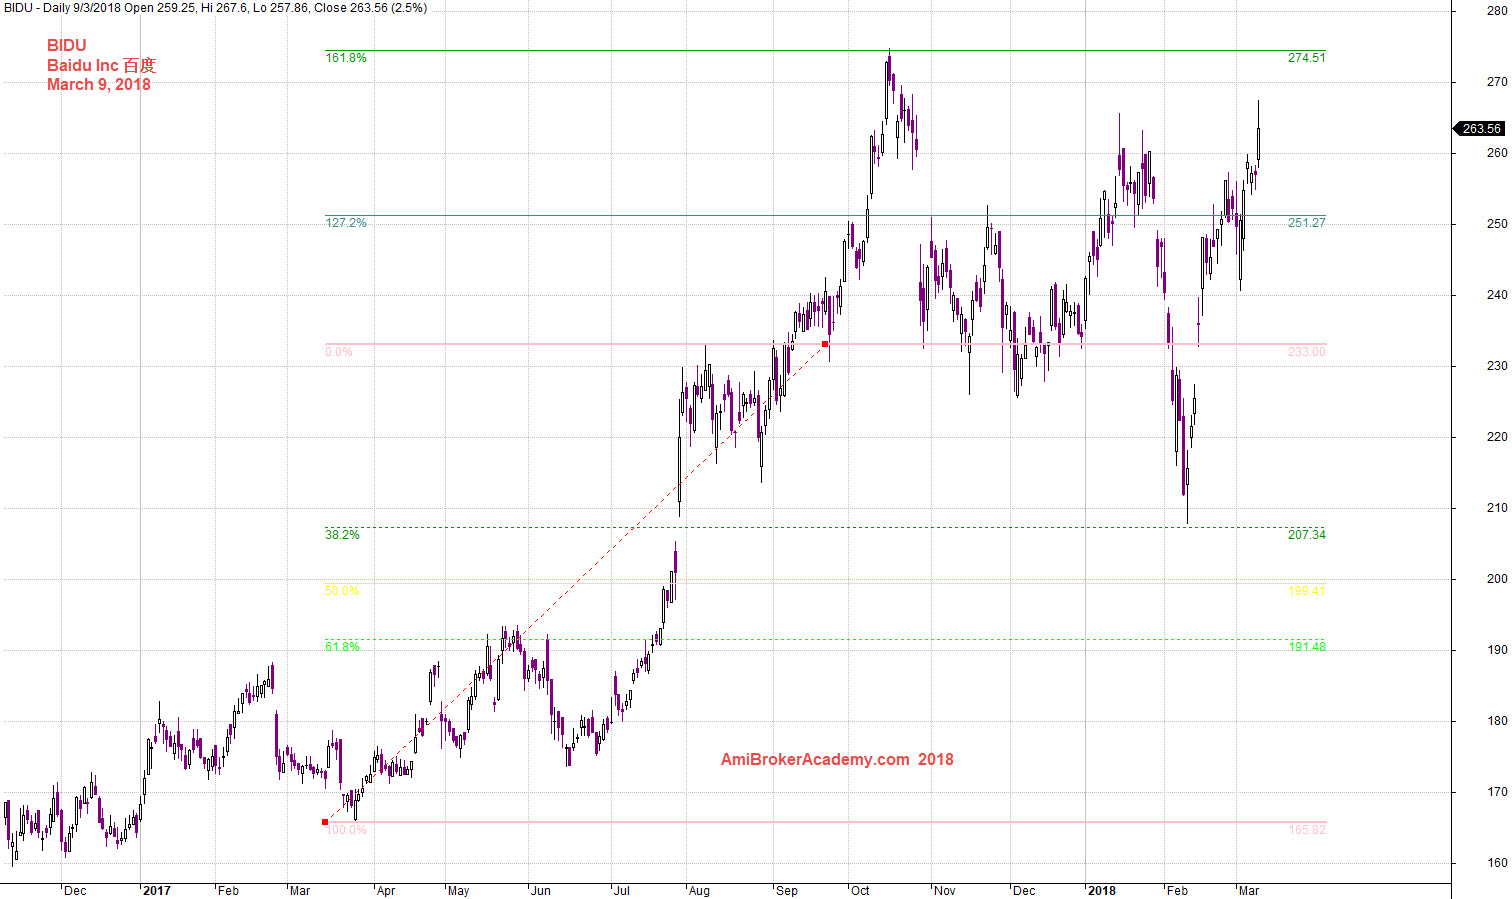
March 9, 2018 Baidu Inc and Fibo Extension
Moses US Stock Chart Analysis
AmiBrokerAcademy.com
Disclaimer
The above result is for illustration purpose. It is not meant to be used for buy or sell decision. We do not recommend any particular stocks. If particular stocks of such are mentioned, they are meant as demonstration of Amibroker as a powerful charting software and MACD. Amibroker can program to scan the stocks for buy and sell signals.
These are script generated signals. Not all scan results are shown here. The MACD signal should use with price action. Users must understand what MACD and price action are all about before using them. If necessary you should attend a course to learn more on Technical Analysis (TA) and Moving Average Convergence Divergence, MACD.
Once again, the website does not guarantee any results or investment return based on the information and instruction you have read here. It should be used as learning aids only and if you decide to trade real money, all trading decision should be your own.