March 11, 2018
Think Think Only
Any nontrader who looks at a chat will often conclude that trading is extremely easy. It was also commented by a professional trader that just buy or sell, not difficult as the stock price or any financial instrument the price is either goes up or comes down. So, just follow your heart. True or true? You know the best, the goal of most traders is make profits, or maximize profits. So, for example stock price, is either goes up or comes down. It is 50 50. But, if you study probability, even tossing of coin. Although getting a head or tail is 50 50, when the market is not with you, you can lost all your capital. Be aware.
Oscillator Moving Average Convergence Divergence
MACD is a popular trend following momentum indicator that shows the relationship of two moving averages of prices action; the MACD line and signal line.
Four MACD Signals:
- Crossovers – Sell Strategy, MACD crosses below the signal line. Buy Strategy, MACD rallies above the signal line. It is advisable to wait for confirmation to reduce possible whipsaw.
- Divergence – The security price action diverges from the MACD. It signals the end of the current trend.
- Cross Zero Line – MACD moves above or below zero line. Upward trend: Cross above zero line, short MA above long MA. Downward trend: Cross below zero line, short MA below long MA.
- Dramatic rise or fall – MACD rises or decline dramatically – when the shorter moving average pulls away from the longer-term moving average – Oversold or Overbought.
Free One-day US Stock MACD Screening Results for 11 March 2018
Remember all setup can fail. This is true for all indicators. It is also true for MACD signals setup. See some of the MACD setup fail examples on this website.
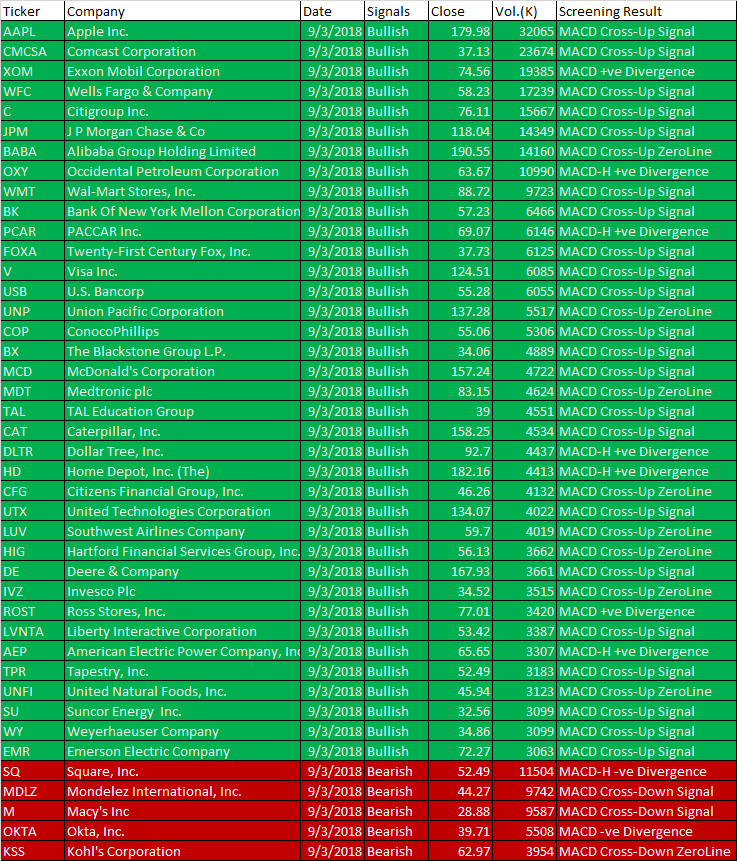
March 9, 2018 US Stock One-day MACD Scan Signals
- MACD line crosses above MACD signal – Bullish trend
- MACD line crosses above zero line – Bullish trend
- MACD Histogram +ve Divergence – Bullish trend
- MACD line crosses below MACD signal – Bearish trend
- MACD line crosses below zero line – Bearish trend
- MACD Histogram -ve Divergence – Bearish trend
| Ticker | Company | Date | Signals | Close | Vol.(K) | Screening Result |
| AAPL | Apple Inc. | 9/3/2018 | Bullish | 179.98 | 32065 | MACD Cross-Up Signal |
| CMCSA | Comcast Corporation | 9/3/2018 | Bullish | 37.13 | 23674 | MACD Cross-Up Signal |
| XOM | Exxon Mobil Corporation | 9/3/2018 | Bullish | 74.56 | 19385 | MACD +ve Divergence |
| WFC | Wells Fargo & Company | 9/3/2018 | Bullish | 58.23 | 17239 | MACD Cross-Up Signal |
| C | Citigroup Inc. | 9/3/2018 | Bullish | 76.11 | 15667 | MACD Cross-Up Signal |
| JPM | J P Morgan Chase & Co | 9/3/2018 | Bullish | 118.04 | 14349 | MACD Cross-Up Signal |
| BABA | Alibaba Group Holding Limited | 9/3/2018 | Bullish | 190.55 | 14160 | MACD Cross-Up ZeroLine |
| OXY | Occidental Petroleum Corporation | 9/3/2018 | Bullish | 63.67 | 10990 | MACD-H +ve Divergence |
| WMT | Wal-Mart Stores, Inc. | 9/3/2018 | Bullish | 88.72 | 9723 | MACD Cross-Up Signal |
| BK | Bank Of New York Mellon Corporation (The) | 9/3/2018 | Bullish | 57.23 | 6466 | MACD Cross-Up Signal |
| PCAR | PACCAR Inc. | 9/3/2018 | Bullish | 69.07 | 6146 | MACD-H +ve Divergence |
| FOXA | Twenty-First Century Fox, Inc. | 9/3/2018 | Bullish | 37.73 | 6125 | MACD Cross-Up Signal |
| V | Visa Inc. | 9/3/2018 | Bullish | 124.51 | 6085 | MACD Cross-Up Signal |
| USB | U.S. Bancorp | 9/3/2018 | Bullish | 55.28 | 6055 | MACD Cross-Up Signal |
| UNP | Union Pacific Corporation | 9/3/2018 | Bullish | 137.28 | 5517 | MACD Cross-Up ZeroLine |
| COP | ConocoPhillips | 9/3/2018 | Bullish | 55.06 | 5306 | MACD Cross-Up Signal |
| BX | The Blackstone Group L.P. | 9/3/2018 | Bullish | 34.06 | 4889 | MACD Cross-Up Signal |
| MCD | McDonald’s Corporation | 9/3/2018 | Bullish | 157.24 | 4722 | MACD Cross-Up Signal |
| MDT | Medtronic plc | 9/3/2018 | Bullish | 83.15 | 4624 | MACD Cross-Up ZeroLine |
| TAL | TAL Education Group | 9/3/2018 | Bullish | 39 | 4551 | MACD Cross-Up Signal |
| CAT | Caterpillar, Inc. | 9/3/2018 | Bullish | 158.25 | 4534 | MACD Cross-Up Signal |
| DLTR | Dollar Tree, Inc. | 9/3/2018 | Bullish | 92.7 | 4437 | MACD-H +ve Divergence |
| HD | Home Depot, Inc. (The) | 9/3/2018 | Bullish | 182.16 | 4413 | MACD-H +ve Divergence |
| CFG | Citizens Financial Group, Inc. | 9/3/2018 | Bullish | 46.26 | 4132 | MACD Cross-Up ZeroLine |
| UTX | United Technologies Corporation | 9/3/2018 | Bullish | 134.07 | 4022 | MACD Cross-Up Signal |
| LUV | Southwest Airlines Company | 9/3/2018 | Bullish | 59.7 | 4019 | MACD Cross-Up ZeroLine |
| HIG | Hartford Financial Services Group, Inc. (The) | 9/3/2018 | Bullish | 56.13 | 3662 | MACD Cross-Up ZeroLine |
| DE | Deere & Company | 9/3/2018 | Bullish | 167.93 | 3661 | MACD Cross-Up Signal |
| IVZ | Invesco Plc | 9/3/2018 | Bullish | 34.52 | 3515 | MACD Cross-Up ZeroLine |
| ROST | Ross Stores, Inc. | 9/3/2018 | Bullish | 77.01 | 3420 | MACD +ve Divergence |
| LVNTA | Liberty Interactive Corporation | 9/3/2018 | Bullish | 53.42 | 3387 | MACD Cross-Up Signal |
| AEP | American Electric Power Company, Inc. | 9/3/2018 | Bullish | 65.65 | 3307 | MACD-H +ve Divergence |
| TPR | Tapestry, Inc. | 9/3/2018 | Bullish | 52.49 | 3183 | MACD Cross-Up Signal |
| UNFI | United Natural Foods, Inc. | 9/3/2018 | Bullish | 45.94 | 3123 | MACD Cross-Up ZeroLine |
| SU | Suncor Energy Inc. | 9/3/2018 | Bullish | 32.56 | 3099 | MACD Cross-Up Signal |
| WY | Weyerhaeuser Company | 9/3/2018 | Bullish | 34.86 | 3099 | MACD Cross-Up Signal |
| EMR | Emerson Electric Company | 9/3/2018 | Bullish | 72.27 | 3063 | MACD Cross-Up Signal |
| SQ | Square, Inc. | 9/3/2018 | Bearish | 52.49 | 11504 | MACD-H -ve Divergence |
| MDLZ | Mondelez International, Inc. | 9/3/2018 | Bearish | 44.27 | 9742 | MACD Cross-Down Signal |
| M | Macy’s Inc | 9/3/2018 | Bearish | 28.88 | 9587 | MACD Cross-Down Signal |
| OKTA | Okta, Inc. | 9/3/2018 | Bearish | 39.71 | 5508 | MACD -ve Divergence |
| KSS | Kohl’s Corporation | 9/3/2018 | Bearish | 62.97 | 3954 | MACD Cross-Down ZeroLine |
Have fun!Users must understand what MACD is all about before using the results.
Moses US Stock Scan
AmiBroker Academy.com
Disclaimer:
The above result is for illustration purpose. It is not meant to be used for buy or sell decision. We do not recommend any particular stocks. If particular stocks of such are mentioned, they are meant as demonstration of Amibroker as a powerful charting software and MACD. Amibroker can program to scan the stocks for buy and sell signals.
These are script generated signals. Not all scan results are shown here. The MACD signal should use with price action. Users must understand what MACD and price action are all about before using them. If necessary you should attend a course to learn more on Technical Analysis (TA) and Moving Average Convergence Divergence, MACD.
Once again, the website does not guarantee any results or investment return based on the information and instruction you have read here. It should be used as learning aids only and if you decide to trade real money, all trading decision should be your own.