22 January 2021
Welcome!
Welcome to AmiBroker Academy dot com, amibrokeracademy.com. Thanks for your search and landed yourself here.
TWST | Twist Bioscience Corporation and Bollinger Bands and Moving Averages
Picture worth a thousand words. Study Twist Bioscience Corp stock chart.
This is a strong bull trend stock. Trade with eyes open.
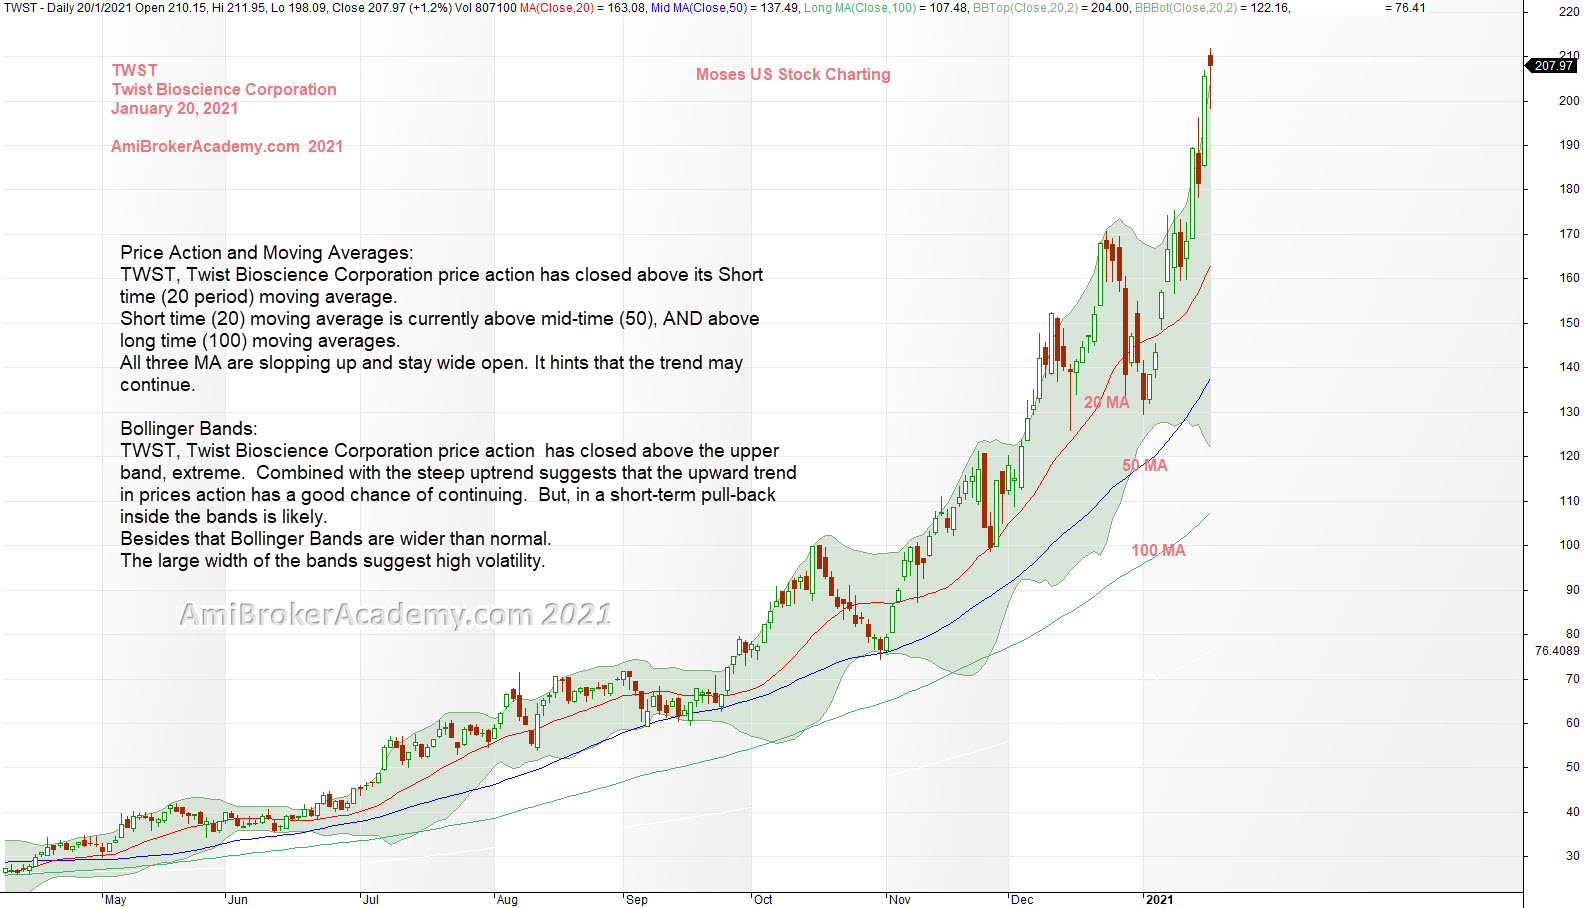
TWST, Twist Bioscience Corporation price action has closed above its Short time (20 period), Mid time (50) and Long time (100) moving averages.
Short time (20) moving average is currently above mid-time (50), AND above long time (100) moving averages.
All three 20, 50 and 100 MA are slopping up, and the slop is steep too. Besides that the three MAs are staying wide open. It is suggested that in the short time, the trend will continue.
If you add Bollinger Bands,
TWST, Twist Bioscience Corporation price action has closed above the upper band. When combined with the steep uptrend suggests that the upward trend in prices action has a very good chance to continue. However, a short-term it is likely to pull-back inside the bands before spring higher.
Bollinger Bands are wider than normal. The wider the bands suggest high volatility. Manage your risk.
The commentary is not a recommendation to buy or sell. We just read out loud the price action.
Have fun!
Moses Free Stock Charting
Official AmiBrokerAcademy.com Charting
Disclaimer
The above result is for illustration purpose. It is not meant to be used for buy or sell decision. We do not recommend any particular stocks. If particular stocks of such are mentioned, they are meant as demonstration of Amibroker as a powerful charting software and MACD. Amibroker can program to scan the stocks for buy and sell signals.
These are script generated signals. Not all scan results are shown here. The MACD signal should use with price action. Users must understand what MACD and price action are all about before using them. If necessary you should attend a course to learn more on Technical Analysis (TA) and Moving Average Convergence Divergence, MACD.
Once again, the website does not guarantee any results or investment return based on the information and instruction you have read here. It should be used as learning aids only and if you decide to trade real money, all trading decision should be your own.
We learn from many past and present great traders. Kudo to these master.