22 January 2021
Welcome!
Welcome to AmiBroker Academy dot com, amibrokeracademy.com. Thanks for your search and landed yourself here.
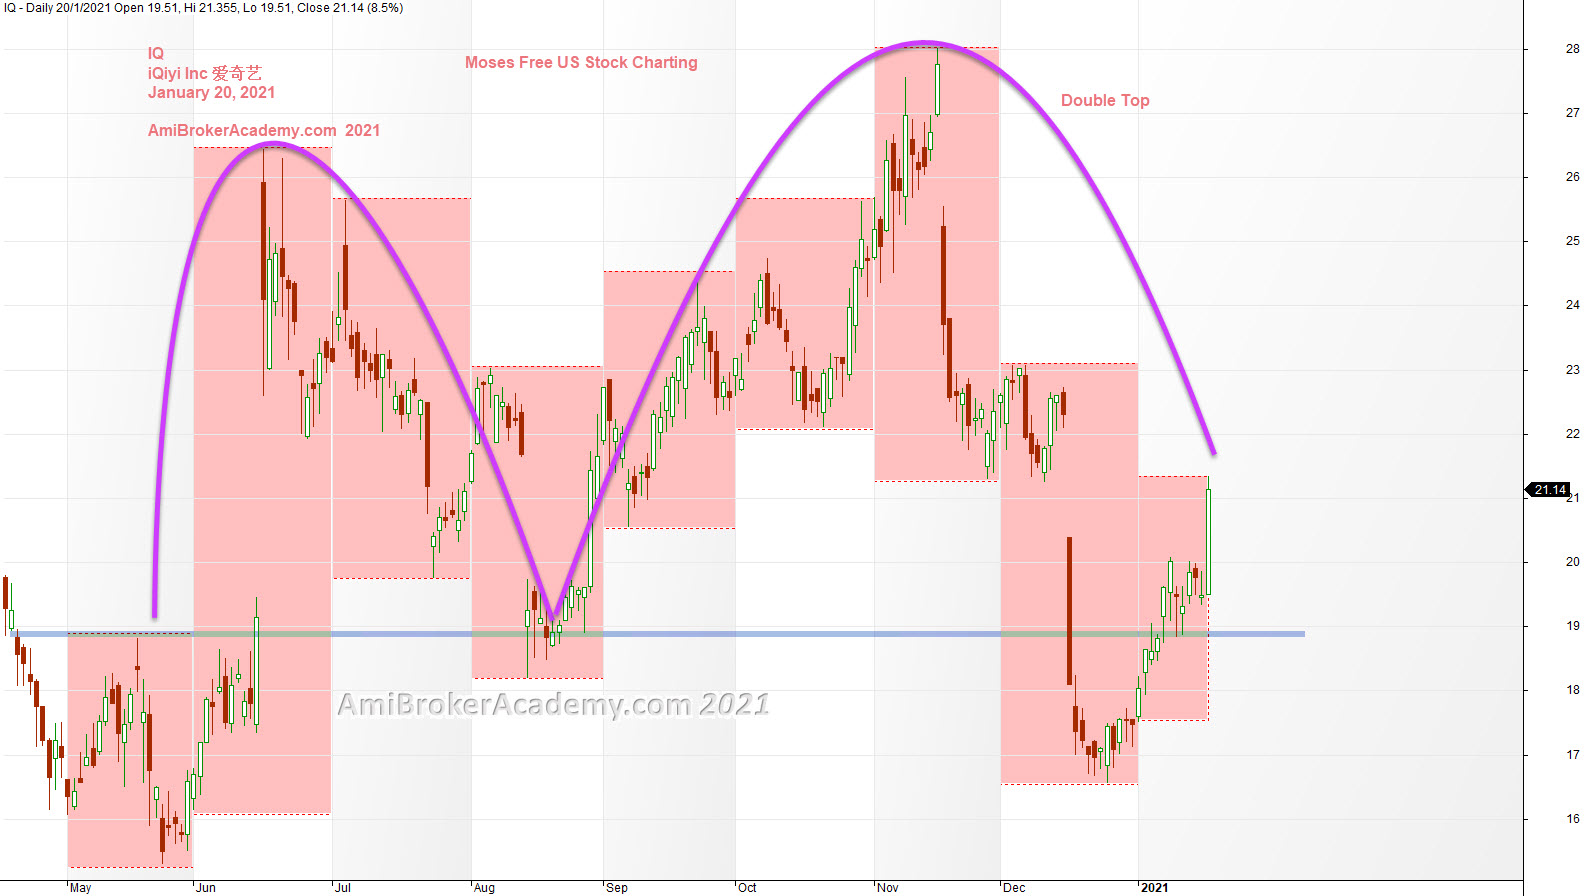
IQ | 20210120 iQiyi Inc 爱奇艺 and Boxes and Eight Months Data
Picture worth a thousand words. Study iQiyi Inc 爱奇艺 stock chart.
This is a difficult stock to trade. See chart, price action goes from low to high to low and high again.
Trading this stock, you must have very clear mind. Like buy low and sell high. You will wait for the price action to pullback, and buy near support with a bullish confirmation.
You can see the high was tested twice, forms double top.
Manage your risk and trade with eyes open.
Have fun!
Moses Free Stock Charting
Official AmiBrokerAcademy.com Charting
Disclaimer
The above result is for illustration purpose. It is not meant to be used for buy or sell decision. We do not recommend any particular stocks. If particular stocks of such are mentioned, they are meant as demonstration of Amibroker as a powerful charting software and MACD. Amibroker can program to scan the stocks for buy and sell signals.
These are script generated signals. Not all scan results are shown here. The MACD signal should use with price action. Users must understand what MACD and price action are all about before using them. If necessary you should attend a course to learn more on Technical Analysis (TA) and Moving Average Convergence Divergence, MACD.
Once again, the website does not guarantee any results or investment return based on the information and instruction you have read here. It should be used as learning aids only and if you decide to trade real money, all trading decision should be your own.
We learn from many past and present great traders. Kudo to these master.