July 6, 2017
Six Months Stock Performance
Let’s look back the last six months, as we just start to cross July.
TSMC and First Half of 2017 Stock Price Performance of Taiwan Semi Manufacturing Company
Picture worth a thousand words.
Just in six months, TSMC has already breakout (BO) the resistance and near double the high. Now, the price action has pullback (PB) near the resistance.
TSMC is the number one semiconductor front end outsource company.
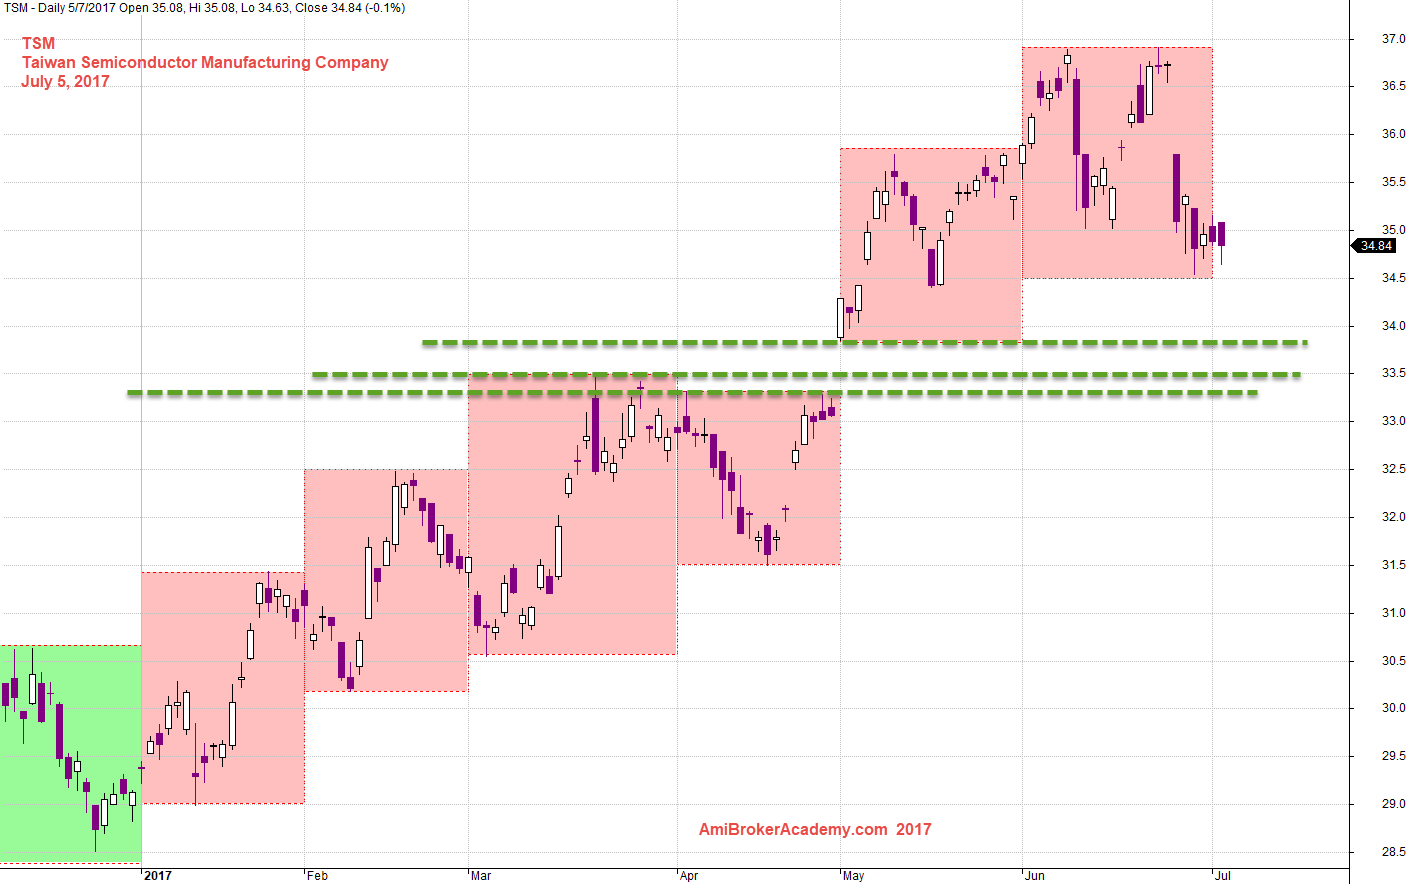
July 5, 2017 Taiwan Semicon Manufacturing Company and Six Months Stock Performance
TSMC Taiwan Semiconductor Manufacturing Company and Support Resistance
If you are sharp, you will find the following chart is different from the one above. Not just the twelve months vs six months, but the resistance is also different.
The following chart,the resistance is the high of the second half of 2016, it took four five months to breakout successfully. Then the price action goes double from the low in second half of 2016.
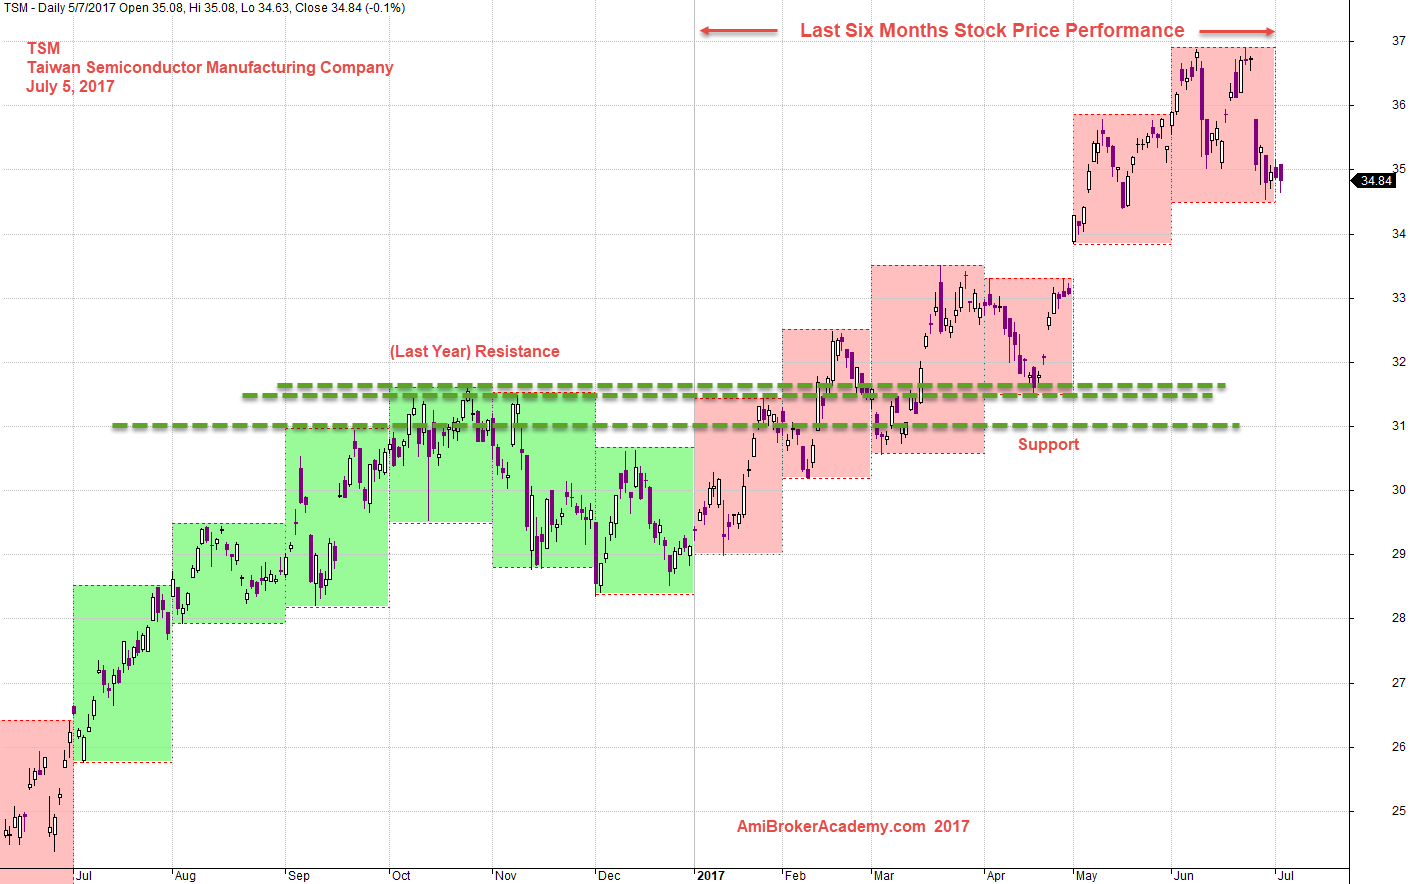
July 5, 2017 Taiwan Semiconductor Company and 2017 First Half and Support Resistance
TSMC and Channels and MACD Signals
The first half of 2017 is more bullish then 2016 second half. See chart for details.
Check the MACD signals as well.
Have fun!
The way we analysis the chart is like putting two chart next to each others. To compare the traders emotions six months before and six months after, we break the twelve months chart into two parts. See the way we draw the channels.
Check out a previous few posts for more.

July 5, 2017 Taiwan Semicon Manufacturing Co and MACD signals
Risk
If you can wait, remember professional likes to wait for retracement. This will minimize the risk, as your stop loss will be smaller. So, picture worth a thousand words. In this case study, if you wait for pullback, you will have a handson gain; you can enjoy a big move in short time. Waw!
Professional Try Not to Buy and Sell Higher!
Professional trade on retracement.
What if you thought you miss and you jump in. You may be ended up you can not sleep for a days. … As you might be buy high and expecting to sell higher.
Moses
AmiBrokerAcademy.com
Disclaimer
The above result is for illustration purpose. It is not meant to be used for buy or sell decision. We do not recommend any particular stocks. If particular stocks of such are mentioned, they are meant as demonstration of Amibroker as a powerful charting software and MACD. Amibroker can program to scan the stocks for buy and sell signals.
These are script generated signals. Not all scan results are shown here. The MACD signal should use with price action. Users must understand what MACD and price action are all about before using them. If necessary you should attend a course to learn more on Technical Analysis (TA) and Moving Average Convergence Divergence, MACD.
Once again, the website does not guarantee any results or investment return based on the information and instruction you have read here. It should be used as learning aids only and if you decide to trade real money, all trading decision should be your own.