July 6, 2017
Six Months Stock Performance
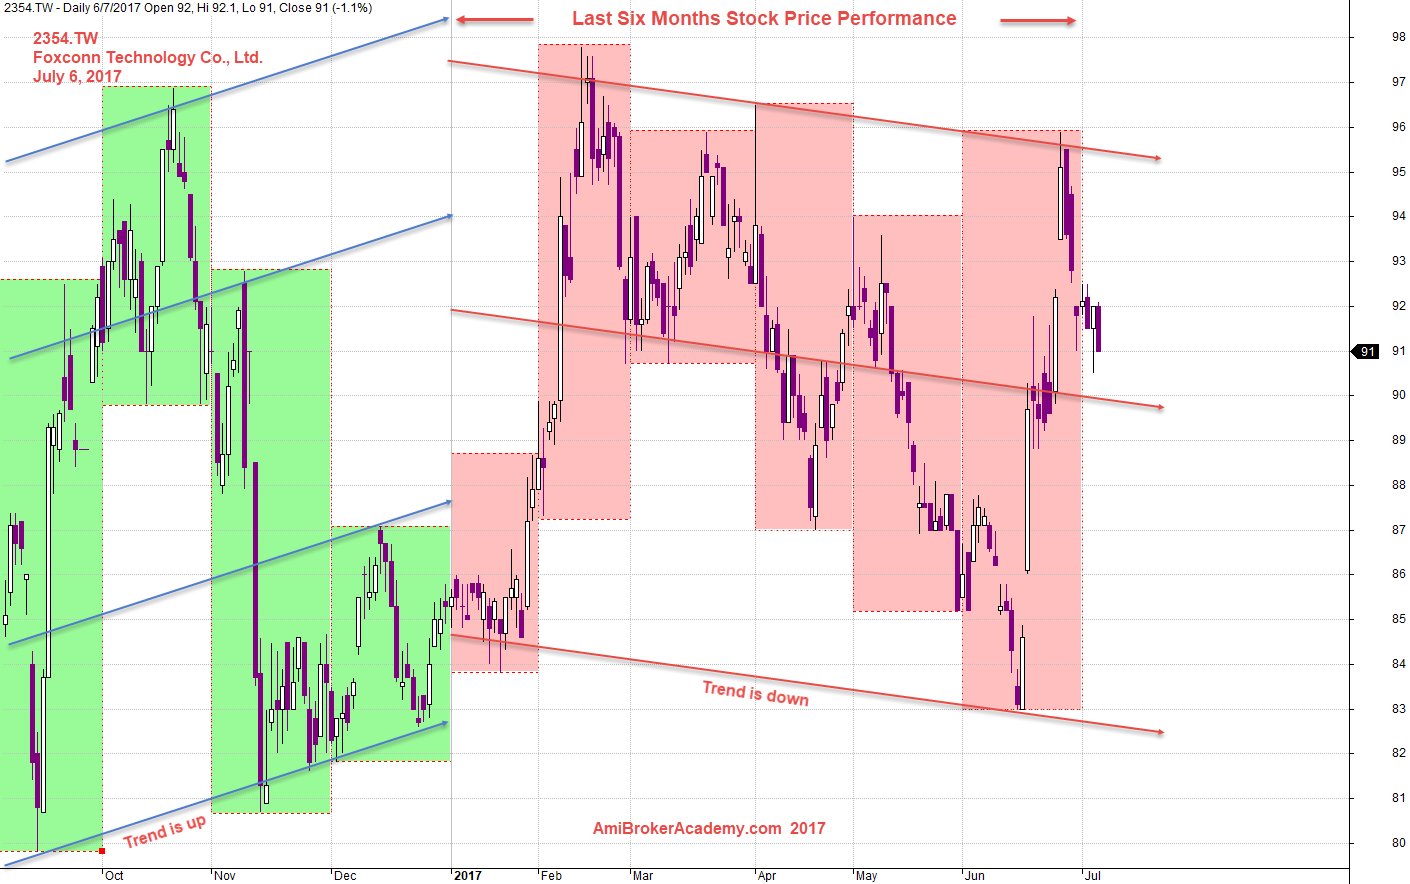
Let’s look back the last six months, as we just start to cross July.
Foxconn Technology and First Half of 2017 Stock Price Performance
Picture worth a thousand words.
Foxconn is the iPhone outsource manufacturing. The first six months, Foxconn has declined rally. Now, the price action has pullback (PB) to retest the resistance, upper channel. See chart, this is the third retest. Needless to think, the price action try to breakout higher.
July 6, 2017 Foxconn Technology and 2017 First Half Results
Foxconn and Channels
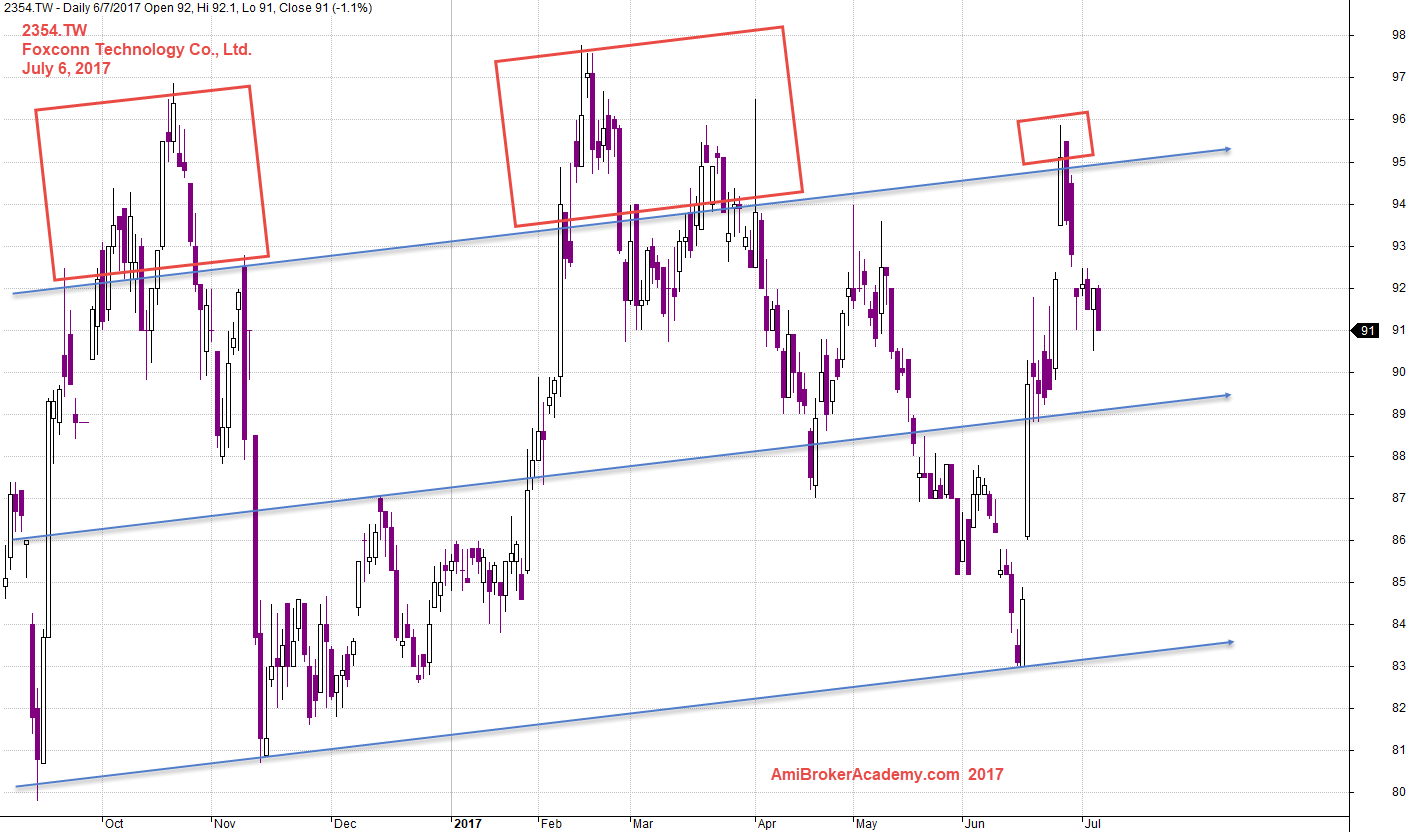
Have you find the different in the following chart? If you are sharp, you will find the following chart is different from the one above. The above chart we break up the chart in two parts, and the following we see the whole chart as one. Why? Split thinking! Sorry, not to create another term for the confuse enough world of learning.
The following chart, when we connecting the low and cop and paste to the high. We see bulls trapped a few times, since last October, then the start of 2017. Each time the market put hope on the stock, the news sent the price down again. The traders confident were weaken each time.
Now, from the six months view, the trend is starting to decline. Watchout.
July 6, 2017 Foxconn Technology and Channels and Trapped
2354.TW Foxconn Technology and MACD Signals
We see high low, and MACD cross up signal, MACD cross up zeroline.
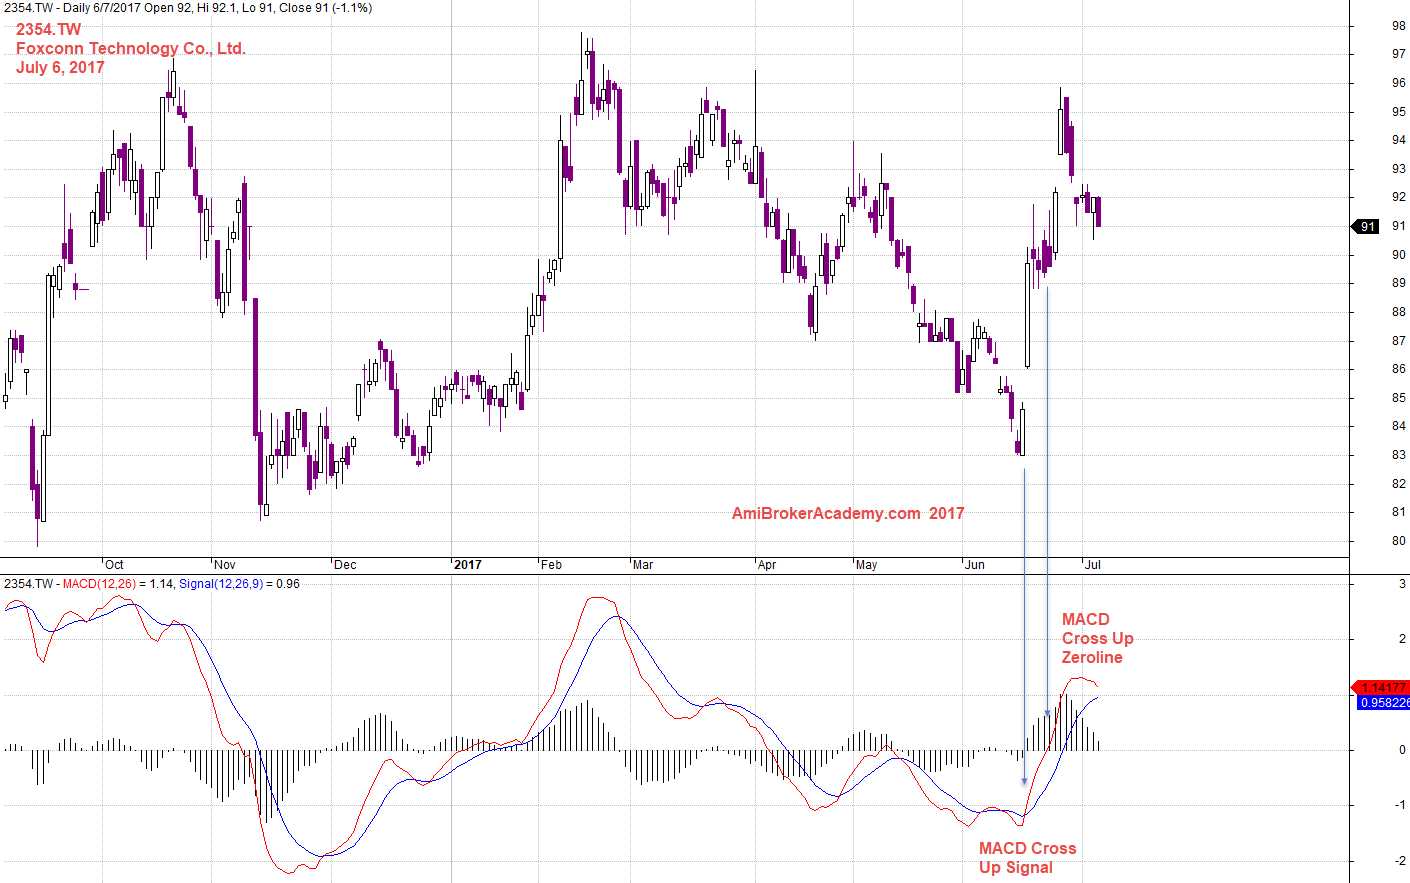
July 6, 2017 Foxconn Technology and MACD Signals
Risk
If you can wait, remember professional likes to wait for retracement. This will minimize the risk, as your stop loss will be smaller. So, picture worth a thousand words. In this case study, if you wait for pullback, you will have a handson gain; you can enjoy a big move in short time. Waw!
Professional Try Not to Buy and Sell Higher!
Professional trade on retracement.
What if you thought you miss and you jump in. You may be ended up you can not sleep for a days. … As you might be buy high and expecting to sell higher.
Moses
AmiBrokerAcademy.com
Disclaimer
The above result is for illustration purpose. It is not meant to be used for buy or sell decision. We do not recommend any particular stocks. If particular stocks of such are mentioned, they are meant as demonstration of Amibroker as a powerful charting software and MACD. Amibroker can program to scan the stocks for buy and sell signals.
These are script generated signals. Not all scan results are shown here. The MACD signal should use with price action. Users must understand what MACD and price action are all about before using them. If necessary you should attend a course to learn more on Technical Analysis (TA) and Moving Average Convergence Divergence, MACD.
Once again, the website does not guarantee any results or investment return based on the information and instruction you have read here. It should be used as learning aids only and if you decide to trade real money, all trading decision should be your own.