29 May, 2018
J P Morgan Chase & Co ranked top in America’s top 15 largest (in term of Assets) banks by https://www.bankrate.com/.
Today, we will study J P Morgan Chase & Co stock price.
US Stock Chart Analysis
J P Morgan Chase & Company and Moving Average and Bollinger Bands
Picture worth a thousand words, see chart on J P Morgan Chase & Company stock price. What can you get out of the moving average and Bollinger bands.
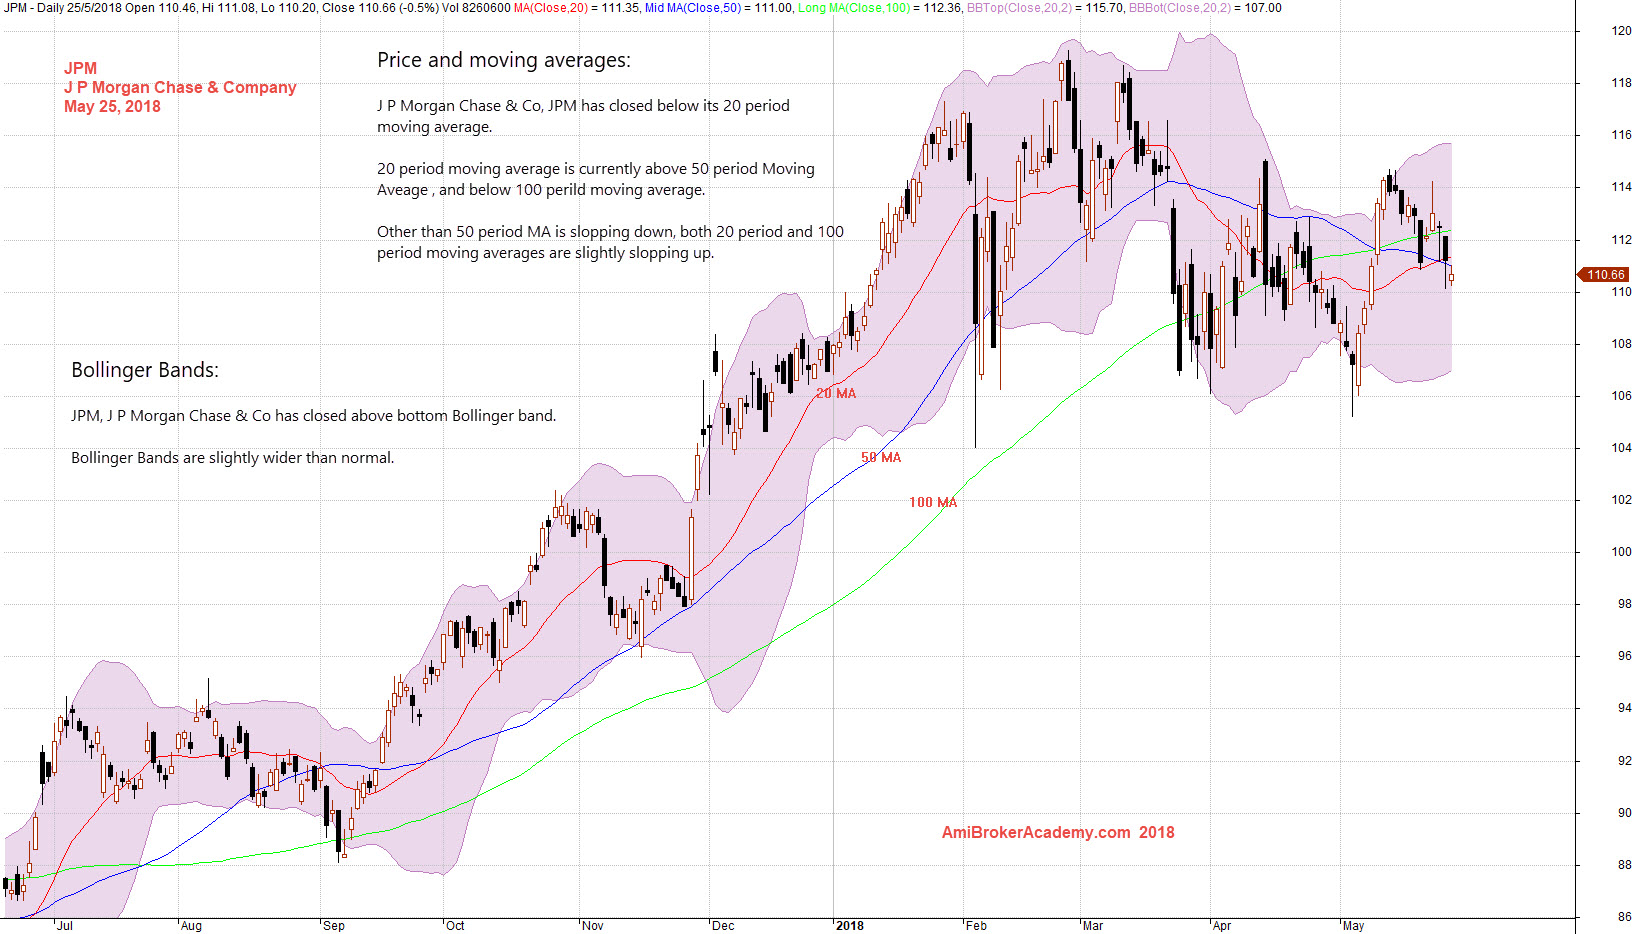
Price and moving averages:
J P Morgan Chase & Co, JPM has closed below its 20 period moving average.
20 period moving average is currently above 50 period Moving Aveage , and below 100 perild moving average.
Other than 50 period MA is slopping down, both 20 period and 100 period moving averages are slightly slopping up.
Bollinger Bands:
JPM, J P Morgan Chase & Co has closed above bottom Bollinger band.
Bollinger Bands are slightly wider than normal.
Manage your risk!
May 25, 2018 J P Morgan Chase & Company and Moving Average and Bollinger Bands
J P Morgan Chase & Company and MA Wave
Picture worth a thousand words, see chart on the trend direction.
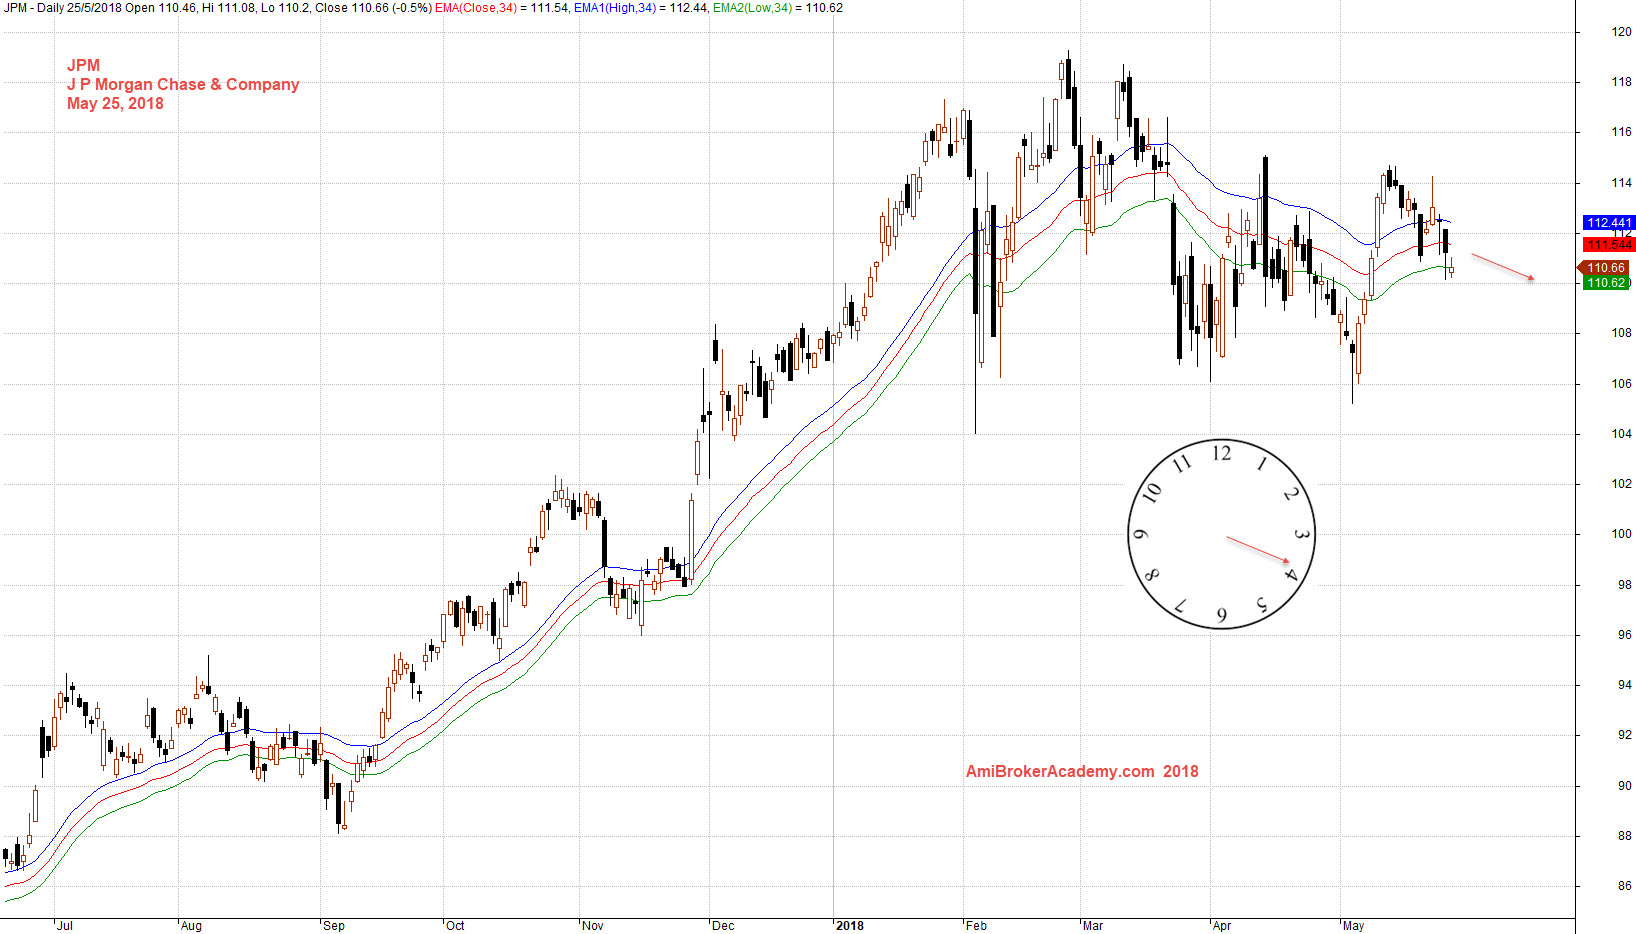
May 25, 2018 J P Morgan Chase & Company and MA Wave
J P Morgan Chase & Company and High Low of Month and Year
Picture worth a thousand words, see chart on the trend direction. On the chart, you could easily spot 2016 is the most volatile of the three years. Manage your risk.
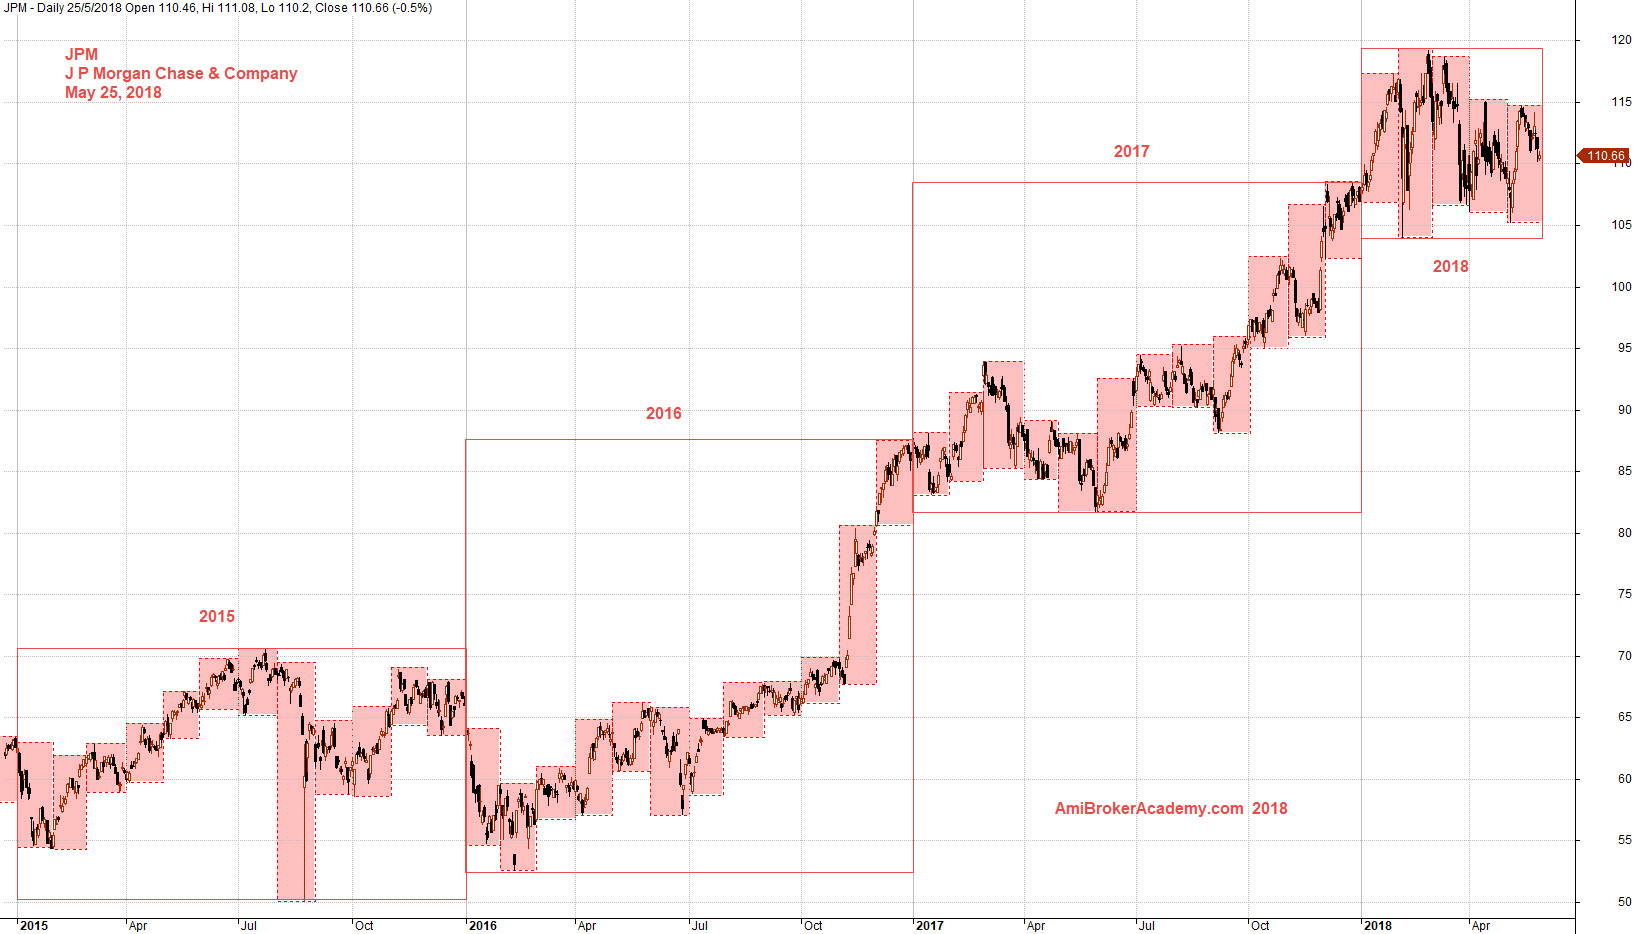
May 25, 2018 J P Morgan Chase & Company and Support Resistance
Moses US Stock Chart Analysis
AmiBrokerAcademy.com
Disclaimer
The above result is for illustration purpose. It is not meant to be used for buy or sell decision. We do not recommend any particular stocks. If particular stocks of such are mentioned, they are meant as demonstration of Amibroker as a powerful charting software and MACD. Amibroker can program to scan the stocks for buy and sell signals.
These are script generated signals. Not all scan results are shown here. The MACD signal should use with price action. Users must understand what MACD and price action are all about before using them. If necessary you should attend a course to learn more on Technical Analysis (TA) and Moving Average Convergence Divergence, MACD.
Once again, the website does not guarantee any results or investment return based on the information and instruction you have read here. It should be used as learning aids only and if you decide to trade real money, all trading decision should be your own.