29 May, 2018
WFC Wells Fargo & Co ranked third in America’s top 15 largest (in term of Assets) banks by https://www.bankrate.com/.
Today, we will study WFC stock price.
US Stock Chart Analysis
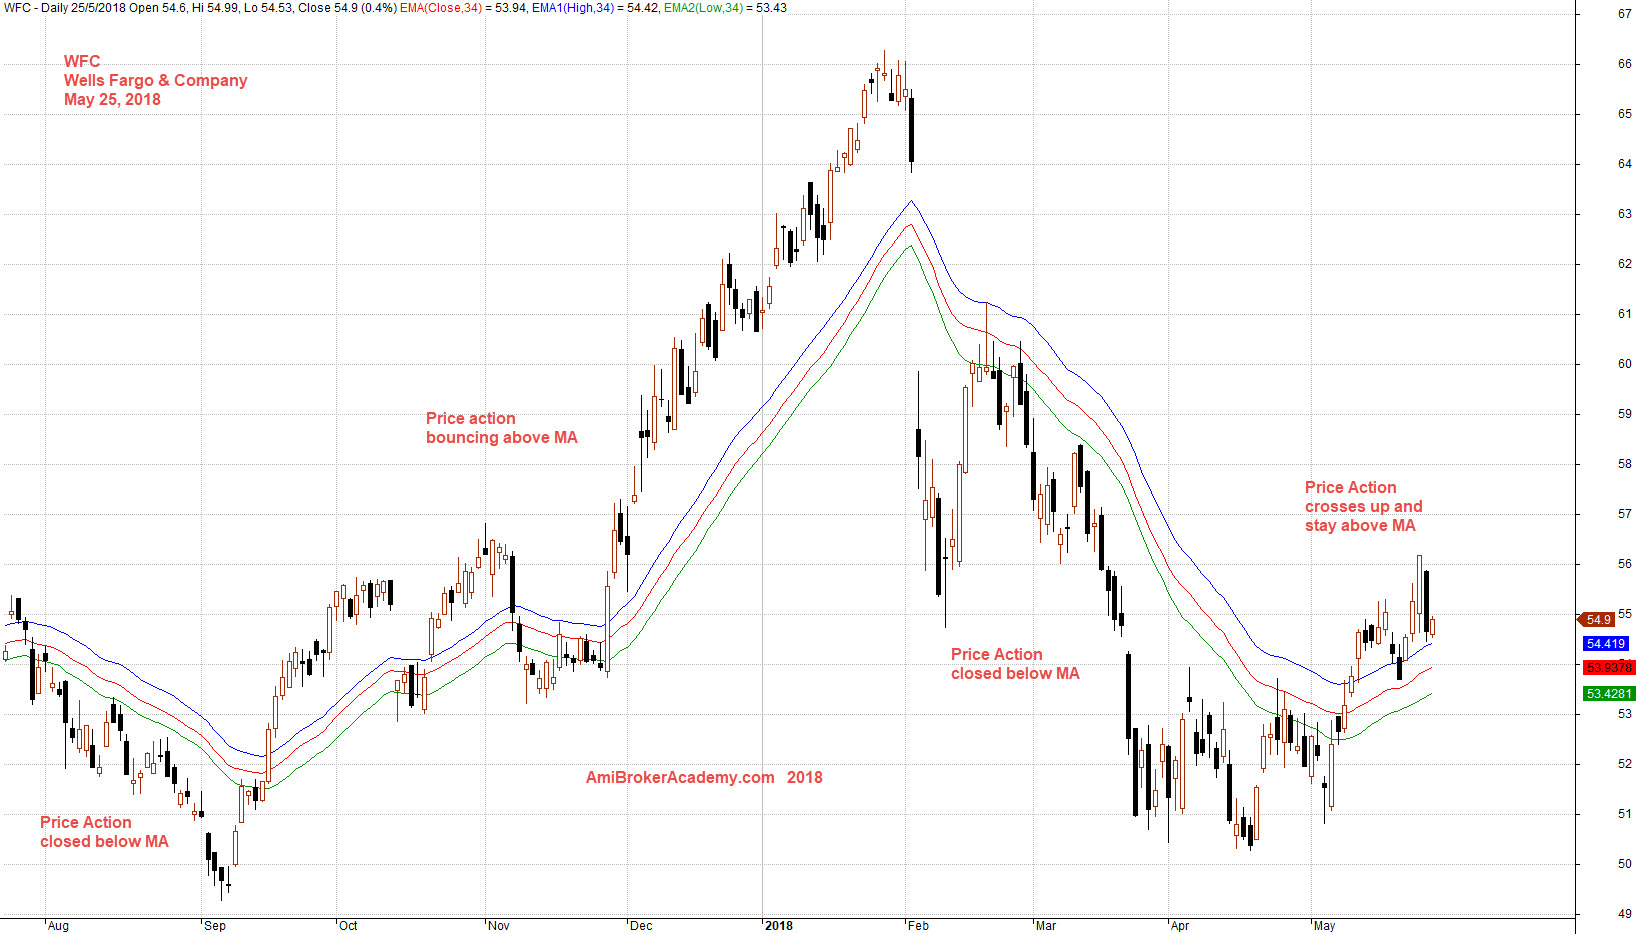
WFC Wells Fargo & Company and Moving Average Wave
Picture worth a thousand words, see chart on Wells Fargo & Company stock price. What can you get out of the moving averages band, we use three MAs, high, low and close.
WFC stock price hits 86 and fail to stay or continue to move higher. The stock price fail to 55, to form a higher low. The stock price get resisted by the MA wave, see chart. The stock price continue to fall lower, to 50. Now the price pullback to 56 and fail again.
Trade with your eyes open.
Manage your risk!
May 25, 2018 Wells Fargo & Company and MA Wave
Moses US Stock Chart Analysis
AmiBrokerAcademy.com
Disclaimer
The above result is for illustration purpose. It is not meant to be used for buy or sell decision. We do not recommend any particular stocks. If particular stocks of such are mentioned, they are meant as demonstration of Amibroker as a powerful charting software and MACD. Amibroker can program to scan the stocks for buy and sell signals.
These are script generated signals. Not all scan results are shown here. The MACD signal should use with price action. Users must understand what MACD and price action are all about before using them. If necessary you should attend a course to learn more on Technical Analysis (TA) and Moving Average Convergence Divergence, MACD.
Once again, the website does not guarantee any results or investment return based on the information and instruction you have read here. It should be used as learning aids only and if you decide to trade real money, all trading decision should be your own.