28 September 2018
Why are those website only show you the stock price listed on top of the google search? Does not make sense right!
Singapore Stock Stories
Thanks for visiting the site.
Z74 Singtel Charting
Study Support Resistance
To maximize your profit and minimize risk is to buy low sell high, or in other words, buy support sell resistance. Study Singtel stock chart, picture worth a thousand words, see price action tested near 4 dollars back in last August, thereafter the price action continue the Bearish ABCD pattern. Can you spot the bearish ABCD pattern? Leg AB from last December till February this year. and the CD leg from May this year till July. Singtel price action tested the low below 3.10.
We add the support resistance at 3.30, see chart.
Trade with eyes open.
Manage your risk.
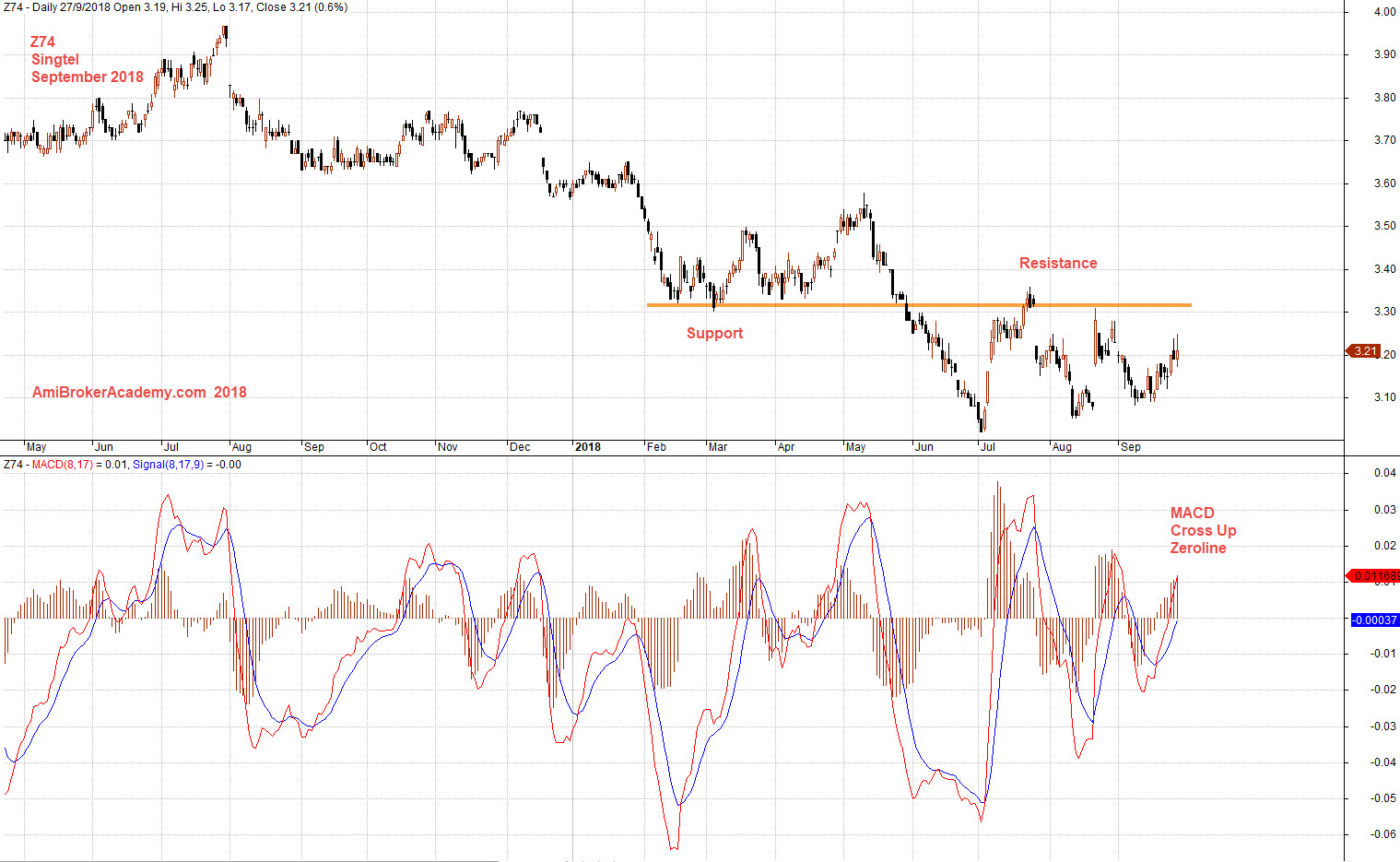
September 27, 2018 Sigtel and MACD
If you can see the whole chart, “press Ctrl and -” to zoom out.
M1
Use the same period and check M1 stock price with MACD indicator, what is your observation? M1 stock price tested near 2.30 and fall below to test the 1.70. After that the price action seems to guided by the 1.70. 1.70 serves as the support to hold the price action for breaking below. Finally, the price action breakout in June this year. See chart. Picture worth a thousand words. The next level so far now is 1.50. Trade with eyes open.
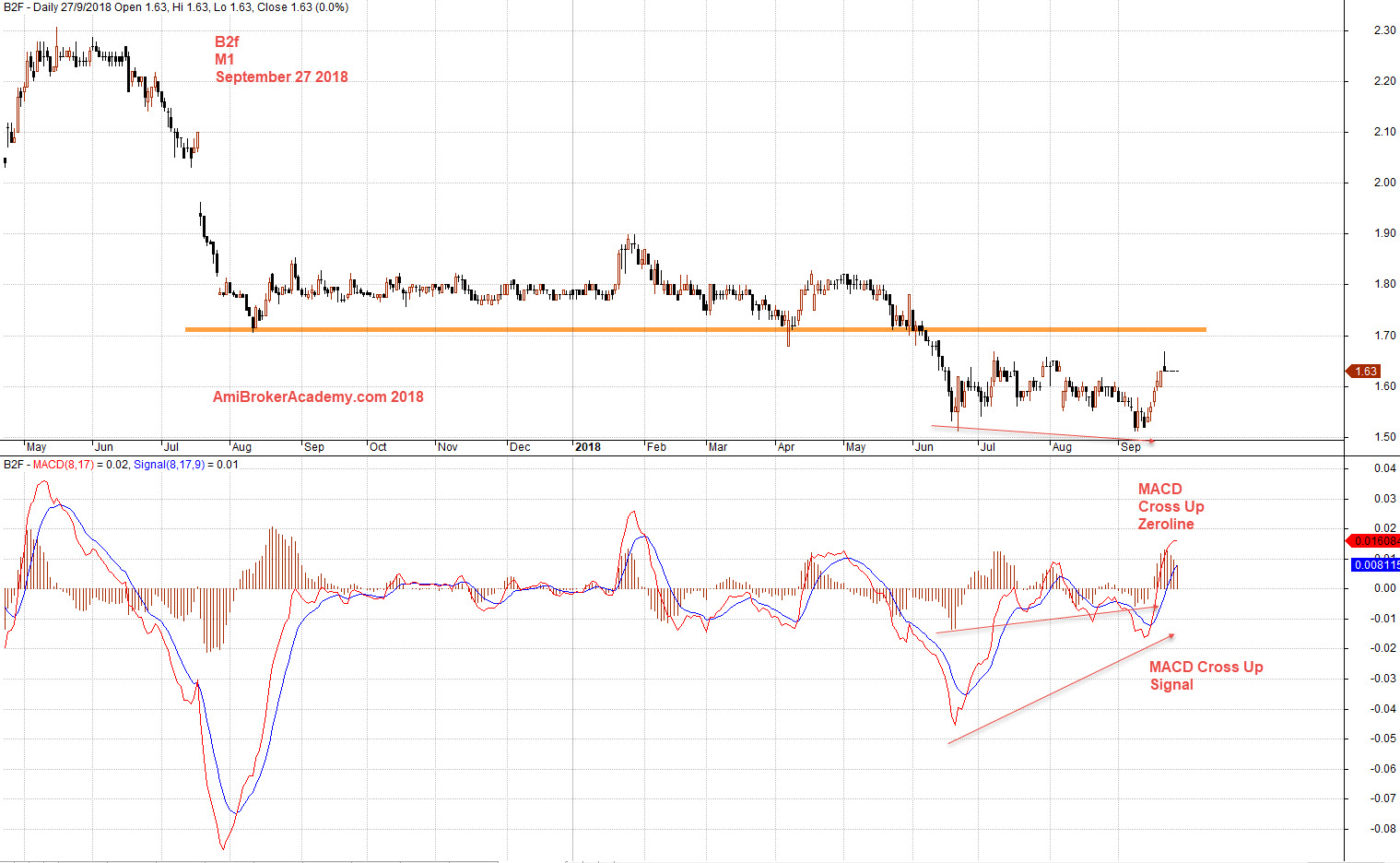
September 27, 2018 M1 and MACD
Starhub
Study the third telco stock price, Starhub compare to Singtel and M1, the stock price went higher in December last year and January this year, hit the 3 dollars and fail. The price just decline day by day until the when the price hit 1.60. To ensure 1.60 is the floor, the price action retest 1.60 again in end August and beginning of September. See chart, picture worth a thousand words.
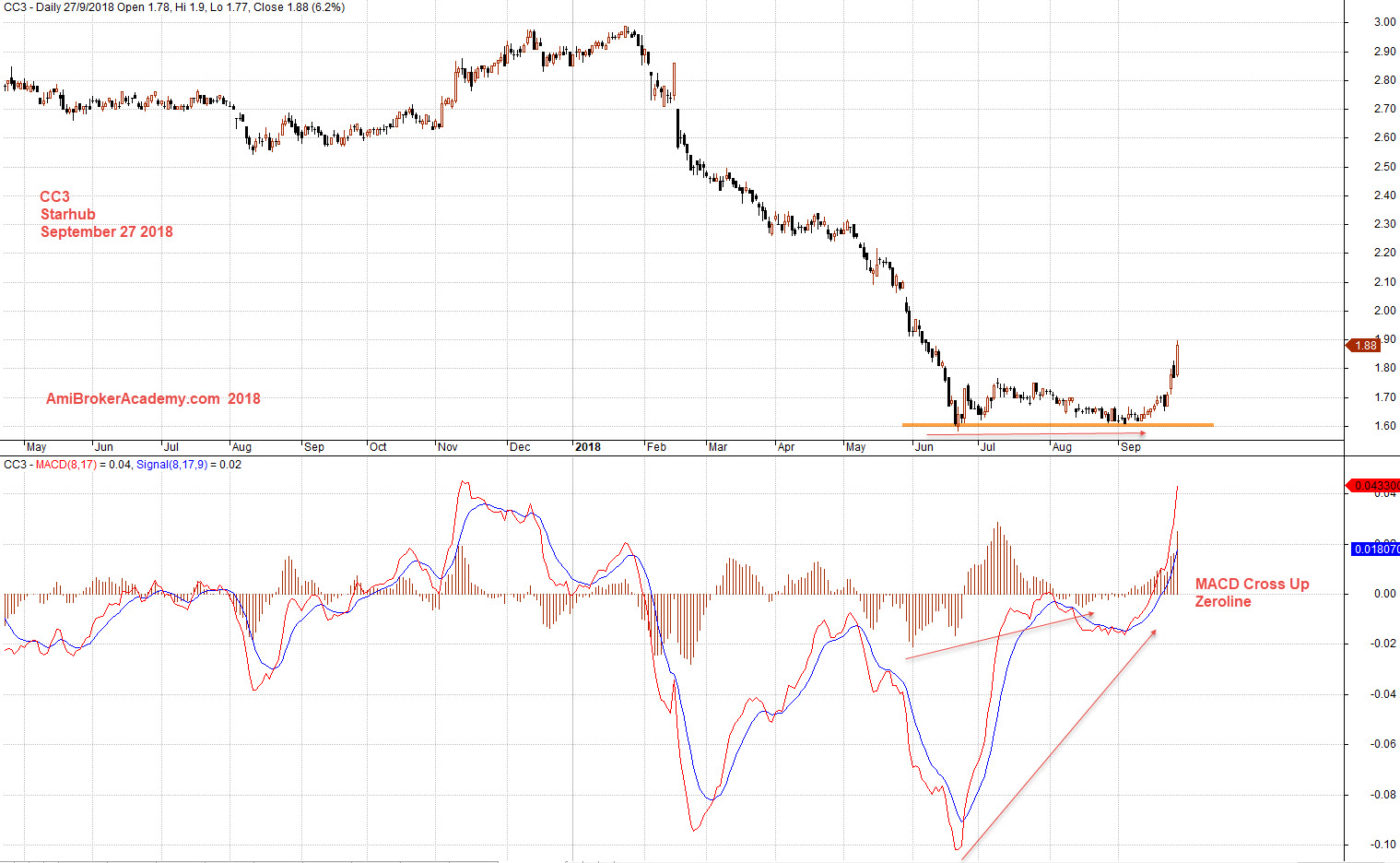
September 27, 2018 Starhub and MACD
Why the three telco are all in the bearish blue? You ask me, I don’t know. This is clearly the market emotion, the market just do not think the price is worth in last May price. Trade with eyes open.
Moses
AmiBrokerAcademy.com – we are different
Disclaimer
The above result is for illustration purpose. It is not meant to be used for buy or sell decision. We do not recommend any particular stocks. If particular stocks of such are mentioned, they are meant as demonstration of Amibroker as a powerful charting software and MACD. Amibroker can program to scan the stocks for buy and sell signals.
These are script generated signals. Not all scan results are shown here. The MACD signal should use with price action. Users must understand what MACD and price action are all about before using them. If necessary you should attend a course to learn more on Technical Analysis (TA) and Moving Average Convergence Divergence, MACD.
Once again, the website does not guarantee any results or investment return based on the information and instruction you have read here. It should be used as learning aids only and if you decide to trade real money, all trading decision should be your own.