28 September, 2018
Thanks for visiting the site.
Moses Stock Stories – Think Think Got More Things
601333.SS Guangshen Railway Company 广深铁路 Charting
We study Guangshen Railway Company 广深铁路 stock chart. We see the stock price fellow the bear trend, and continue the decline into 2010, 2011, all the ways to the low in 2012, 2013 and 2014. Stock price started to be bullish from 2014. The stock price tested the high in 2015 near 9.5 RMB. So far this is the best peak 广深铁路 had. See chart, the support resistance we added. The price action seems to be stopped by these support. The price action had never closed below them. Trade with your eyes open.
Manage Your Risk!
Imagine you bought some stock at the start of 2010. The price now is probably below your purchased price. As you were thinking buy high, and sell higher. The trouble you did not release them to take profit when you have recovered your purchase price. As you were thinking the stock price may be going higher than 9.5. You see, trade with eyes open, and not think.
In trading, there is no right no wrong. Just for the technical analysis, rule. Buy support sell resistance. Take profit when price breakout below the bull trendline.
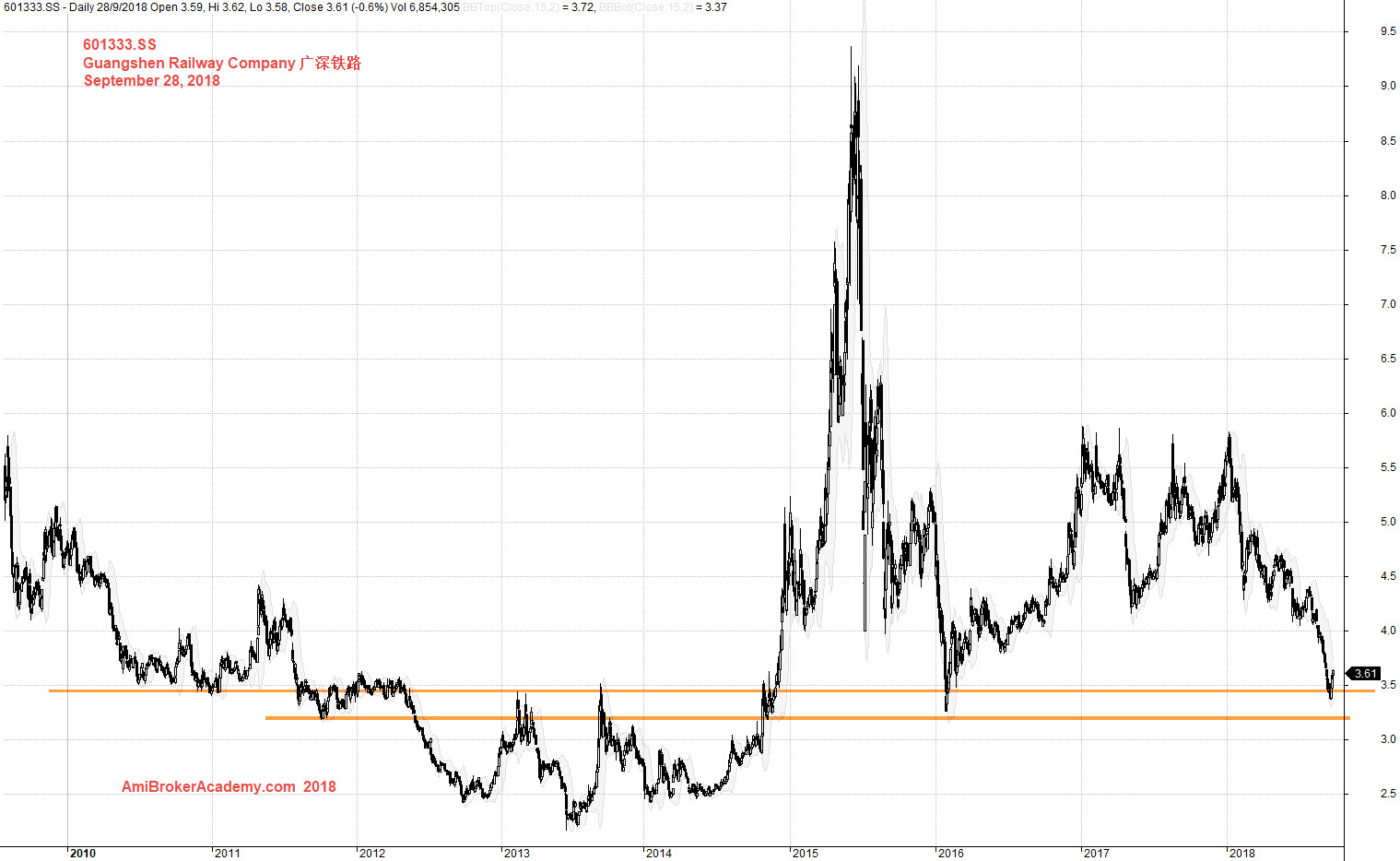
September 28, 2018 Guangshen Railway Company 广深铁路 Charting
If you can see the whole chart, “press Ctrl and -” to zoom out to see the entire chart.
Add MACD indicator, see the price action and MACD. Trade with your eyes open. Manage your risk.
This is a monthly chart, so the movement seem simple, but if you will trading in daily. The result will be different. Have fun.
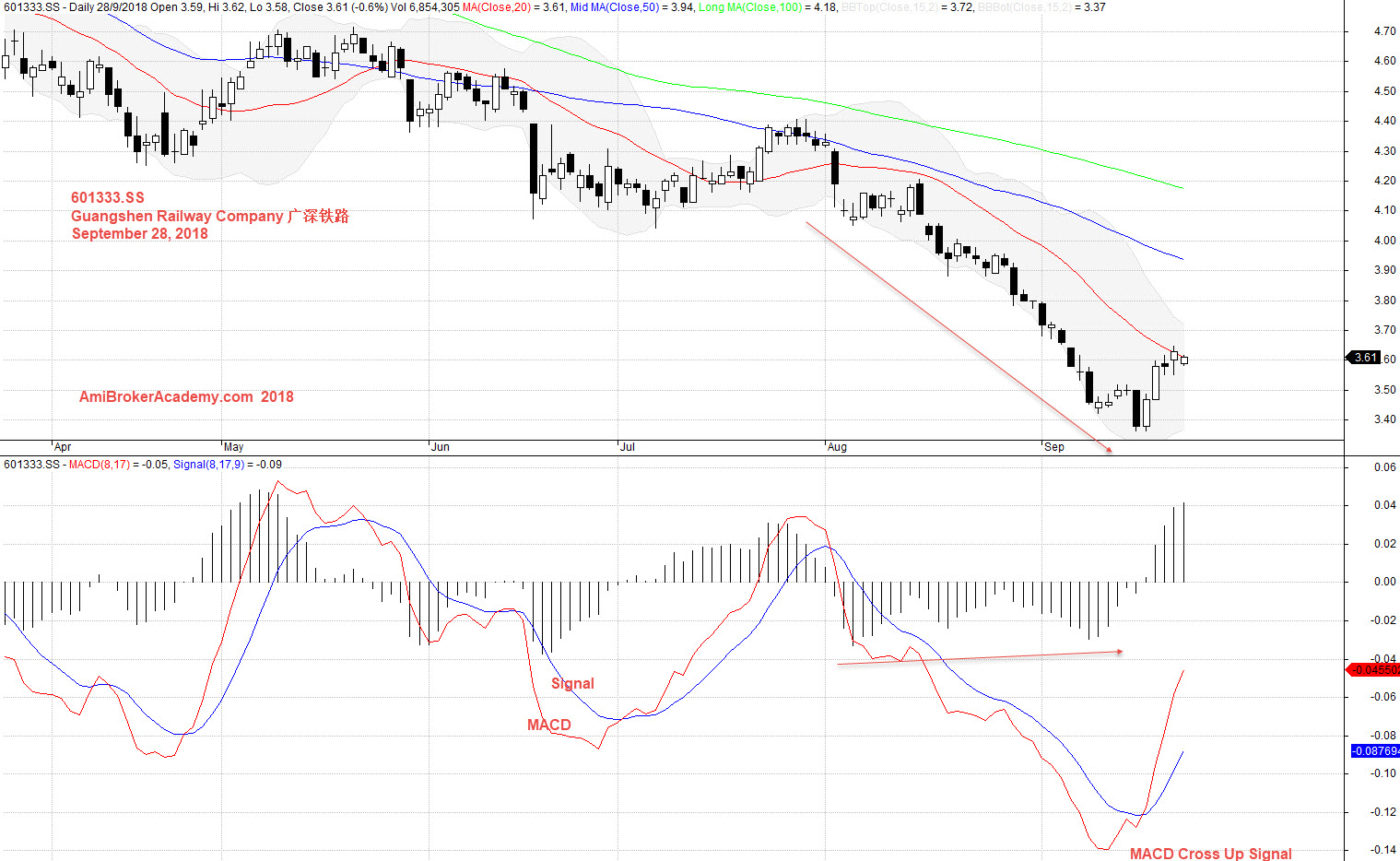
September 28, 2018 Guangshen Railway Company 广深铁路 and MACD
Moses
AmiBrokerAcademy.com
Disclaimer
The above result is for illustration purpose. It is not meant to be used for buy or sell decision. We do not recommend any particular stocks. If particular stocks of such are mentioned, they are meant as demonstration of Amibroker as a powerful charting software and MACD. Amibroker can program to scan the stocks for buy and sell signals.
These are script generated signals. Not all scan results are shown here. The MACD signal should use with price action. Users must understand what MACD and price action are all about before using them. If necessary you should attend a course to learn more on Technical Analysis (TA) and Moving Average Convergence Divergence, MACD.
Once again, the website does not guarantee any results or investment return based on the information and instruction you have read here. It should be used as learning aids only and if you decide to trade real money, all trading decision should be your own.