July 12, 2017
After Study ST Index Magic Levels
After we study The Straits Times Index, STI magic levels in our recent post. We benchmarked US Stock Index, NASDAQ Composite and ST Index. …
Let’s study some stock, like Amara Holdings. enjoy learning!
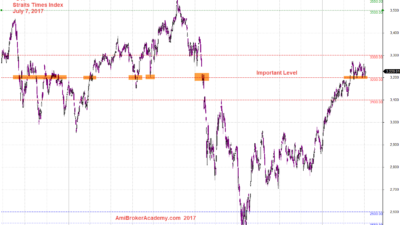
July 7, 2017 Singapore Straits Times Index and Major Levels
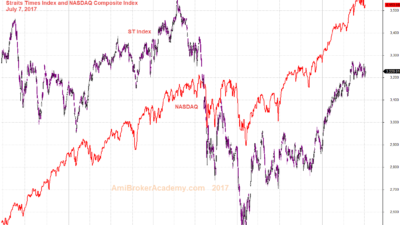
July 7, 2017 The Straits Times Index benchmark US NASDAQ Composite Index
A34 Amara Holdings and Ten Years Trapped
Picture worth a thousand words, in easily identify the trap in the last ten years, other than the 2007 and 2008 The Great Recession.
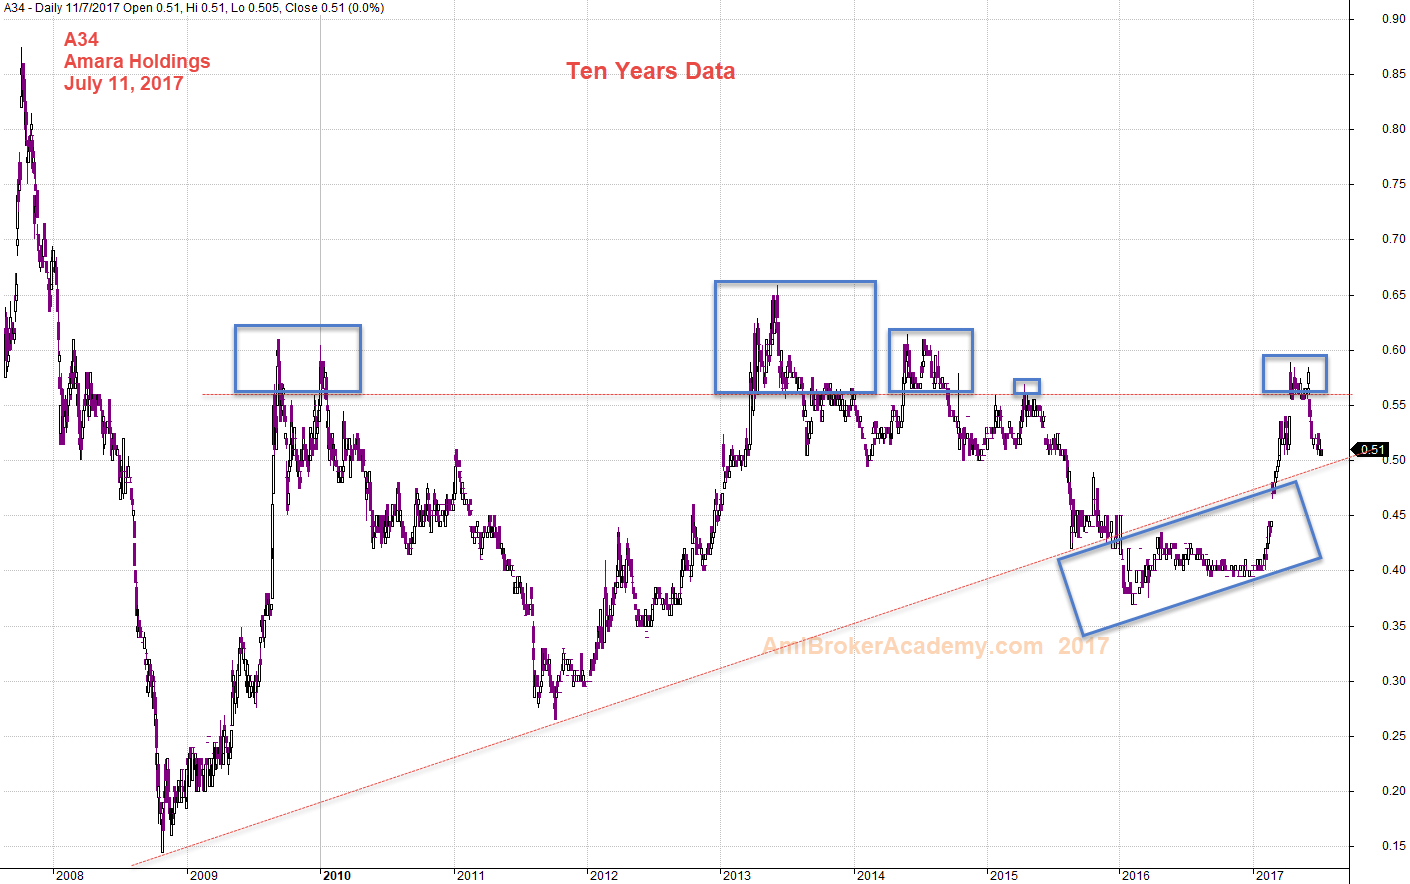
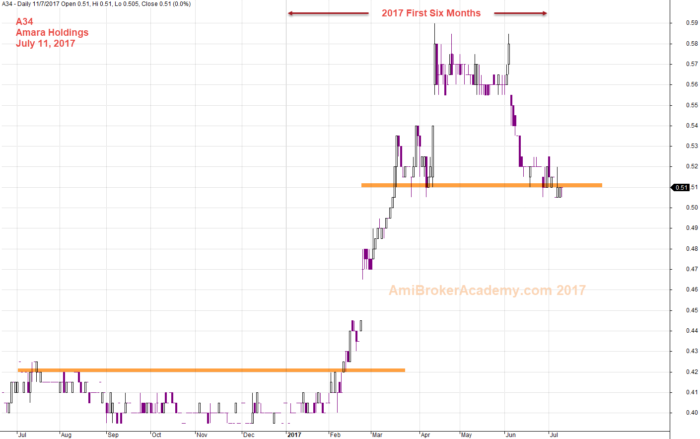
July 11, 2017 Amara Holdings and Its Ten Years and Trapped
First Six Months Share Price Performance for A34
Picture worth a thousand words, you can see this stock suddenly become bullish. Why? Do you know? I don’t. And I am also not interested to know why? There are too many reason can results in a bouncing up. Something the market knows in the early 2017 to buy up and some thing the market knows that they are taking profit in last month. ??
The price has a triple tops, or tested the 58 cents a few times before drifted south. Trade with eyes open. Good news is old news, and bad news is old news too.
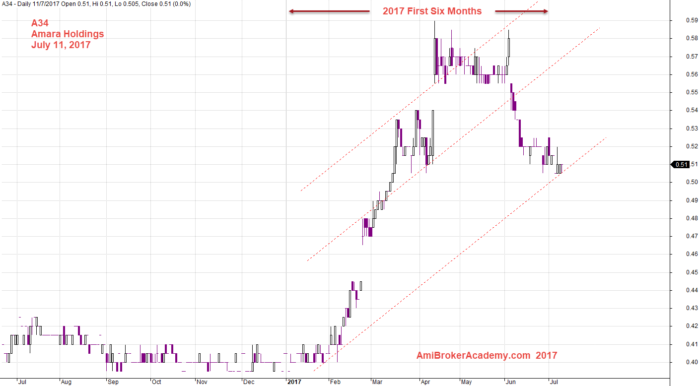
July 11, 2017 Amara Holding and Its Six Months Channels
First Six Months 2017 and A34 Amara Holdings
The level draw the price had responded well. Trade with eyes open.
July 11, 2017 Amara Holdings and Support Resistance
A34 Amara Holdings and MACD Signals
Picture worth a thousand words, the MACD strength can be clue to some of the share price development. Have fun learning.
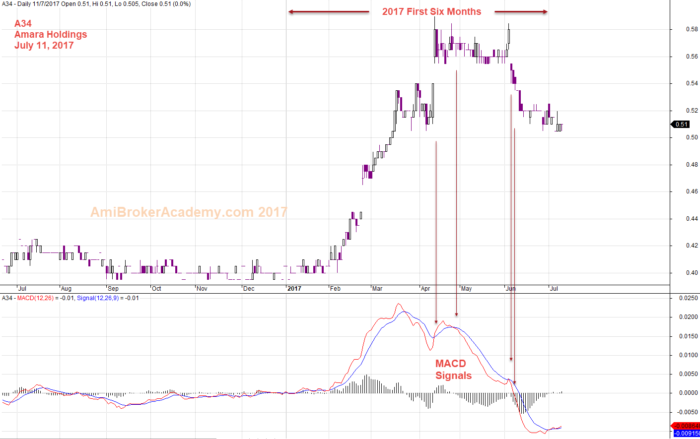
July 11, 2017 Amara Holdings and MACD Signals
Moses Stock Analysis
AmiBrokerAcademy.com
Disclaimer
The above result is for illustration purpose. It is not meant to be used for buy or sell decision. We do not recommend any particular stocks. If particular stocks of such are mentioned, they are meant as demonstration of Amibroker as a powerful charting software and MACD. Amibroker can program to scan the stocks for buy and sell signals.
These are script generated signals. Not all scan results are shown here. The MACD signal should use with price action. Users must understand what MACD and price action are all about before using them. If necessary you should attend a course to learn more on Technical Analysis (TA) and Moving Average Convergence Divergence, MACD.
Once again, the website does not guarantee any results or investment return based on the information and instruction you have read here. It should be used as learning aids only and if you decide to trade real money, all trading decision should be your own.