July 12, 2017
^IXIC US NASDAQ Composite and Major Support Resistance
Picture worth a thousand words, it easily identify the support resistance, and support resistance zone. The price action response to the level or zone.
NASDAQ was bullish in second half of 2016, and the bull continues to be strong to drive the composite index further north. But June is a critical month. The index suddenly pullback to quite south, retest the April high. Why? Don’t know. Is it important to know why? Sure, to know what is installed ahead of us. But more importantly while finding out why? And normally, it take two three years for some expert to give you the true cause. It is wise to trade carefully for the next few months.
It could be just a pullback for a greater rally. Or the market could be suddenly lost confident and the retest the high and complete a real reversal. Watch your trade!
In the near term, many market may have been affected by this strong pullback. …
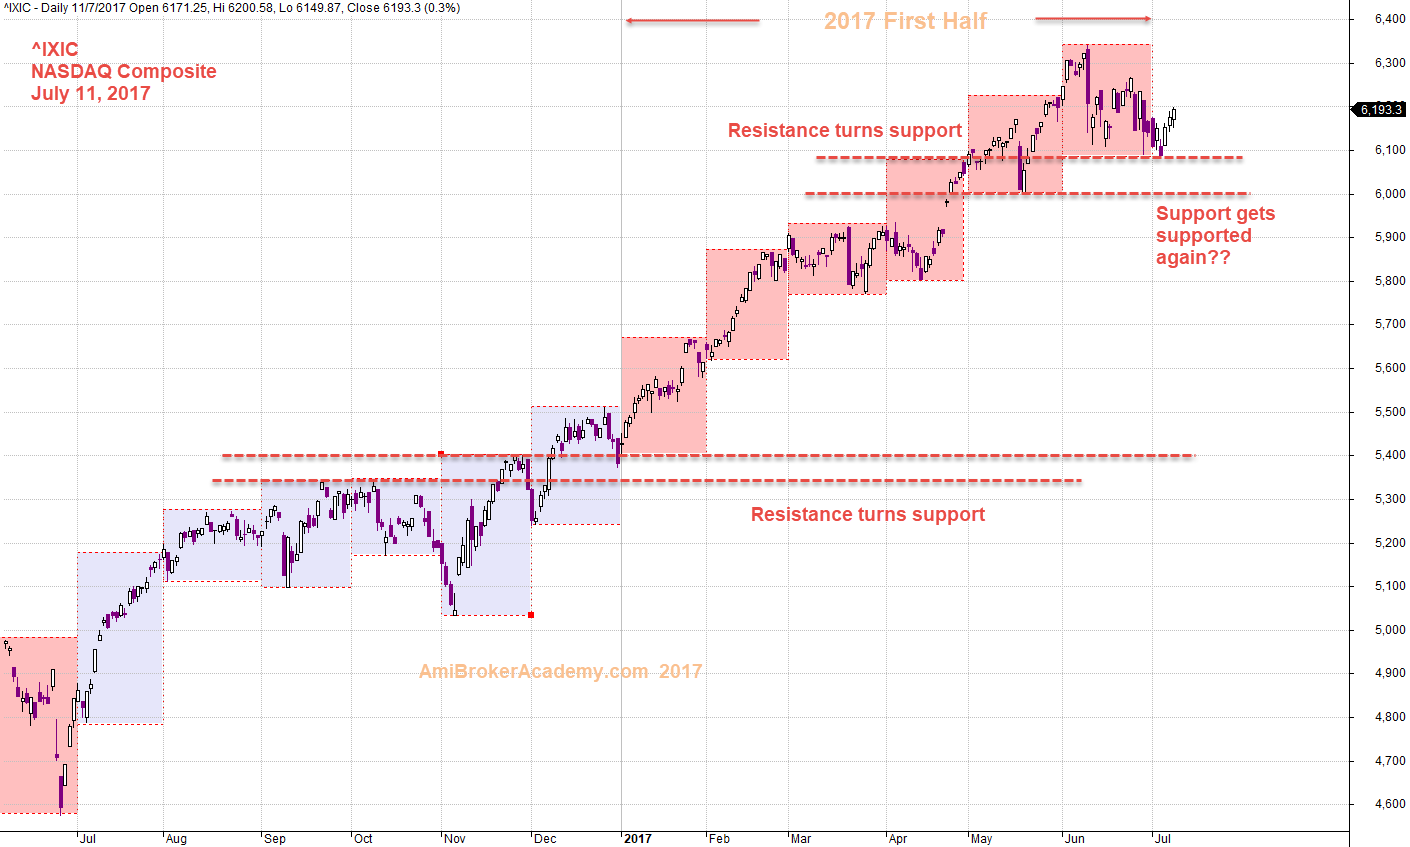
July 11, 2017 US NASDAQ Composite and Major Support Resistance
MACD Signals in US NASDAQ First Six Months
Picture worth a thousand words, you can see this composite become not bullish now or pullback. Why? Do you know? I don’t. And I am also not interested to know why? There are too many reason can results in a fall like this.
The price has completed lower high and may complete the third one …. Trade with eyes open. Good news is old news, and bad news is old news too.
Watch the MACD signals too, they may have some clue from the indicator.
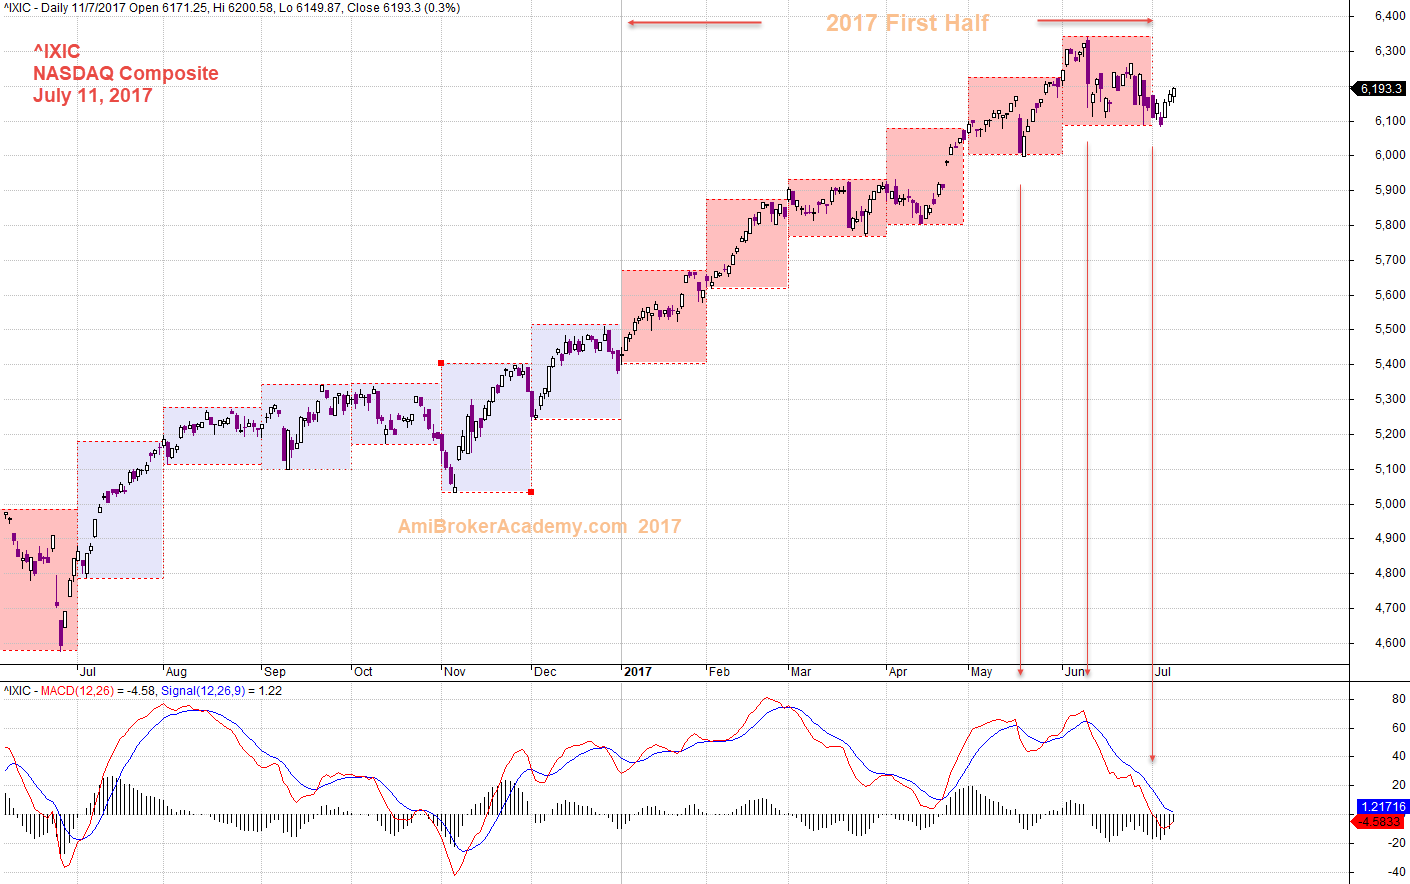
July 11, 2017 US NASDAQ Composite and MACD Signals
Moses Stock Analysis
AmiBrokerAcademy.com
Disclaimer
The above result is for illustration purpose. It is not meant to be used for buy or sell decision. We do not recommend any particular stocks. If particular stocks of such are mentioned, they are meant as demonstration of Amibroker as a powerful charting software and MACD. Amibroker can program to scan the stocks for buy and sell signals.
These are script generated signals. Not all scan results are shown here. The MACD signal should use with price action. Users must understand what MACD and price action are all about before using them. If necessary you should attend a course to learn more on Technical Analysis (TA) and Moving Average Convergence Divergence, MACD.
Once again, the website does not guarantee any results or investment return based on the information and instruction you have read here. It should be used as learning aids only and if you decide to trade real money, all trading decision should be your own.