6 February, 2019
Welcome to AmiBrokerAcademy.com. We provide US stock analysis for academy learning.
Think!
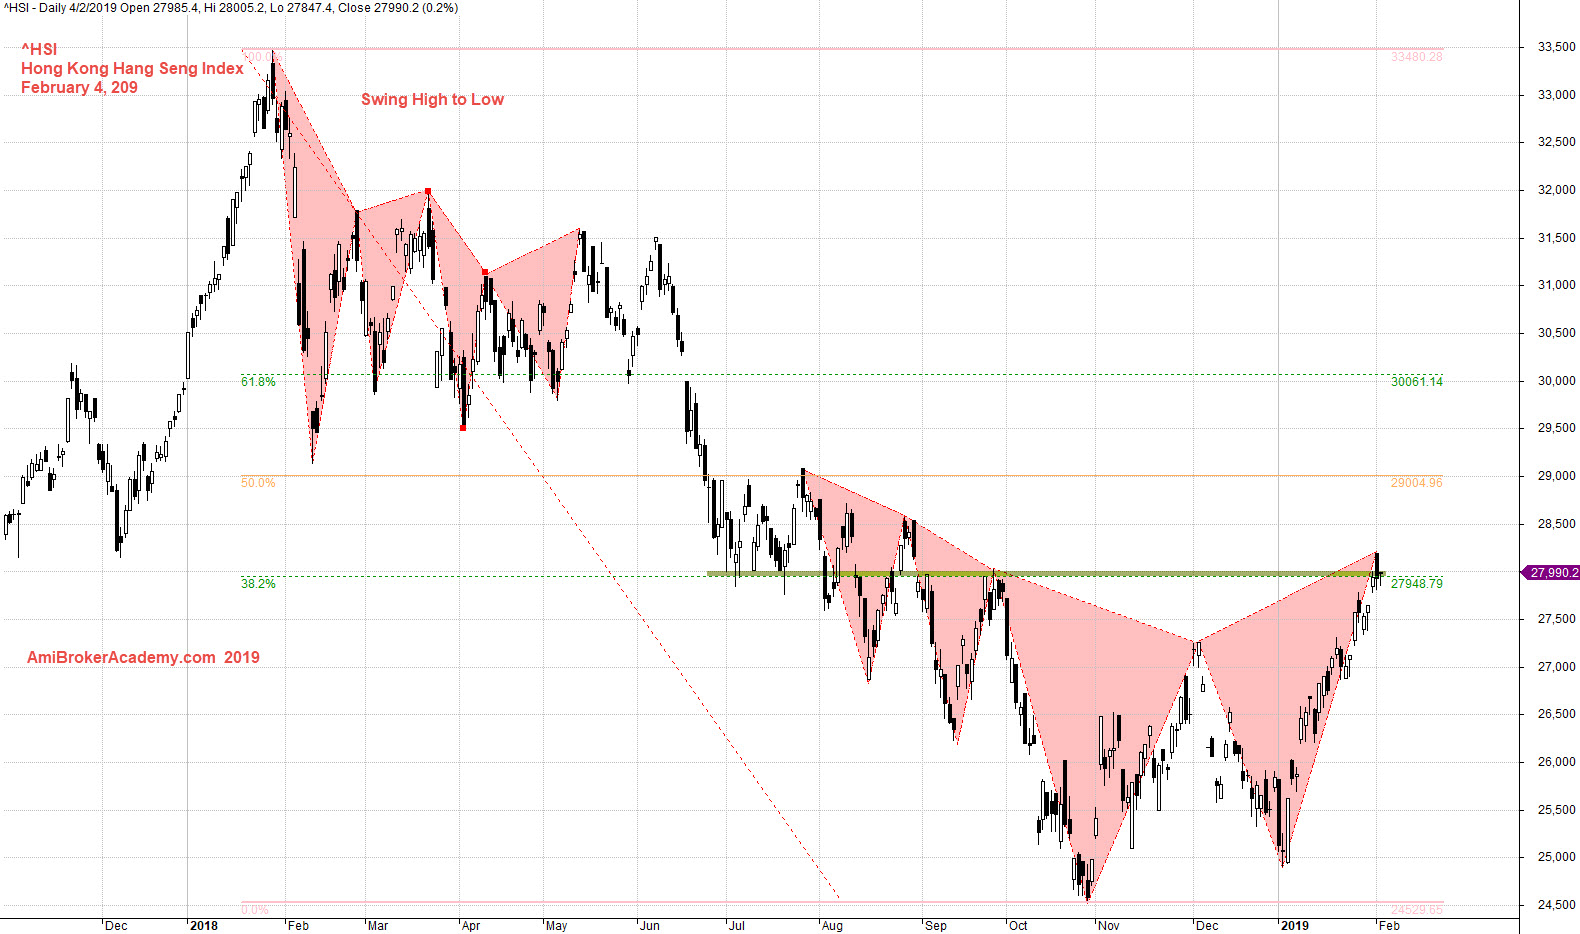
^HSI Hong Kong Hang Seng Index Stock Charting
Study Hong Kong Hang Seng Index stock chart.
Price action after the peak ar 33500 level in 2018, the price action just keep going lower and lower.
Price action finally come to the stop from going lower in last October. The price action get support at 24500 level.
Price action get a pullback since then, the price action tested 38%. Price action was support at 38% and turn 38% into resistance. Will price action resisted by 38% or not? Will see.
Trade with eyes open.
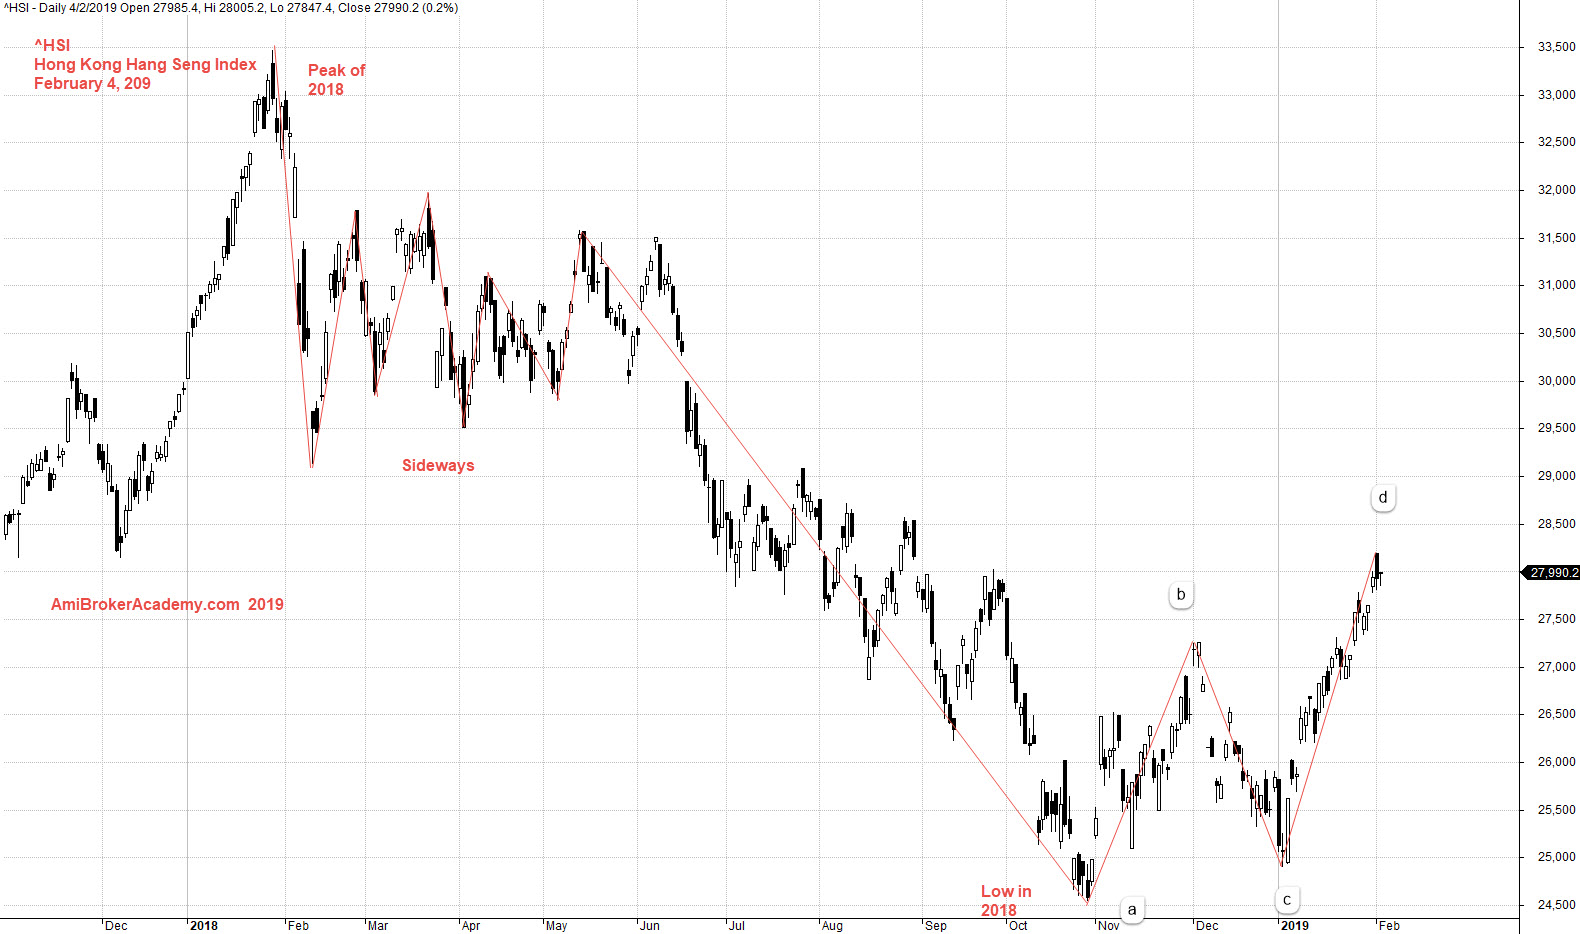
Study the chart on the wave count, see the movement and price action.
Moses Stock Analysis
AmiBrokerAcademy.com
Disclaimer
The above result is for illustration purpose. It is not meant to be used for buy or sell decision. We do not recommend any particular stocks. If particular stocks of such are mentioned, they are meant as demonstration of Amibroker as a powerful charting software and MACD. Amibroker can program to scan the stocks for buy and sell signals.
These are script generated signals. Not all scan results are shown here. The MACD signal should use with price action. Users must understand what MACD and price action are all about before using them. If necessary you should attend a course to learn more on Technical Analysis (TA) and Moving Average Convergence Divergence, MACD.
Once again, the website does not guarantee any results or investment return based on the information and instruction you have read here. It should be used as learning aids only and if you decide to trade real money, all trading decision should be your own.