6 February, 2019
Welcome to AmiBrokerAcademy.com. We provide US stock analysis for academy learning.
Think!
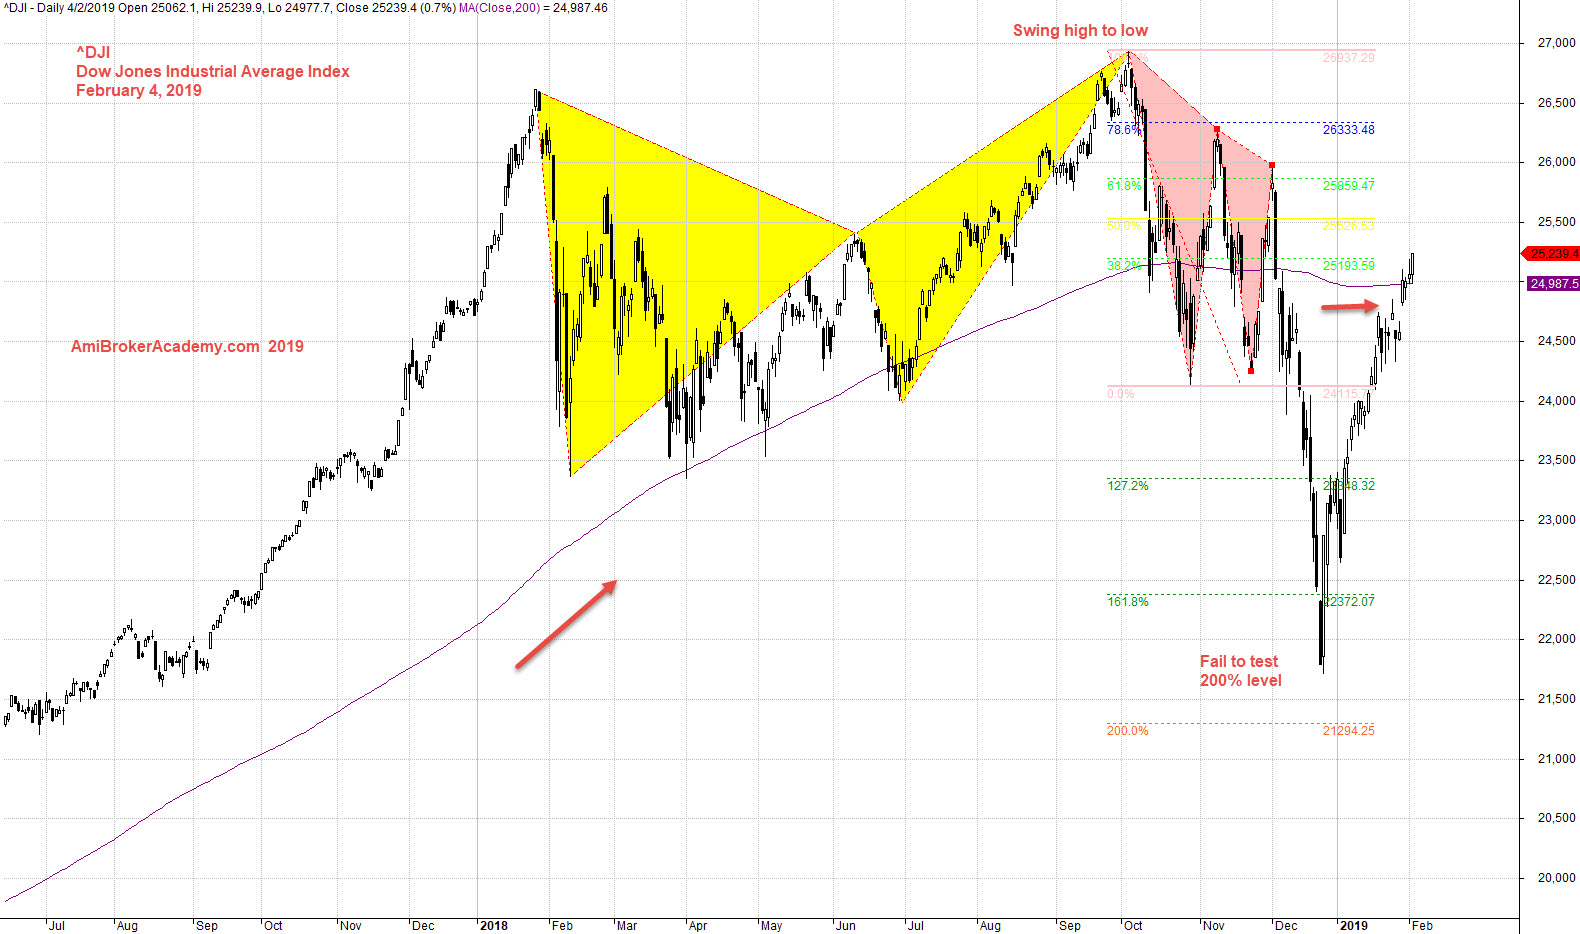
^DJI Dow Jones Industrial Average Index Stock Charting
Study Dow Jones Industrial Average Index stock chart.
Where do you think the price action will be heading? From a moving average, such as 200 MA.
200 MA slopping up and price action above the 200 MA. Next, the price action pullback and 200 MA become support to ensure the price action still bounce up. However, the price action can no longer can hold the falling out price action. Price action finally cross and close below 200 MA.
MA from slopping up to going flat.
Trade with eyes open.
Moses Stock Analysis
AmiBrokerAcademy.com
Disclaimer
The above result is for illustration purpose. It is not meant to be used for buy or sell decision. We do not recommend any particular stocks. If particular stocks of such are mentioned, they are meant as demonstration of Amibroker as a powerful charting software and MACD. Amibroker can program to scan the stocks for buy and sell signals.
These are script generated signals. Not all scan results are shown here. The MACD signal should use with price action. Users must understand what MACD and price action are all about before using them. If necessary you should attend a course to learn more on Technical Analysis (TA) and Moving Average Convergence Divergence, MACD.
Once again, the website does not guarantee any results or investment return based on the information and instruction you have read here. It should be used as learning aids only and if you decide to trade real money, all trading decision should be your own.