July 29, 2017
After So Long, …
We used to focus on stocks fifty one dollars ($51) and more with 8,000,000 shares changed hand. The following scan is for stocks between five dollars ($5) and fifty dollars ($50) with 10,000,000 shares changed hand that have MACD signals. Watch this space here in the future for more. Thanks for being here. Enjoy reading.
Free US Stock MACD Scan for Last Week Trading Day Close Between July 24 to July 28, 2017.
Welcome to Moses’s Stock Scan at AmiBrokerAcademy.com.
The following are US stocks five-day MACD screening using Amibroker script . These stocks screening script narrow the selection to stocks between the value of five dollars ($5) and fifty dollars ($50) with at least 10,000,000 shares changed hands.
We Look For the following Four MACD Signals:
- Crossovers – Sell Strategy, MACD crosses below the signal line. Buy Strategy, MACD rallies above the signal line. It is advisable to wait for confirmation to reduce possible whipsaw.
- Divergence – The security price action diverges from the MACD. It signals the end of the current trend.
- Cross Zero Line – MACD moves above or below zero line. Upward trend: Cross above zero line, short MA above long MA. Downward trend: Cross below zero line, short MA below long MA.
- Dramatic rise or fall – MACD rises or decline dramatically – when the shorter moving average pulls away from the longer-term moving average – Oversold or Overbought.
We vary the selection criteria, ie narrow down to 10,000,000 stocks changed hands. But to increase the catch we widen to $5 to $50. The change in selection and re do the scan only take less than fifteen minutes.
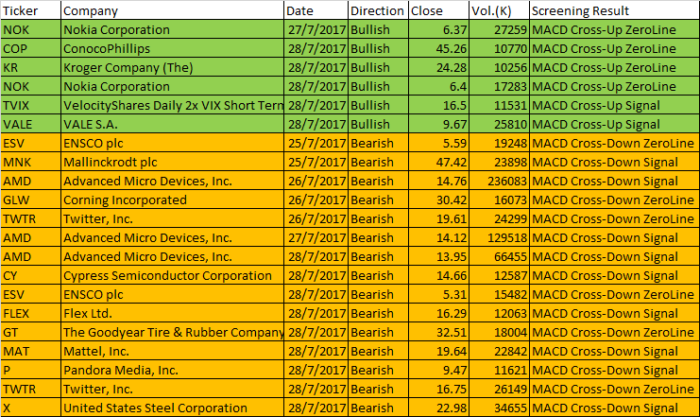
July 24 to July 28, 2017 US Stocks MACD Scan for Stocks between $5 to $50
| Ticker | Company | Date | Direction | Close | Vol.(K) | Screening Result |
| NOK | Nokia Corporation | 27/7/2017 | Bullish | 6.37 | 27259 | MACD Cross-Up ZeroLine |
| COP | ConocoPhillips | 28/7/2017 | Bullish | 45.26 | 10770 | MACD Cross-Up ZeroLine |
| KR | Kroger Company (The) | 28/7/2017 | Bullish | 24.28 | 10256 | MACD Cross-Up ZeroLine |
| NOK | Nokia Corporation | 28/7/2017 | Bullish | 6.4 | 17283 | MACD Cross-Up ZeroLine |
| TVIX | VelocityShares Daily 2x VIX Short Term ETN | 28/7/2017 | Bullish | 16.5 | 11531 | MACD Cross-Up Signal |
| VALE | VALE S.A. | 28/7/2017 | Bullish | 9.67 | 25810 | MACD Cross-Up Signal |
| ESV | ENSCO plc | 25/7/2017 | Bearish | 5.59 | 19248 | MACD Cross-Down ZeroLine |
| MNK | Mallinckrodt plc | 25/7/2017 | Bearish | 47.42 | 23898 | MACD Cross-Down Signal |
| AMD | Advanced Micro Devices, Inc. | 26/7/2017 | Bearish | 14.76 | 236083 | MACD Cross-Down Signal |
| GLW | Corning Incorporated | 26/7/2017 | Bearish | 30.42 | 16073 | MACD Cross-Down ZeroLine |
| TWTR | Twitter, Inc. | 26/7/2017 | Bearish | 19.61 | 24299 | MACD Cross-Down ZeroLine |
| AMD | Advanced Micro Devices, Inc. | 27/7/2017 | Bearish | 14.12 | 129518 | MACD Cross-Down Signal |
| AMD | Advanced Micro Devices, Inc. | 28/7/2017 | Bearish | 13.95 | 66455 | MACD Cross-Down Signal |
| CY | Cypress Semiconductor Corporation | 28/7/2017 | Bearish | 14.66 | 12587 | MACD Cross-Down Signal |
| ESV | ENSCO plc | 28/7/2017 | Bearish | 5.31 | 15482 | MACD Cross-Down ZeroLine |
| FLEX | Flex Ltd. | 28/7/2017 | Bearish | 16.29 | 12063 | MACD Cross-Down Signal |
| GT | The Goodyear Tire & Rubber Company | 28/7/2017 | Bearish | 32.51 | 18004 | MACD Cross-Down ZeroLine |
| MAT | Mattel, Inc. | 28/7/2017 | Bearish | 19.64 | 22842 | MACD Cross-Down Signal |
| P | Pandora Media, Inc. | 28/7/2017 | Bearish | 9.47 | 11621 | MACD Cross-Down Signal |
| TWTR | Twitter, Inc. | 28/7/2017 | Bearish | 16.75 | 26149 | MACD Cross-Down ZeroLine |
| X | United States Steel Corporation | 28/7/2017 | Bearish | 22.98 | 34655 | MACD Cross-Down Signal |
Announcement:
As said, we will be doing the stocks scan for stocks between five dollars ($5) and fifty dollars ($50) that have MACD signals. This is it. Enjoy reading.
Moses
AmiBrokerAcademy.com
Disclaimer
The above result is for illustration purpose. It is not meant to be used for buy or sell decision. We do not recommend any particular stocks. If particular stocks of such are mentioned, they are meant as demonstration of Amibroker as a powerful charting software and MACD. Amibroker can program to scan the stocks for buy and sell signals.
These are script generated signals. Not all scan results are shown here. The MACD signal should use with price action. Users must understand what MACD and price action are all about before using them. If necessary you should attend a course to learn more on Technical Analysis (TA) and Moving Average Convergence Divergence, MACD.
Once again, the website does not guarantee any results or investment return based on the information and instruction you have read here. It should be used as learning aids only and if you decide to trade real money, all trading decision should be your own.