July 29, 2017
Recently, we updated China Shanghai Stock Exchange Composite Index Analysis
Now, let study another Asia index, such as Nikkei for better understanding the Asia market.
Japan Stock Index Nikkei 225 Index and Support Resistance
See chart for more, picture worth a thousand words.
After the last high, the bar keep closing lower and lower. At least we see resistance turns support. It means the trend is still bullish.
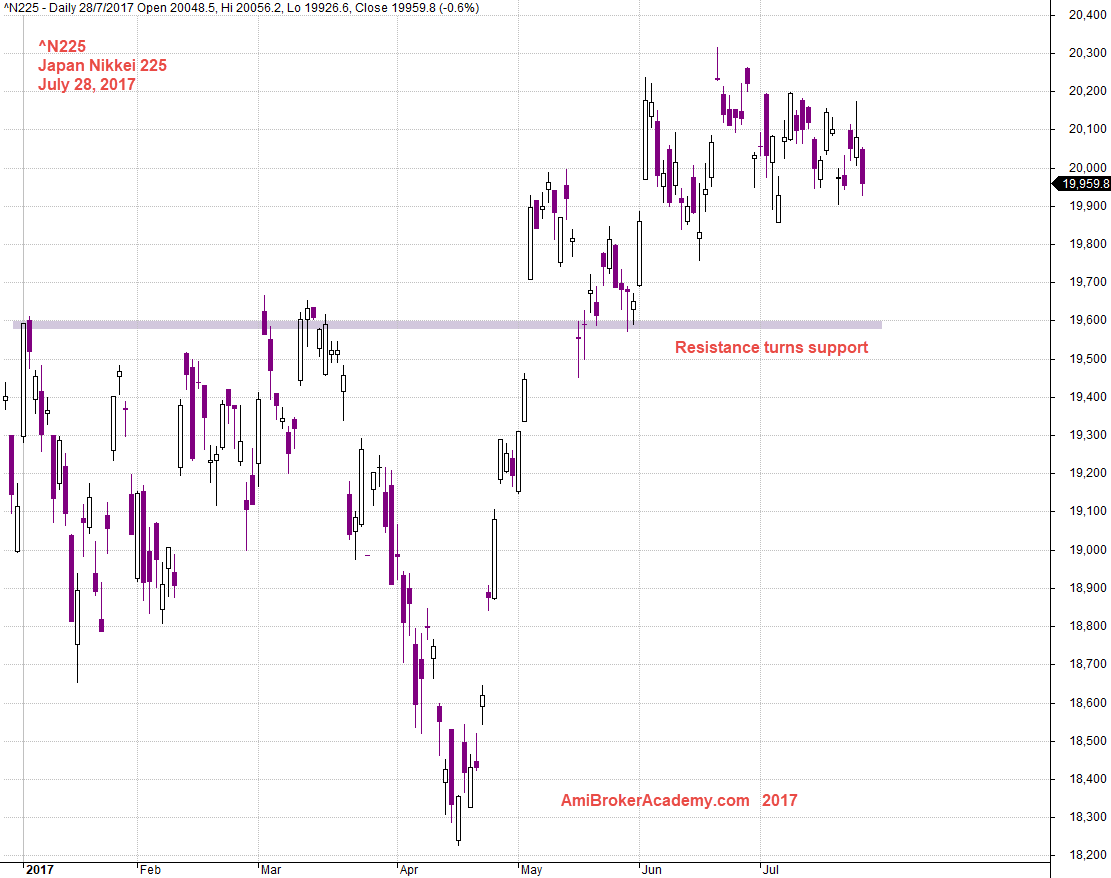
July 28, 2017 Japan Nikkei 225 and Support Resistance
See other analysis on Hong Kong Index and Singapore Index.
Thanks for visit the site here. You could also find free MACD scan here in this site too.
Moses
AmiBrokerAcademy.com
Disclaimer
The above result is for illustration purpose. It is not meant to be used for buy or sell decision. We do not recommend any particular stocks. If particular stocks of such are mentioned, they are meant as demonstration of Amibroker as a powerful charting software and MACD. Amibroker can program to scan the stocks for buy and sell signals.
These are script generated signals. Not all scan results are shown here. The MACD signal should use with price action. Users must understand what MACD and price action are all about before using them. If necessary you should attend a course to learn more on Technical Analysis (TA) and Moving Average Convergence Divergence, MACD.
Once again, the website does not guarantee any results or investment return based on the information and instruction you have read here. It should be used as learning aids only and if you decide to trade real money, all trading decision should be your own.